uniapp中使用ucharts实现天气预报折线图
需求:在小程序里面展示24小时天气预报
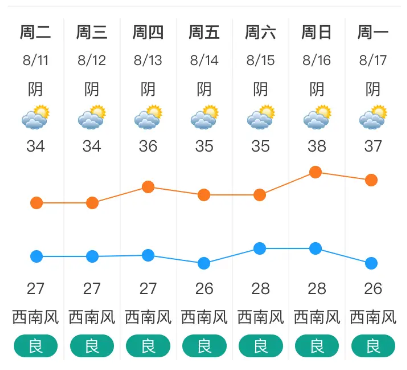
1.使用canvas
可以参考https://ext.dcloud.net.cn/plugin?id=2490
核心代码:
创建canvas的代码
 initWeatherPointLine() {
    var maxArry = this.weatherData.map(item => {
        return item.max;
    });
    var minArry = this.weatherData.map(item => {
        return item.min;
    });
    var max = [];
    var min = [];
    var maxWeather = Math.max(...maxArry);
    var minWeather = Math.min(...minArry);
    var diff = maxWeather - minWeather;
    for (var i = 0; i < maxArry.length; i++) {
        var height = Math.round(((maxArry[i] - minArry[i]) / diff) * 80);

        max[i] = 50 - Math.round((80 / diff) * (maxWeather - maxArry[i]) + 10);
        min[i] = max[i] - height;
    }

    var section7width = Math.round(this.cWidth / 7);
    var cvs = uni.createCanvasContext('weather-canvas',this);
    cvs.setStrokeStyle('#FB7821');
    cvs.setLineWidth(1);
    cvs.beginPath();
    for (var i = 0; i < max.length; i++) {
        var wendu = max[i];
        var x = Math.round(section7width / 2) + Math.round(section7width * i);
        var y = 50 - wendu;
        cvs.arc(x, y, 5, 0, 2 * Math.PI);
        cvs.setFillStyle('#FB7821');
        cvs.fill();
        cvs.moveTo(x, y);
        if (i < max.length - 1) {
            var nextX = x + section7width;
            var nextY = 50 - max[i + 1];
            cvs.lineTo(nextX, nextY);
        }
        cvs.stroke();
        cvs.beginPath();
    }

    cvs.setStrokeStyle('#1B9DFF');
    cvs.setLineWidth(1);
    for (var i = 0; i < min.length; i++) {
        var wendu = min[i];
        var x = Math.round(section7width / 2) + Math.round(section7width * i);
        var y = 50 - wendu;
        cvs.arc(x, y, 5, 0, 2 * Math.PI);
        cvs.setFillStyle('#1B9DFF');
        cvs.fill();
        cvs.moveTo(x, y);
        if (i < min.length - 1) {
            var nextX = x + section7width;
            var nextY = 50 - min[i + 1];
            cvs.lineTo(nextX, nextY);
        }
        cvs.stroke();
        cvs.beginPath();
    }
    cvs.draw();
}
自己可以搭配scroll-view,设置宽度实现左右滑动。
没采用是因为两点之间是直线,化成曲线要使用贝塞尔曲线,有机会可以自己尝试一下
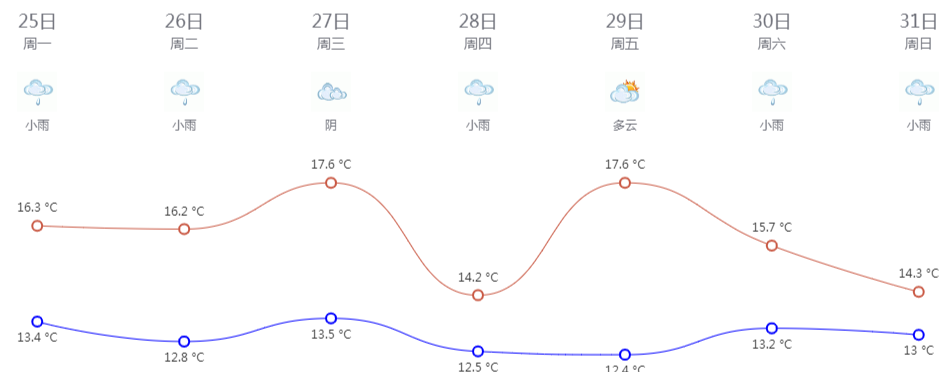
2.考虑使用echart
https://blog.csdn.net/As_Xx_Ls/article/details/128970584,这个是echarts在pc上的展示
核心代码:
echarts的option的代码
 var option = {
    grid: {
        show: true,
        backgroundColor: 'transparent',
        opacity: 0.3,
        borderWidth: '0',
        top: '180',
        bottom: '0'
    },
    tooltip: {
        trigger: 'axis'
    },
    legend: {
        show: false
    },
    xAxis: [
        // 日期
        {
            type: 'category',
            boundaryGap: false,
            position: 'top',
            offset: 130,
            zlevel: 100,
            axisLine: {
                show: false
            },
            axisTick: {
                show: false
            },
            axisLabel: {
                interval: 0,
                formatter: [
                    '{a|{value}}'
                ].join('\n'),
                rich: {
                    a: {
                        // color: 'white',
                        fontSize: 18
                    }
                }
            },
            nameTextStyle: {

            },
            data: ["25日","26日","27日","28日","29日","30日","31日"]
        },
        // 星期
        {
            type: 'category',
            boundaryGap: false,
            position: 'top',
            offset: 110,
            zlevel: 100,
            axisLine: {
                show: false
            },
            axisTick: {
                show: false
            },
            axisLabel: {
                interval: 0,
                formatter: [
                    '{a|{value}}'
                ].join('\n'),
                rich: {
                    a: {
                        // color: 'white',
                        fontSize: 14
                    }
                }
            },
            nameTextStyle: {
                fontWeight: 'bold',
                fontSize: 19
            },
            data: ["周一","周二","周三","周四","周五","周六","周日"]
        },
        // 天气图标
        {
            type: 'category',
            boundaryGap: false,
            position: 'top',
            offset: 20,
            zlevel: 100,
            axisLine: {
                show: false
            },
            axisTick: {
                show: false
            },
            axisLabel: {
                interval: 0,
                formatter: function(value, index) {
                    return '{' + index + '| }\n{b|' + value + '}'
                },
                rich: {
                    0: {
                        backgroundColor: {
                            // image: require('@/assets/weather_icon/' + this.weatherIconDic[this.weatherdata.weather[0]] + '.png')
                            image: 'https://d.scggqx.com/forecast/img/小雨.png'
                        },
                        height: 40,
                        width: 40
                    },
                    1: {
                        backgroundColor: {
                            // image: require('@/assets/weather_icon/' + this.weatherIconDic[this.weatherdata.weather[1]] + '.png')
                            image: 'https://d.scggqx.com/forecast/img/小雨.png'
                        },
                        height: 40,
                        width: 40
                    },
                    2: {
                        backgroundColor: {
                            // image: require('@/assets/weather_icon/' + this.weatherIconDic[this.weatherdata.weather[2]] + '.png')
                            image: 'https://d.scggqx.com/forecast/img/阴.png'
                        },
                        height: 40,
                        width: 40
                    },
                    3: {
                        backgroundColor: {
                            // image: require('@/assets/weather_icon/' + this.weatherIconDic[this.weatherdata.weather[3]] + '.png')
                            image: 'https://d.scggqx.com/forecast/img/小雨.png'
                        },
                        height: 40,
                        width: 40
                    },
                    4: {
                        backgroundColor: {
                            // image: require('@/assets/weather_icon/' + this.weatherIconDic[this.weatherdata.weather[4]] + '.png')
                            image: 'https://d.scggqx.com/forecast/img/多云.png'
                        },
                        height: 40,
                        width: 40
                    },
                    5: {
                        backgroundColor: {
                            // image: require('@/assets/weather_icon/' + this.weatherIconDic[this.weatherdata.weather[5]] + '.png')
                            image: 'https://d.scggqx.com/forecast/img/小雨.png'
                        },
                        height: 40,
                        width: 40
                    },
                    6: {
                        backgroundColor: {
                            // image: require('@/assets/weather_icon/' + this.weatherIconDic[this.weatherdata.weather[6]] + '.png')
                            image: 'https://d.scggqx.com/forecast/img/小雨.png'
                        },
                        height: 40,
                        width: 40
                    },
                    b: {
                        // color: 'white',
                        fontSize: 12,
                        lineHeight: 30,
                        height: 20
                    }
                }
            },
            nameTextStyle: {
                fontWeight: 'bold',
                fontSize: 19
            },
            // data: this.weatherdata.weather
            data: ["小雨","小雨","阴","小雨","多云","小雨","小雨"]
        }
    ],
    yAxis: {
        type: 'value',
        show: false,
        axisLabel: {
            formatter: '{value} °C',
            color: 'white'
        }
    },
    series: [
        {
            name: '最高气温',
            type: 'line',
            data: ["16.3","16.2","17.6","14.2","17.6","15.7","14.3"],
            symbol: 'emptyCircle',
            symbolSize: 10,
            showSymbol: true,
            smooth: true,
            itemStyle: {
                normal: {
                    color: '#C95843'
                }
            },
            label: {
                show: true,
                position: 'top',
                // color: 'white',
                formatter: '{c} °C'
            },
            lineStyle: {
                width: 1,
                // color: 'white'
            },
            areaStyle: {
                opacity: 1,
                color: 'transparent'
            }
        },
        {
            name: '最低气温',
            type: 'line',
            data: ["13.4","12.8","13.5","12.5","12.4","13.2","13"],
            symbol: 'emptyCircle',
            symbolSize: 10,
            showSymbol: true,
            smooth: true,
            itemStyle: {
                normal: {
                    color: 'blue'
                }
            },
            label: {
                show: true,
                position: 'bottom',
                // color: 'white',
                formatter: '{c} °C'
            },
            lineStyle: {
                width: 1,
                // color: 'white'
            },
            areaStyle: {
                opacity: 1,
                color: 'transparent'
            }
        }
    ]
}
在小程序上面,new Image()不能实现,需要自己改源码,再加上echarts压缩后的体积有点大,只是用一个折线图,不划算
3.根据ucharts自己设计
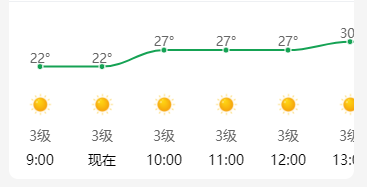
1).分为2部分,上面曲线图使用qiun-data-charts(https://www.ucharts.cn/v2/#/),下面天气,风向和时间是自己写的样式,
2).ucharts的核心代码
<scroll-view scroll-x="true">
	<view class="charts-scroll">
		<view class="charts-box">
            //canvas2d解决小程序层级太高的问题
            //注意:微信小程序Canvas 2D(新接口)需要显式设置画布宽高,默认:300*150,最大:1365*1365。太宽的话ios会显示空白
			<qiun-data-charts type="line" canvasId="weatherCharts" :canvas2d="true" :animation="false" :opts="opts" :chartData="chartData" />
		</view>
		<view class="charts-list">
			<view class="charts-item" v-for="(item, index) in todayHour">
				<image class="charts-item-img" :src="item.weather" mode="aspectFill"></image>
				<view class="charts-item-wind">{{ item.windLev }}</view>
				<view>{{ item.type == 'text' ? item.hour: item.hour + ':00' }}</view>
			</view>
		</view>
	</view>
</scroll-view>

opts: {
	animation: false,
	color: ["#15A254"],
	padding: [15, 0, 5, 0],
	enableScroll: false,
	legend: {
		show: false
	},
	xAxis: {
		disableGrid: true,
		disabled: true,
		axisLine: false
	},
	yAxis: {
		disabled: true,
		disableGrid: true,
		data: [{
            //1.在uni_modules/qiun-data-charts/js_sdk/u-charts/config-ucharts.js
            //2.在"formatter"下面增加"yAxisDemoMix":function(val){return val.toFixed(0)+'°'},
			format: 'yAxisDemoMix'
		}]
	},
	extra: {
		tooltip:{
			showBox: false
		},
		line: {
			type: "curve",
			width: 2,
			activeType: "hollow",
			linearType: "custom",
			onShadow: true,
			animation: "horizontal"
		}
	}
}


let option = {
	categories: [],
	series: [{
		name: "温度",
		data: [],
		format: 'yAxisDemoMix'
	}]
};
//根据自己的逻辑给data赋值
this.chartData = JSON.parse(JSON.stringify(option));

//style
.charts-scroll{
    //因为根据我的需求,我展示的是25个时间,自己根据charts-item的宽度,乘以24算宽度
	width: 2600rpx;
	padding: 20rpx 0;
}
.charts-text{
	padding: 20rpx;
	border-bottom: 1rpx solid #EEF0F3;
}
.charts-list{
	overflow: hidden;
	.charts-item{
		float: left;
		width: 104rpx;
		font-size: 28rpx;
		text-align: center;
		.charts-item-img{
			width: 50rpx;
			height: 50rpx;
		}
		.charts-item-wind{
			margin: 10rpx 0;
			color: #666;
		}
	}
}

 浙公网安备 33010602011771号