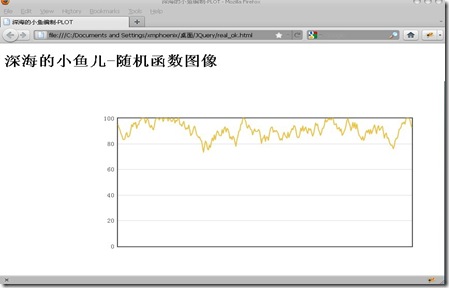
源代码:
<head>
<meta http-equiv="Content-Type" content="text/html; charset=utf-8" />
<title>深海的小鱼编制-PLOT</title>
<script language="javascript" type="text/javascript" src="jquery.js"></script>
<script language="javascript" type="text/javascript" src="jquery.flot.js"></script>
<style type="text/css">
#apDiv1 {
position:absolute;
width:600px;
height:300px;
z-index:1;
left: 200px;
top: 167px;
}
</style>
</head>
<body>
<h1>深海的小鱼儿-随机函数图像</h1>
<div id="apDiv1" align="center"></div>
<script type="text/javascript">
$(function () {
// we use an inline data source in the example, usually data would
// be fetched from a server
var data = [], totalPoints = 300;
function getRandomData() {
if (data.length > 0)
data = data.slice(1);
// do a random walk
while (data.length < totalPoints) {
var prev = data.length > 0 ? data[data.length - 1] : 50;
var y = prev + Math.random() * 10 - 5;
if (y < 0)
y = 0;
if (y > 100)
y = 100;
data.push(y);
}
// zip the generated y values with the x values
var res = [];
for (var i = 0; i < data.length; ++i)
res.push([i, data[i]])
return res;
}
var options = {
series: { shadowSize: 0 }, // drawing is faster without shadows
yaxis: { min: 0, max: 100 },
xaxis: { show: false }
}
var plot = $.plot($("#apDiv1"),[getRandomData()],options);
function update() {
plot.setData([ getRandomData() ]);
// since the axes don't change, we don't need to call plot.setupGrid()
plot.draw();
setTimeout(update, 1);
}
update();
});
</script>
</body>
</html>
图解:


