azure - azure monitor
In September 2018, Microsoft combined Azure Monitor, Log Analytics, and Application Insights into a single service to provide powerful end-to-end monitoring of your applications and the components they rely on.
Azure Monitor is enabled the moment that you create a new Azure subscription, and Activity log and platform metrics are automatically collected.
Access all Azure Monitor features and data from the Monitor menu in the Azure portal.
Azure Data Explorer is a fast and highly scalable data exploration service for log and telemetry data. Azure Monitor Logs is built on top of Azure Data Explorer and uses the same Kusto Query Language (KQL) with some minor differences.
All log data collected by Azure Monitor is stored in a Log Analytics workspace. A workspace is essentially a container where log data is collected from a variety of sources.
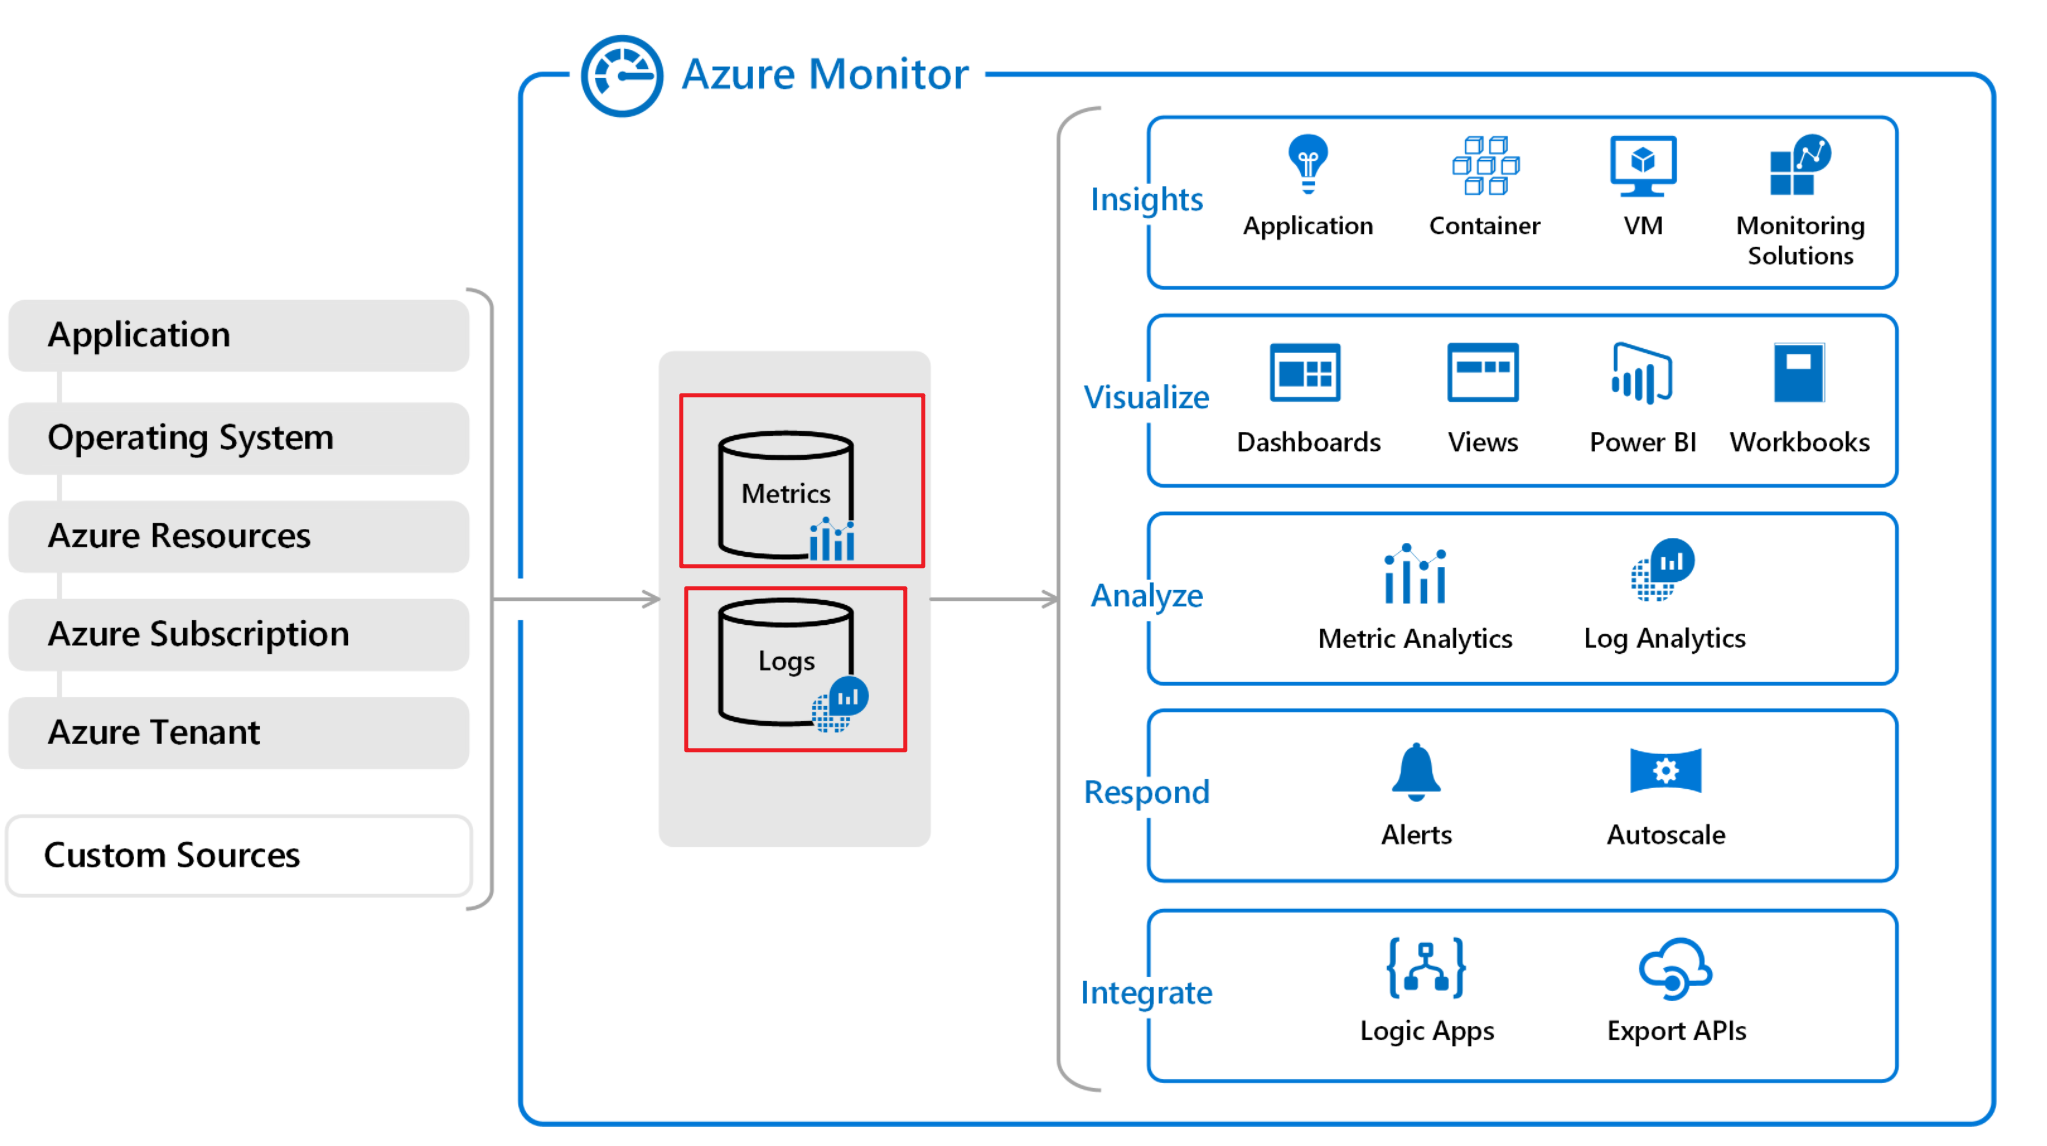
All data collected by Azure Monitor fits into one of two fundamental types, metrics and logs.
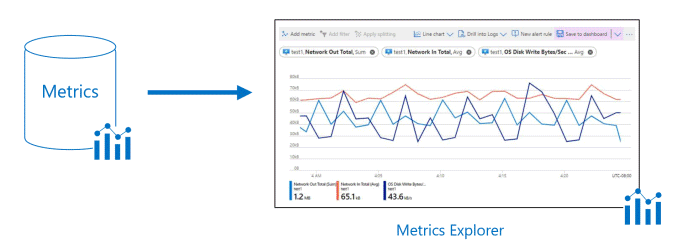
Metrics are numerical values that describe some aspect of a system at a particular point in time. They are lightweight and capable of supporting near real-time scenarios.
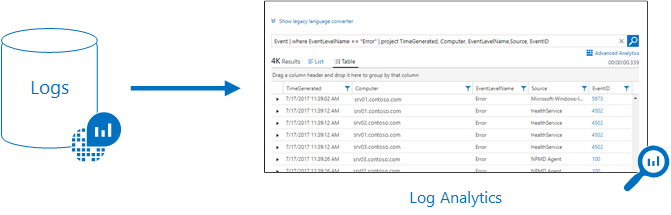
Logs contain different kinds of data organized into records with different sets of properties for each type. Telemetry such as events and traces are stored as logs in addition to performance data so that it can all be combined for analysis.
Insight
Monitoring data is only useful if it can increase your visibility into the operation of your computing environment. Insights provide a customized monitoring experience for particular Azure services. They require minimal configuration and increase your visibility into the operation of critical resources.
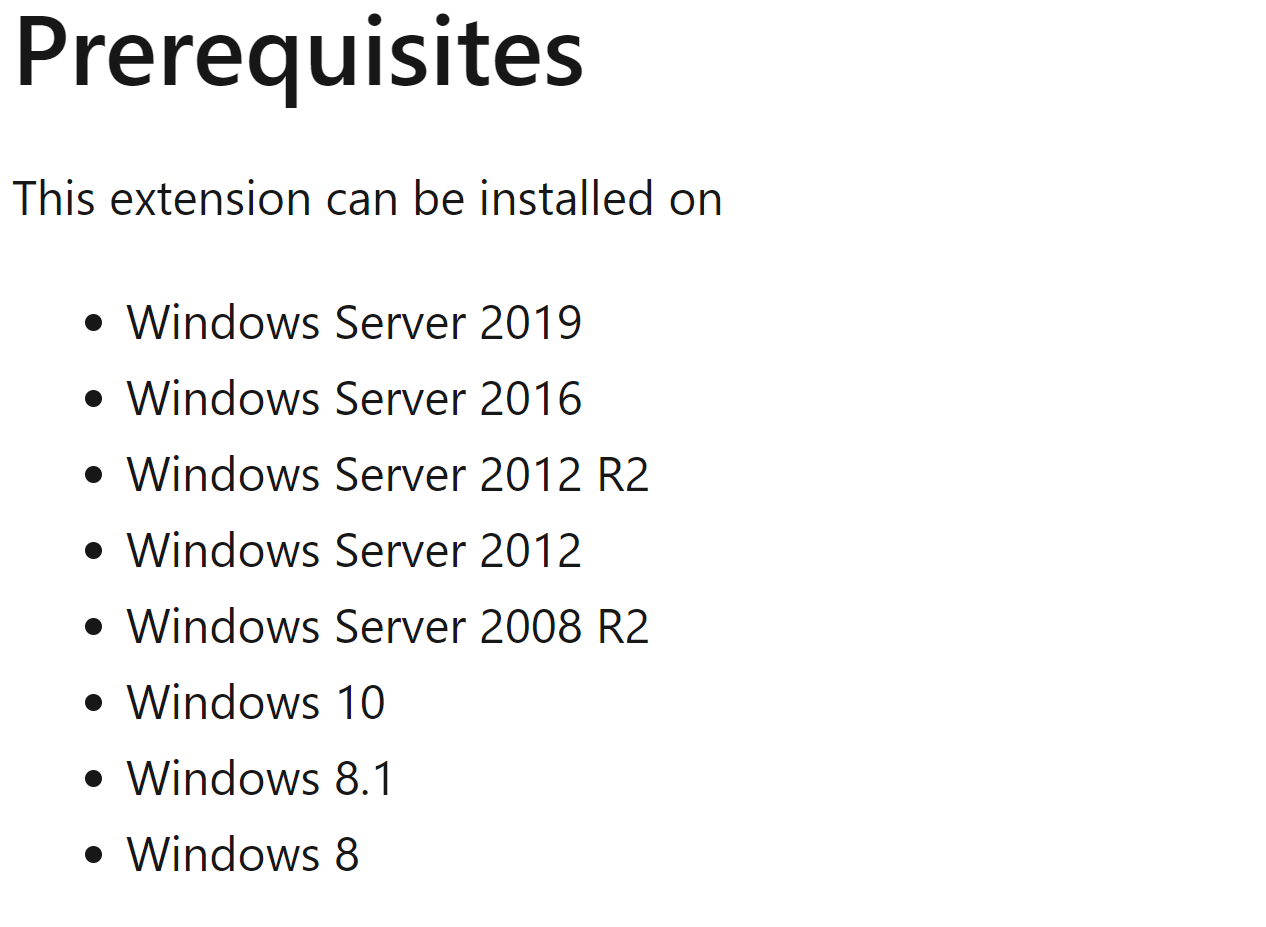
Azure Performance Diagnostics VM Extension helps collect performance diagnostic data from Windows VMs. (只能安装在windows上)
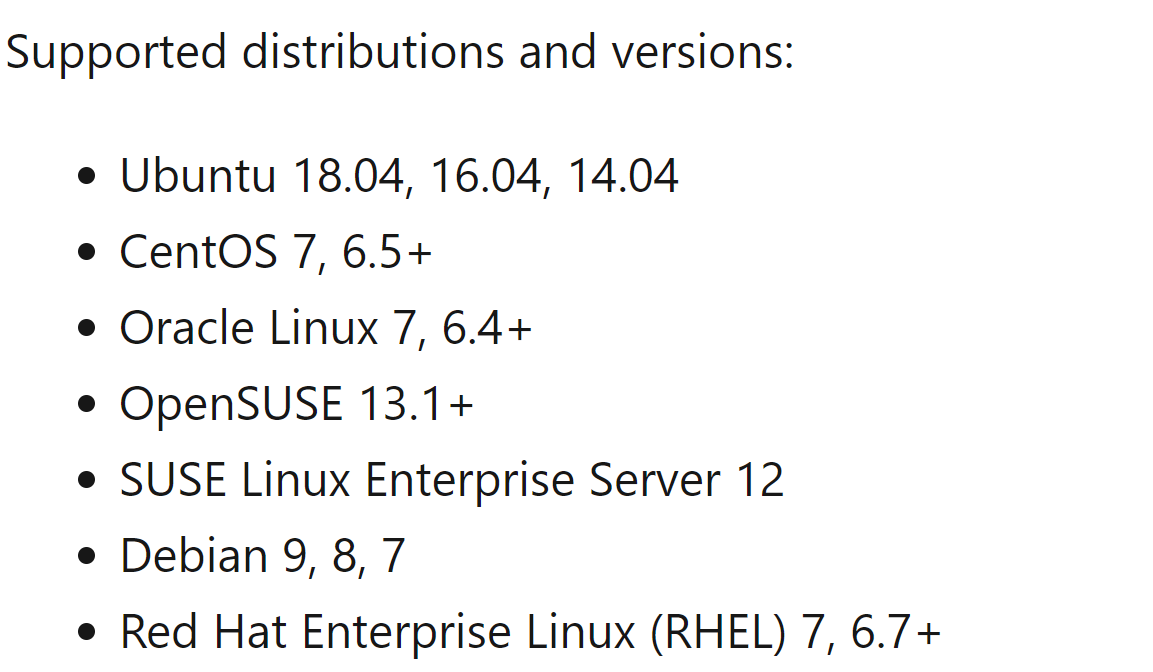
Linux diagnostic extension (LAD)