markown 画图
转自:https://blog.csdn.net/wangyaninglm/article/details/52887045
mermaid简介
当撰写文档的时候,对于流程图的生成大多使用Visio等繁重的工具,没有一种轻便的工具能够画图从而简化文档的编写,就像markdown那样。
mermaid解决这个痛点,这是一个类似markdown语法的脚本语言,通过JavaScript实现图表的生成。
先来看个例子:
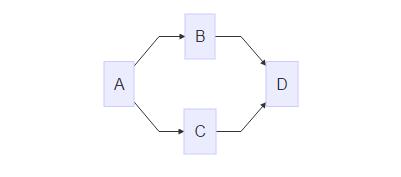
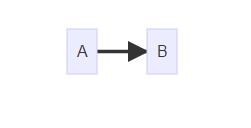
1.流程图(flowchart)
graph LR;
  A-->B;
  A-->C;
  B-->D;
C-->D; - 1
- 2
- 3
- 4
- 5
生成的图表如下所示:
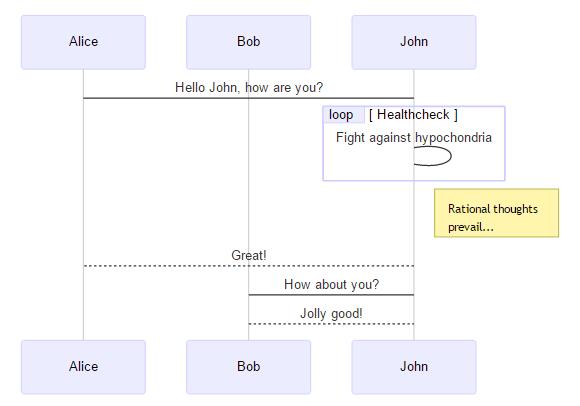
2. 时序图(sequence diagram)
sequenceDiagram
   participant Alice
   participant Bob
   Alice->John:Hello John, how are you?
   loop Healthcheck
     John->John:Fight against hypochondria
   end
   Note right of John:Rational thoughts <br/>prevail...
   John-->Alice:Great!
   John->Bob: How about you?
Bob-->John: Jolly good!- 1
- 2
- 3
- 4
- 5
- 6
- 7
- 8
- 9
- 10
- 11
生成的图表如下所示:
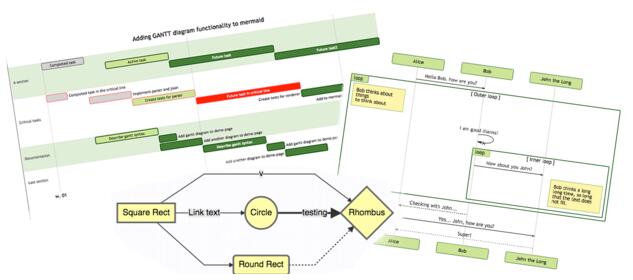
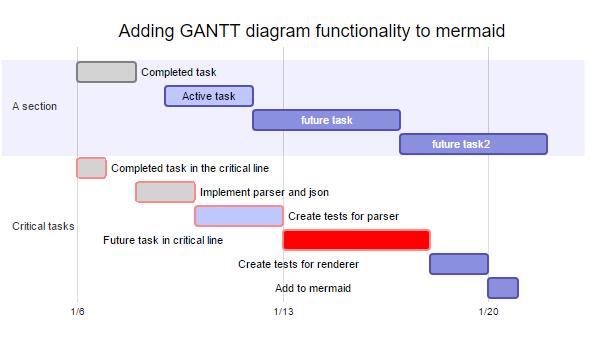
3.甘特图(gantt diagram)
gantt
   dateFormat YYYY-MM-DD
   title Adding GANTT diagram functionality to mermaid
   section A section
   Completed task  :done, des1, 2014-01-06,2014-01-08
   Active task     :active, des2, 2014-01-09, 3d
   future task     :     des3, after des2, 5d
   future task2    :     des4, after des3, 5d
   section Critical tasks
   Completed task in the critical line :crit, done, 2014-01-06,24h
   Implement parser and json      :crit, done, after des1, 2d
   Create tests for parser       :crit, active, 3d
   Future task in critical line     :crit, 5d
   Create tests for renderer      :2d
Add to ,mermaid :1d- 1
- 2
- 3
- 4
- 5
- 6
- 7
- 8
- 9
- 10
- 11
- 12
- 13
- 14
- 15
生成的表如下:
下游项目
Mermaid 是由Knut Sveidqbist发起旨在轻便化的文档撰写。所有开发者:开发者列表
- Gitbook-plugin
- Light table
- Confluence plugin
- Using mermaid via docpad
- Using mermaid in Jekvll
- Using mermaid via Octopress
- Mardown editor Haroopad
- Plugin for atom
- Markdown Plus
- LightPaper 1.2+
- Vim Plugin
以上的这些都有集成mermaid或者开发相关的插件。
Graph
graph LR
A --> B- 1
- 2

这是申明一个由左到右,水平向右的图。\
可能方向有:
- TB - top bottom
- BT - bottom top
- RL - right left
- LR - left right
- TD - same as TB
节点与形状
默认节点
graph LR
id1

注意:’id’显示在节点内部。
文本节点

graph LR
id[This is the text in the box];- 1
- 2
圆角节点

graph LR
id(This is the text in the box);- 1
- 2
圆节点(The form of a circle)
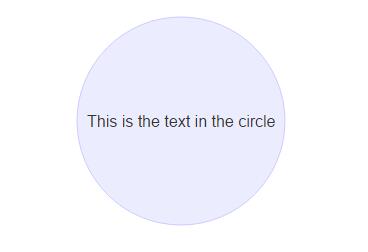
graph LR
id((This is the text in the circle));- 1
- 2
非对称节点(asymetric shape)

graph LR
id>This is the text in the box]- 1
- 2
菱形节点(rhombus)
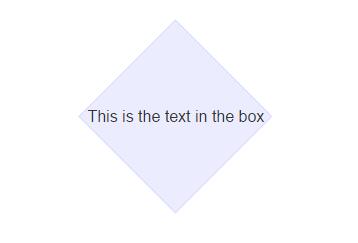
graph LR
id{This is the text in the box}- 1
- 2
连接线
节点间的连接线有多种形状,而且可以在连接线中加入标签:
箭头形连接
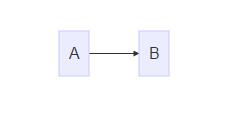
graph LR;
A-->B;- 1
- 2
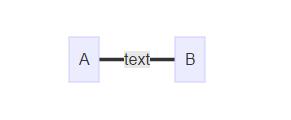
开放行连接
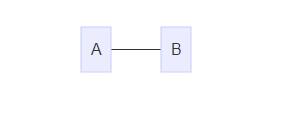
graph LR
A --- B- 1
- 2
标签连接
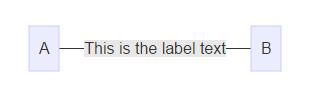
graph LR
A -- This is the label text --- B;- 1
- 2
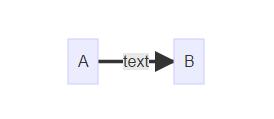
箭头标签连接
A–>|text|B\
或者\
A– text –>B
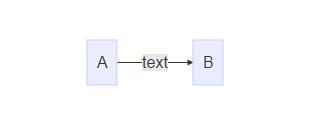
graph LR
A-- text -->B- 1
- 2
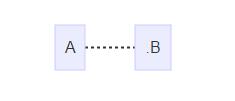
虚线(dotted link,点连线)
-.->

graph LR
A-.->B- 1
- 2
-.-.
graph LR
A-.-.B- 1
- 2
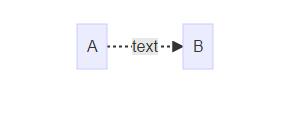
标签虚线
-.text.->
graph LR
A-.text.->B- 1
- 2
粗实线
==>
graph LR
A==>B- 1
- 2
===
graph LR
A===B- 1
- 2

标签粗线
=\=text\==>
graph LR
A==text==>B- 1
- 2
=\=text\===
graph LR
A==text===B- 1
- 2
特殊的语法
使用引号可以抑制一些特殊的字符的使用,可以避免一些不必要的麻烦。
graph LR\
d1[“This is the (text) in the box”]
graph LR
d1["This is the (text) in the box"]- 1
- 2

html字符的转义字符
转义字符的使用语法:
流程图定义如下:
graph LR\
A[“A double quote:#quot;”] –> B[“A dec char:#9829;”]
渲染后的图如下:

graph LR
A["A double quote:#quot;"]-->B["A dec char:#9829;"]- 1
- 2
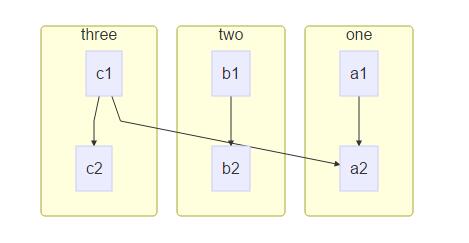
子图(Subgraphs)
subgraph title\
graph definition\
end
示例:
graph TB
        subgraph one
        a1 --> a2
        en
        subgraph two
        b2 --> b2
        end
        subgraph three
        c1 --> c2
        end
c1 --> a2- 1
- 2
- 3
- 4
- 5
- 6
- 7
- 8
- 9
- 10
- 11
结果:
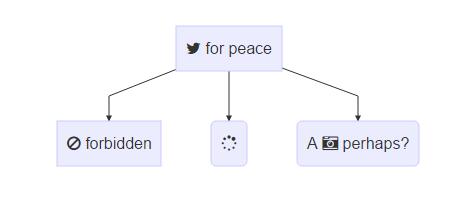
基础fontawesome支持
如果想加入来自frontawesome的图表字体,需要像frontawesome网站上那样引用的那样。\
详情请点击:fontawdsome
引用的语法为:++fa:#icon class name#++
graph TD
      B["fa:fa-twitter for peace"]
      B-->C[fa:fa-ban forbidden]
      B-->D(fa:fa-spinner);
B-->E(A fa:fa-camerra-retro perhaps?);- 1
- 2
- 3
- 4
- 5
渲染图如下:
graph TD
      B["fa:fa-twitter for peace"]
      B-->C[fa:fa-ban forbidden]
      B-->D(fa:fa-spinner);
B-->E(A fa:fa-camera-retro perhaps?);- 1
- 2
- 3
- 4
- 5
以上reference:
1.mermaid docs
第二部分—图表(graph)
定义连接线的样式
graph LR
     id1(Start)-->id2(Stop)
     style id1 fill:#f9f,stroke:#333,stroke-width:4px;
style id2 fill:#ccf,stroke:#f66,stroke-width:2px,stroke-dasharray:5,5;- 1
- 2
- 3
- 4
渲染结果:

graph LR
     id1(Start)-->id2(Stop)
     style id1 fill:#f9f,stroke:#333,stroke-width:4px;
style id2 fill:#ccf,stroke:#f66,stroke-width:2px,stroke-dasharray:5,5;- 1
- 2
- 3
- 4
备注:这些样式参考CSS样式。
样式类
为了方便样式的使用,可以定义类来使用样式
类的定义示例:
classDef className fill:#f9f,stroke:#333,stroke-width:4px;- 1
对节点使用样式类:
class nodeId className;- 1
同时对多个节点使用相同的样式类:
class nodeId1,nodeId2 className;- 1
可以在CSS中提前定义样式类,应用在图表的定义中。
graph LR
      A-->B[AAABBB];
      B-->D;
class A cssClass;- 1
- 2
- 3
- 4
默认样式类:\
当没有指定样式的时候,默认采用。
classDef default fill:#f9f,stroke:#333,stroke-width:4px;- 1
示例:
graph LR
    classDef default fill:#f90,stroke:#555,stroke-width:4px;
id1(Start)-->id2(Stop)- 1
- 2
- 3
结果:
graph LR
classDef default fill:#f90,stroke:#555,stroke-width:4px;
id1(Start)-->id2(Stop)- 1
- 2
- 3

序列图(sequence diagram)1
示例:
sequenceDiagram
  Alice->>John: Hello John, how are you ?
  John-->>Alice: Great!
  Alice--->>John: Huang,you are better .
John-->>Alice: yeah, Just not bad.- 1
- 2
- 3
- 4
- 5
sequenceDiagram
  Alice->>John: Hello John, how are you ?
  John-->>Alice: Great!
  Alice->>John: Hung,you are better .
John-->>Alice: yeah, Just not bad.- 1
- 2
- 3
- 4
- 5
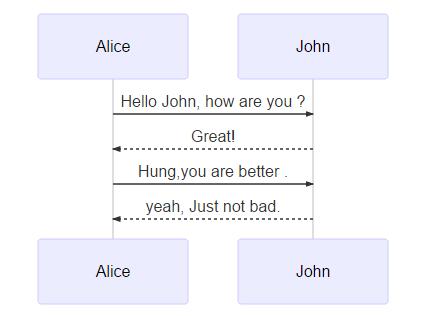
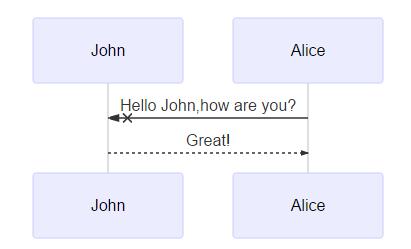
观察上面的图,如果想让John出现在前面,如何控制,mermaid通过设定参与者(participants)的顺序控制二者的顺序。上面的图可以做如下修改:
sequenceDiagram\
participant John\
participant Alice\
Alice->>John:Hello John,how are you?\
John–>>Alice:Great!
sequenceDiagram
  participant John
  participant Alice
  Alice-xJohn:Hello John,how are you?
John-->>Alice:Great!- 1
- 2
- 3
- 4
- 5
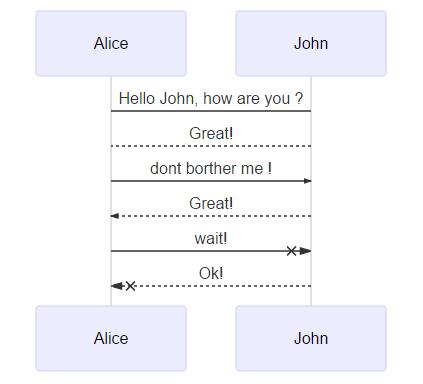
消息的语法:
实线或者虚线的使用:
[Actor][Arrow][Actor]:Message text\
Arrow的六种样式:
- ->
- –>
- ->>
- –>>
- -x
- –x
示例:
sequenceDiagram
    Alice->John: Hello John, how are you ?
    John-->Alice:Great!
    Alice->>John: dont borther me !
    John-->>Alice:Great!
    Alice-xJohn: wait!
John--xAlice: Ok!- 1
- 2
- 3
- 4
- 5
- 6
- 7
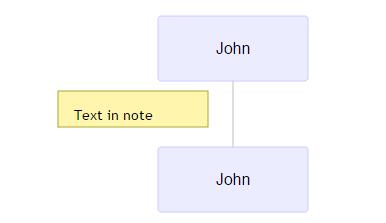
便签
给序列图增加便签:\
具体规则:\
[right of | left of | over][Actor]:Text\
示例:
sequenceDiagram
  participant John
Note left of John: Text in note- 1
- 2
- 3
结果:
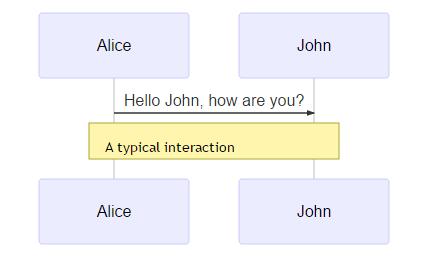
跨越两个Actor的便签:
sequenceDiagram
  Alice->John:Hello John, how are you?
Note over Alice,John:A typical interaction- 1
- 2
- 3
sequenceDiagram
Alice->>John:Hello John, how are you?
Note over Alice,John:A typical interaction- 1
- 2
- 3
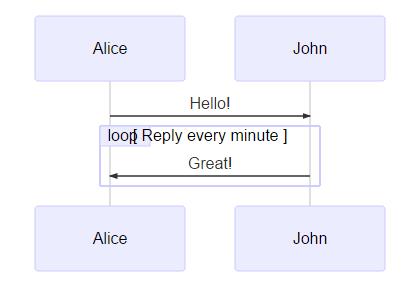
循环Loops
在序列图中,也可以使用循环,具体规则如下:
loop Loop text
... statements...
end- 1
- 2
- 3
示例:
sequenceDiagram
  Alice->>John: Hello!
  loop Reply every minute
    John->>Alice:Great!
end- 1
- 2
- 3
- 4
- 5
渲染结果:
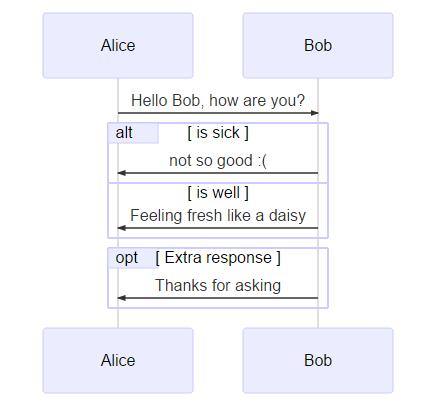
选择ALT
在序列图中选择的表达。规则如下:
alt Describing text
...statements...
else
...statements...
end- 1
- 2
- 3
- 4
- 5
或者使用opt(推荐在没有else的情况下使用)
opt Describing text
...statements...
end- 1
- 2
- 3
示例:
sequenceDiagram
  Alice->>Bob: Hello Bob, how are you?
  alt is sick
    Bob->>Alice:not so good :(
  else is well
    Bob->>Alice:Feeling fresh like a daisy:)
  end
  opt Extra response
    Bob->>Alice:Thanks for asking
end- 1
- 2
- 3
- 4
- 5
- 6
- 7
- 8
- 9
- 10
渲染结果如下:
甘特图(gantt)2
甘特图是一类条形图,由Karol Adamiechi在1896年提出, 而在1910年Henry Gantt也独立的提出了此种图形表示。通常用在对项目终端元素和总结元素的开始及完成时间进行的描述。
示例:
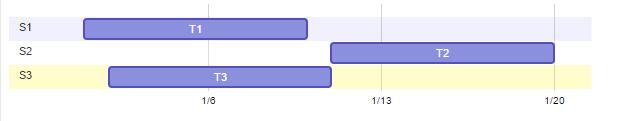
gantt
dateFormat YYYY-MM-DD
section S1

T1: 2014-01-01, 9d
section S2

T2: 2014-01-11, 9d
section S3

T3: 2014-01-02, 9d
- 1
- 2
- 3
- 4
- 5
- 6
- 7
- 8
- 9
- 10
- 11
gantt
dateFormat YYYY-MM-DD
section S1
T1: 2014-01-01, 9d
section S2
T2: 2014-01-11, 9d
section S3
T3: 2014-01-02, 9d- 1
- 2
- 3
- 4
- 5
- 6
- 7
- 8
先来看一个大的例子:
gantt
dateFormat YYYY-MM-DD
title Adding GANTT diagram functionality to mermaid
section A section
Completed task :done, des1, 2014-01-06,2014-01-08
Active task :active, des2, 2014-01-09, 3d
Future task : des3, after des2, 5d
Future task2 : des4, after des3, 5d
section Critical tasks
Completed task in the critical line :crit, done, 2014-01-06,24h
Implement parser and jison :crit, done, after des1, 2d
<span class="hljs-operator"><span class="hljs-keyword">Create</span> tests <span class="hljs-keyword">for</span> parser :crit, active, <span class="hljs-number">3</span>d
Future task <span class="hljs-keyword">in</span> critical line :crit, <span class="hljs-number">5</span>d
<span class="hljs-keyword">Create</span> tests <span class="hljs-keyword">for</span> renderer :<span class="hljs-number">2</span>d
<span class="hljs-keyword">Add</span> <span class="hljs-keyword">to</span> mermaid :<span class="hljs-number">1</span>d
<span class="hljs-keyword">section</span> Documentation
<span class="hljs-keyword">Describe</span> gantt syntax :active, a1, <span class="hljs-keyword">after</span> des1, <span class="hljs-number">3</span>d
<span class="hljs-keyword">Add</span> gantt diagram <span class="hljs-keyword">to</span> demo page :<span class="hljs-keyword">after</span> a1 , <span class="hljs-number">20</span>h
<span class="hljs-keyword">Add</span> another diagram <span class="hljs-keyword">to</span> demo page :doc1, <span class="hljs-keyword">after</span> a1 , <span class="hljs-number">48</span>h
<span class="hljs-keyword">section</span> <span class="hljs-keyword">Last</span> <span class="hljs-keyword">section</span>
<span class="hljs-keyword">Describe</span> gantt syntax :<span class="hljs-keyword">after</span> doc1, <span class="hljs-number">3</span>d
<span class="hljs-keyword">Add</span> gantt diagram <span class="hljs-keyword">to</span> demo page : <span class="hljs-number">20</span>h
<span class="hljs-keyword">Add</span> another diagram <span class="hljs-keyword">to</span> demo page : <span class="hljs-number">48</span>h</span><div class="hljs-button {2}" data-title="复制" data-report-click="{"spm":"1001.2101.3001.4259"}"></div></code><ul class="pre-numbering" style=""><li style="color: rgb(153, 153, 153);">1</li><li style="color: rgb(153, 153, 153);">2</li><li style="color: rgb(153, 153, 153);">3</li><li style="color: rgb(153, 153, 153);">4</li><li style="color: rgb(153, 153, 153);">5</li><li style="color: rgb(153, 153, 153);">6</li><li style="color: rgb(153, 153, 153);">7</li><li style="color: rgb(153, 153, 153);">8</li><li style="color: rgb(153, 153, 153);">9</li><li style="color: rgb(153, 153, 153);">10</li><li style="color: rgb(153, 153, 153);">11</li><li style="color: rgb(153, 153, 153);">12</li><li style="color: rgb(153, 153, 153);">13</li><li style="color: rgb(153, 153, 153);">14</li><li style="color: rgb(153, 153, 153);">15</li><li style="color: rgb(153, 153, 153);">16</li><li style="color: rgb(153, 153, 153);">17</li><li style="color: rgb(153, 153, 153);">18</li><li style="color: rgb(153, 153, 153);">19</li><li style="color: rgb(153, 153, 153);">20</li><li style="color: rgb(153, 153, 153);">21</li><li style="color: rgb(153, 153, 153);">22</li><li style="color: rgb(153, 153, 153);">23</li><li style="color: rgb(153, 153, 153);">24</li><li style="color: rgb(153, 153, 153);">25</li><li style="color: rgb(153, 153, 153);">26</li><li style="color: rgb(153, 153, 153);">27</li></ul></pre>
获得的图渲染后如下:
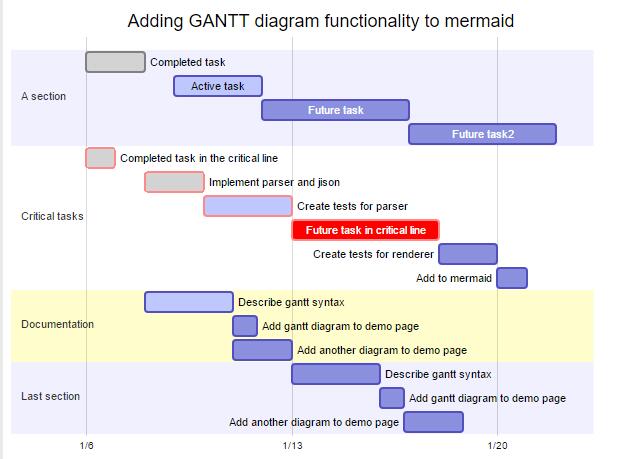
header 1 header 2 title 标题 dateFormat 日期格式 section 模块 Completed 已经完成 Active 当前正在进行 Future 后续待处理 crit 关键阶段 日期缺失 默认从上一项完成后
关于日期的格式可以参考:
- string-format
- Time-Formatting
Demo
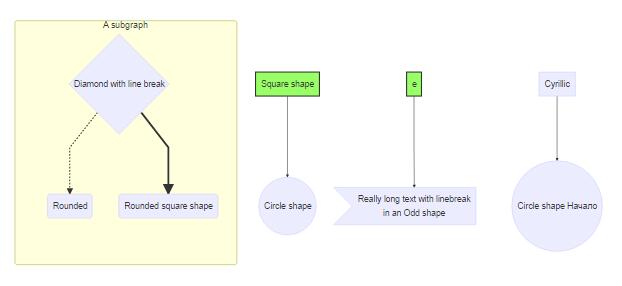
graph TB
sq[Square shape] --> ci((Circle shape))
subgraph A subgraph
di{Diamond <span class="hljs-reserved">with</span> line <span class="hljs-keyword">break</span>} -.<span class="hljs-function">-></span> ro(Rounded)
<span class="hljs-function"><span class="hljs-title">di</span>==></span>ro2(Rounded square shape)
end
e -<span class="hljs-function">-></span> od3>Really long text <span class="hljs-reserved">with</span> linebreak<br><span class="hljs-keyword">in</span> an Odd shape]
cyr[Cyrillic]-<span class="hljs-function">-></span>cyr2((Circle shape Начало));
classDef green <span class="hljs-attribute">fill</span>:<span class="hljs-comment">#9f6,stroke:#333,stroke-width:2px;</span>
classDef orange <span class="hljs-attribute">fill</span>:<span class="hljs-comment">#f96,stroke:#333,stroke-width:4px;</span>
<span class="hljs-class"><span class="hljs-keyword">class</span> <span class="hljs-title">sq</span>,<span class="hljs-title">e</span> <span class="hljs-title">green</span></span>
<span class="hljs-class"><span class="hljs-keyword">class</span> <span class="hljs-title">di</span> <span class="hljs-title">orange</span></span><div class="hljs-button {2}" data-title="复制" data-report-click="{"spm":"1001.2101.3001.4259"}"></div></code><ul class="pre-numbering" style=""><li style="color: rgb(153, 153, 153);">1</li><li style="color: rgb(153, 153, 153);">2</li><li style="color: rgb(153, 153, 153);">3</li><li style="color: rgb(153, 153, 153);">4</li><li style="color: rgb(153, 153, 153);">5</li><li style="color: rgb(153, 153, 153);">6</li><li style="color: rgb(153, 153, 153);">7</li><li style="color: rgb(153, 153, 153);">8</li><li style="color: rgb(153, 153, 153);">9</li><li style="color: rgb(153, 153, 153);">10</li><li style="color: rgb(153, 153, 153);">11</li><li style="color: rgb(153, 153, 153);">12</li><li style="color: rgb(153, 153, 153);">13</li><li style="color: rgb(153, 153, 153);">14</li><li style="color: rgb(153, 153, 153);">15</li><li style="color: rgb(153, 153, 153);">16</li></ul></pre>
reference
本文原创首发于公众号:老王和他的IT界朋友们
微信扫描关注微信号:(原创投稿有惊喜!!!)