Echarts 图表使用要点
本篇文章数据来源为各大电商网站公开数据(如有侵权,联系删除),使用到的截图为 Echarts Demo 示例。
本篇文章介绍 Apache ECharts 可视化图表库,包括雷达图 radar,柱状图 bar,散点图 scatter,旭日图 sunburst,词云图 wordcloud,折线图 line,饼图 pie 的使用要点,全是摘自实际项目中使用到的示例。
1. 雷达图 radar
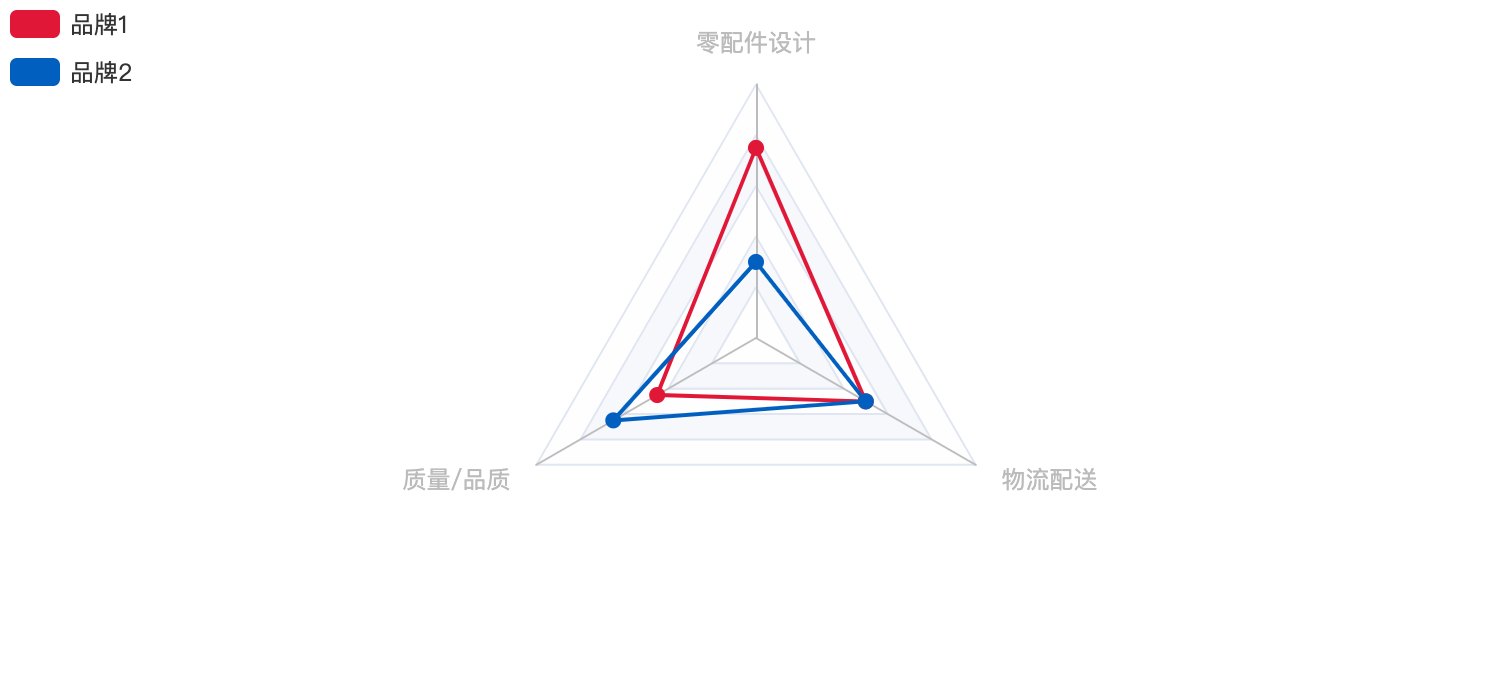
雷达图使用 radar 组件作为其坐标系,雷达图主要用于表现多变量的数据。
雷达图是表现多个维度的数据,所以,如果只有一条数据,则展示为一个点,两条数据展示为一条线,三个及以上数据才展示为多个维度的雷达图。
// 完整示例代码
option = {
    "legend": {
        "left": "left",
        "orient": "vertical"
    },
    "tooltip": {
        "trigger": "item"
    },
    "radar": {
        "indicator": [
            {
                "name": "零配件设计",
                "max": 20
            },
            {
                "name": "质量/品质",
                "max": 20
            },
            {
                "name": "物流配送",
                "max": 20
            }
        ]
    },
    "grid": {
        "top": 16,
        "left": 20,
        "right": 20,
        "bottom": 16,
        "containLabel": true
    },
    "series": [
        {
            "type": "radar",
            "data": [
                {
                    "value": [
                        15,
                        9,
                        10
                    ],
                    "name": "品牌1",
                    "colorBy": "data",
                    "itemStyle": {
                        "color": "#E01737"
                    }
                },
                {
                    "value": [
                        6,
                        13,
                        10
                    ],
                    "name": "品牌2",
                    "colorBy": "data",
                    "itemStyle": {
                        "color": "#005FBF"
                    }
                }
            ]
        }
    ]
};
1.1. 一个维度(一条数据)
只有一条数据时,只出现一个点,以及雷达图状背景。
option = {
    "legend": {
        "left": "left",
        "orient": "vertical"
    },
    "tooltip": {
        "trigger": "item"
    },
    "radar": {
        "indicator": [
            {
                "name": "零配件设计",
                "max": 20
            },
        ]
    },
    "grid": {
        "top": 16,
        "left": 20,
        "right": 20,
        "bottom": 16,
        "containLabel": true
    },
    "series": [
        {
            "type": "radar",
            "data": [
                {
                    "value": [
                        15,
                    ],
                    "name": "品牌1",
                    "colorBy": "data",
                    "itemStyle": {
                        "color": "#E01737"
                    }
                }
            ]
        }
    ]
};

1.2. 二个维度(二条数据)
只有二条数据时,只出现一条线,以及雷达图状背景。
option = {
  legend: {
    left: 'left',
    orient: 'vertical'
  },
  tooltip: {
    trigger: 'item'
  },
  radar: {
    indicator: [
      {
        name: '零配件设计',
        max: 20
      },
      {
        name: '质量/品质',
        max: 20
      }
    ]
  },
  grid: {
    top: 16,
    left: 20,
    right: 20,
    bottom: 16,
    containLabel: true
  },
  series: [
    {
      type: 'radar',
      data: [
        {
          value: [15, 9],
          name: '品牌1',
          colorBy: 'data',
          itemStyle: {
            color: '#E01737'
          }
        }
      ]
    }
  ]
};

1.3. 雷达图的指示器必填
雷达图的指示器 indicator,用来指定雷达图中的多个变量(维度),必填。如果不填将会报错。
如上完整示例代码设置 indicator 为空数组:
 radar: {
    indicator: []
 }

不设置表示没有维度,没有意义。所以当没有数据时,需要兼容处理,让代码健壮一些:
 radar: {
    indicator: [{name: ''}]
 }
1.4. 指示器建议设置的最大值
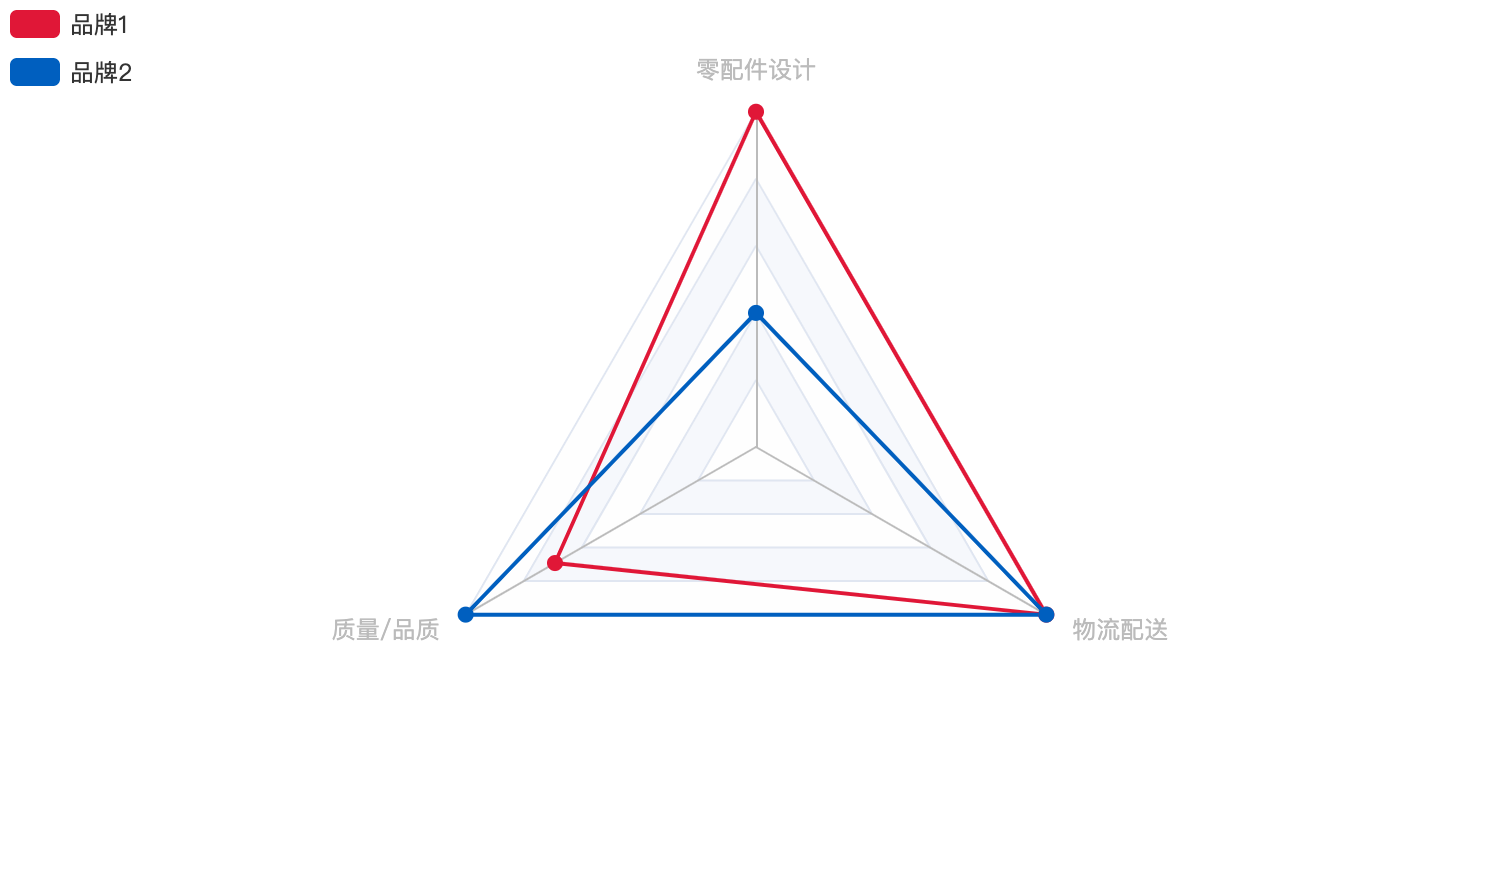
设置指示器的最大值后,其他数值和这个最大值的比值,为图中占比。如果不设置,不容易看出哪个 legend 是最大值。建议设置为同类型中最大那个数值。
如上完整示例代码设置 indicator 为空数组:
radar: {
    indicator: [
      {
        name: '零配件设计',
        max: 15
      },
      {
        name: '质量/品质',
        max: 13
      },
      {
        name: '物流配送',
        max: 10
      }
    ]
  },
series: [
    {
      type: 'radar',
      data: [
        {
          value: [15, 9, 10],
          name: '品牌1',
          colorBy: 'data',
          itemStyle: {
            color: '#E01737'
          }
        },
        {
          value: [6, 13, 10],
          name: '品牌2',
          colorBy: 'data',
          itemStyle: {
            color: '#005FBF'
          }
        }
      ]
    }
  ],
...
2. 柱状图 bar
柱状图(或称条形图)是一种通过柱形的高度(横向的情况下则是宽度)来表现数据大小的一种常用图表类型。
很简单的柱状图,我们其实可以通过自己实现来表现数据趋势,以横向的情况为例:
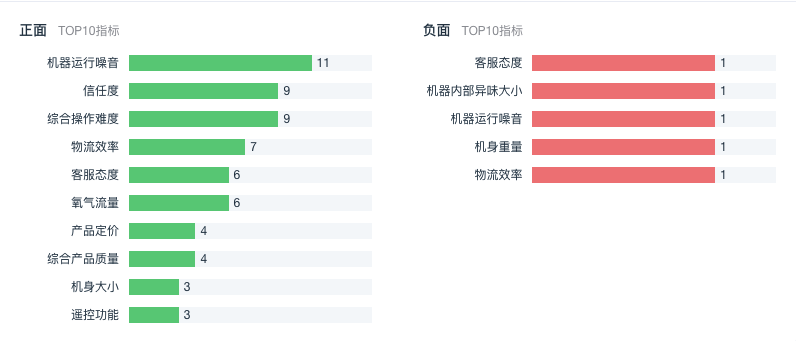
实现原理:
- 为每一条数据定义两种颜色,一种背景色,用来表示总量,一种前景色,用来表示占比。
- 柱状图用高低起伏的条形,来表示不同数据之间的差异,需要体现值大的数据更高(宽),值小的数据更低(窄)。
<div class="card-content">
	<dl class="positive">
		<dt><span class="emotion">正面</span> TOP10指标 </dt>
		<dd class="top10">
			<div title="机器运行噪音" class="top10-name">机器运行噪音</div>
			<div class="top10-box">
				<div style="width: 75%; background: rgb(108, 204, 122);"></div>
				<div class="top10-value">11</div>
			</div>
		</dd>
		<dd class="top10">
			<div title="信任度" class="top10-name">信任度</div>
			<div class="top10-box">
				<div style="width: 61.3636%; background: rgb(108, 204, 122);"></div>
				<div class="top10-value">9</div>
			</div>
		</dd>
	</dl>
	<dl class="negative">
		<dt><span class="emotion">负面</span> TOP10指标 </dt>
		<dd class="top10">
			<div title="客服态度" class="top10-name">客服态度</div>
			<div class="top10-box">
				<div style="width: 75%; background: rgb(234, 123, 123);"></div>
				<div class="top10-value">1</div>
			</div>
		</dd>
		<dd class="top10">
			<div title="机器内部异味大小" class="top10-name">机器内部异味大小</div>
			<div class="top10-box">
				<div style="width: 75%; background: rgb(234, 123, 123);"></div>
				<div class="top10-value">1</div>
			</div>
		</dd>
	</dl>
</div>
dl,
dt,
dd {
  margin: 0;
}

.card-content {
  display: flex;
  flex-direction: row;
  align-items: flex-start;

  & > dl {
    width: calc(50% - 25px);
    &:last-of-type {
      margin-left: 50px;
    }
    dt {
      margin: 0 0 16px;
      font-size: 12px;
      line-height: 1.5em;
      font-weight: 400;
      color: #919399;
      .emotion {
        font-size: 14px;
        font-weight: 500;
        color: #273849;
        margin-right: 8px;
      }
    }
    .top10 {
      height: 16px;
      line-height: 16px;
      display: flex;
      margin-bottom: 12px;
      &:hover {
        cursor: pointer;
        .top10-name {
          color: #000;
          font-weight: 600;
        }
        .top10-box {
          background-color: #b1b3b7;
        }
      }
      .top10-name {
        width: 100px;
        margin-right: 10px;
        font-size: 12px;
        font-weight: 400;
        color: #273849;
        text-align: end;
        white-space: nowrap;
        text-overflow: ellipsis;
        overflow: hidden;
        word-break: break-all;
        transition: all 0.4s ease 0s;
      }
      .top10-box {
        flex: 1;
        background-color: #f5f7fa;
        display: flex;
        transition: all 0.4s ease 0s;
        .top10-value {
          font-size: 12px;
          font-weight: 400;
          color: #273849;
          margin-left: 5px;
        }
      }
    }
  }
}
说明:
以上 width 宽度属性值计算规则为 width: (item.value / (positiveItems[0].value / 0.75)) * 100 + '%' 。
- 先将动态返回的数据按照数值大小降序排序。
- 取第一条数据的值(最大的值)除以 0.75 作为背景颜色的宽度。这时候最大的数值只占了 75% 的宽,留下 25% 用来显示具体的数值。
- 用当前数据的值除以背景颜色的宽度,得到的比值就是自身的宽度。
3. 散点图 scatter
散点(气泡)图,是一组分散在坐标轴区域内的点,用来展现数据的 x,y 之间的关系。

3.1. 设置组件合并模式
这不仅仅是散点图需要设置,其他图如果没有按照预期正确渲染,都可以设置合并模式 setOption notMerge。将其设置为 true,表示所有组件都会被删除,然后根据新 option 创建所有新组件。不设置时为 false。
如下图,重复计算了散点,没有把之前的清空。
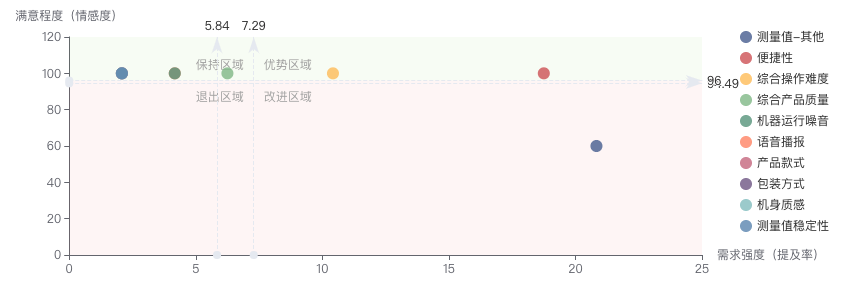
将 notMerge 设置为 true 就会恢复正常。
3.2. 散点图画线
散点图是分散在坐标系中的点状图,通常需要画出横坐标和纵坐标来表示点的平均值,体现点和平均值的比较关系。
图表标线 可以在坐标区域中画线。只需要找到横坐标线和纵坐标线的位置即可。以点的横坐标、纵坐标的平均值为例作为画线的位置为例:
const xAverage = Number((xCount / seriesDataLen).toFixed(2));  // xCount 为 x 坐标的值的总和,seriesDataLen 为 top10 坐标个数(最多10个,不足 10 个有多少算多少)
const yAverage = Number((yCount / seriesDataLen).toFixed(2));  // yCount 为 y 坐标的值的总和
const top10Data = satisfaction.filter((item, index) => index < 10);   // top10 数据
const xMax = Math.max(...top10Data.map((item) => Number(item.x_axis)));  // 取 top10 数据 x 轴最大值
const yMax = Math.max(...top10Data.map((item) => Number(item.y_axis)));  // 取 top10 数据 y 轴最大值
const markLineData = {
  data: [
    {
      yAxis: yAverage,
      lineStyle: {
        color: 'rgba(233, 236, 242, 1)'
      }
    },
    {
      xAxis: xAverage,
      lineStyle: {
        color: 'rgba(233, 236, 242, 1)'
      }
    }
  ]
};
...
if (this.satisfactionOption.series.length > 0) {
    this.satisfactionOption.series[0].markLine = markLineData;
}
3.2. 散点图画区域
图表标域。区域按象限区分,分为第一象限、第二象限、第三象限、第四象限,分别对应的位置是右上角区域、左上角区域、左下角区域、右下角区域。
// 第一象限区域
const markAreaData1 = {
  silent: true,
  itemStyle: {
    color: 'rgba(111, 191, 26, 0.05)',
    borderWidth: 0,
    borderType: 'solid'
  },
  label: {
    show: true,
    position: 'insideBottomLeft',
    formatter: '优势区域',  // 第一象限区域标识的 label 文本
    color: '#aaa',
    distance: 10  // 距离中心点 10 (根号10)距离
  },
  data: [
    // 该区域只需要知道左下角、右上角的点便可连成区域
    [
      {
        xAxis: xAverage,
        yAxis: yAverage
      },
      {
        xAxis: Math.ceil(xMax * 2) + 20,  // 在 xMax 的基础上在 * 2 , +20 是因为有些点刚好是最大值,区域画得更远,能保证全部点都在坐标轴内
        yAxis: Math.ceil(yMax * 2) + 20
      }
    ]
  ]
};
// 第二象限区域
const markAreaData2 = {
  silent: true,
  itemStyle: {
    color: 'rgba(111, 191, 26, 0.05)',
    borderWidth: 0,
    borderType: 'solid'
  },
  label: {
    show: true,
    position: 'insideBottomRight',
    formatter: '保持区域', // 第二象限区域标识的 label 文本
    color: '#aaa',
    distance: 10
  },
  data: [
    [
      {
        xAxis: 0,
        yAxis: yAverage
      },
      {
        xAxis: xAverage,
        yAxis: Math.ceil(yMax * 2) + 20
      }
    ]
  ]
};
// 第三象限区域
const markAreaData3 = {
  silent: true,
  itemStyle: {
    color: 'rgba(238, 81, 68, 0.05)',
    borderWidth: 0,
    borderType: 'solid'
  },
  label: {
    show: true,
    position: 'insideTopRight',
    formatter: '退出区域', // 第三象限区域标识的 label 文本
    color: '#aaa',
    distance: 10
  },
  data: [
    [
      {
        xAxis: 0,
        yAxis: 0
      },
      {
        xAxis: xAverage,
        yAxis: yAverage
      }
    ]
  ]
};
// 第四象限区域
const markAreaData4 = {
  silent: true,
  itemStyle: {
    color: 'rgba(238, 81, 68, 0.05)',
    borderWidth: 0,
    borderType: 'solid'
  },
  label: {
    show: true,
    position: 'insideTopLeft',
    formatter: '改进区域', // 第四象限区域标识的 label 文本
    color: '#aaa',
    distance: 10
  },
  data: [
    [
      {
        xAxis: xAverage,
        yAxis: 0
      },
      {
        xAxis: Math.ceil(xMax * 2) + 20,
        yAxis: yAverage
      }
    ]
  ]
};
...
if (this.satisfactionOption.series.length > 3) {
  this.satisfactionOption.series[0].markArea = markAreaData1;
  this.satisfactionOption.series[1].markArea = markAreaData2;
  this.satisfactionOption.series[2].markArea = markAreaData3;
  this.satisfactionOption.series[3].markArea = markAreaData4;
}
上面,少于 4 个点将不会画区域,因为不存在四象限概念。
3.3. 散点图区域设置文本
如上画区域示例,markAreaData1.label.formatter 是区域的标识文本。
4. 旭日图 sunburst
旭日图
sunburst由多层的环形图组成,在数据结构上,内圈是外圈的父节点。因此,它既能像饼图一样表现局部和整体的占比,又能像矩形树图一样表现层级关系。
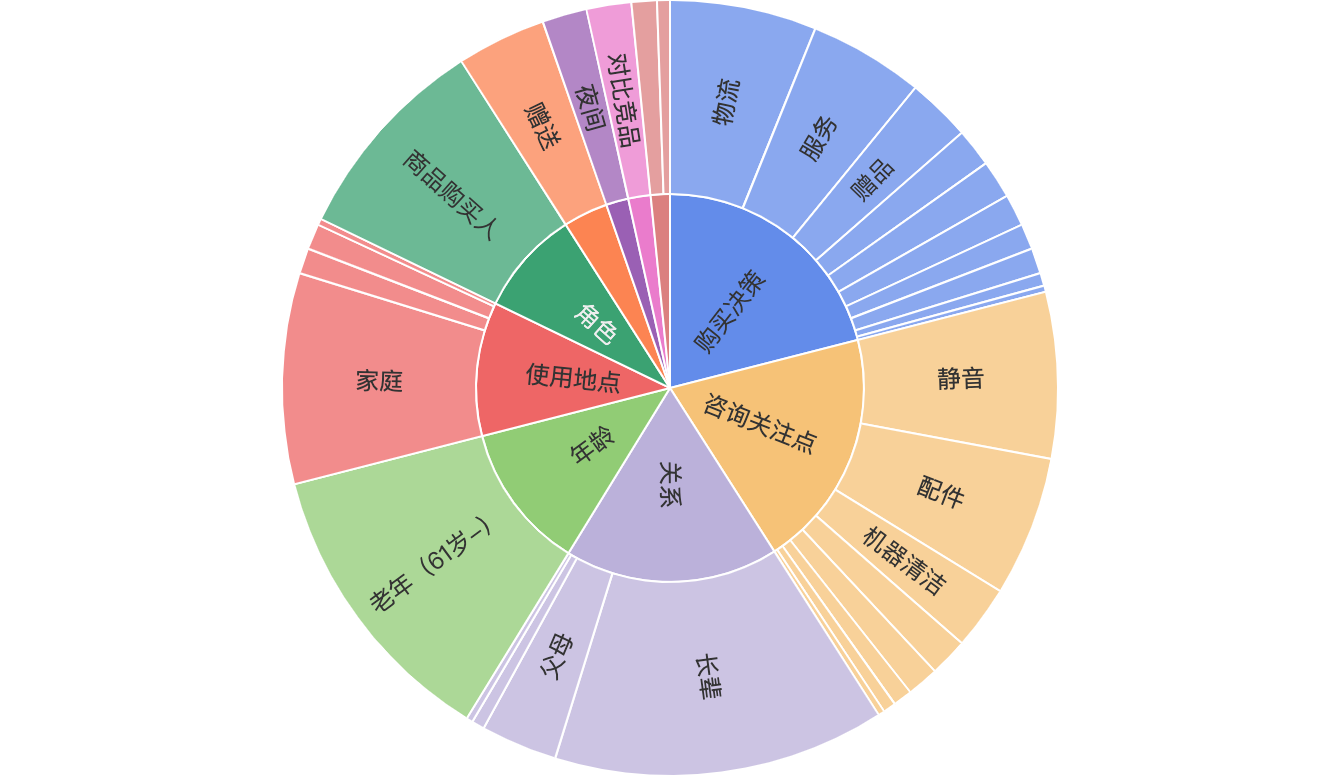
旭日图数据结构呈现父子关系结构。
// yapi 文档
{
  "type": "array",
  "items": {
    "type": "object",
    "properties": {
      "name": {
        "type": "string",
        "description": "父级名,如:\"关系\""
      },
      "children": {
        "type": "array",
        "items": {
          "type": "object",
          "properties": {
            "name": {
              "type": "string",
              "description": "子级名,如:\"夫妻\""
            },
            "value": {
              "type": "number",
              "description": "子级值,如:34"
            }
          },
          "description": "子级对象",
          "required": [
            "name",
            "value"
          ]
        },
        "description": "子级对象集合"
      }
    },
    "required": [
      "name"
    ]
  }
}

4.1. 设置最小角度 minAngle
minAngle当某个扇形块的角度小于该值(角度制)时,扇形块对应的文字不显示。该值用以隐藏过小扇形块中的文字。
外层的扇形和内层的扇形角度一样大,可是外层的区域更大,能显示更多文本。所以设置最小值时可以将外层的 minAngle 设置得更大些,将内层的 minAngle 设置得更小些。
this.option.series.data = value.map((item) => {
  return {
    ...item,
    label: {
      minAngle: 14
    },
    children: item.children.map((elem) => {
      return {
        ...elem,
        label: {
          minAngle: 6
        }
      };
    })
  };
});
5. 词云图 wordcloud
词云图,可用于的场景有很多,比如年度热词,可以根据出现的频次高低显示不同的字号,明确当前热门和人们最关切的词或事件。
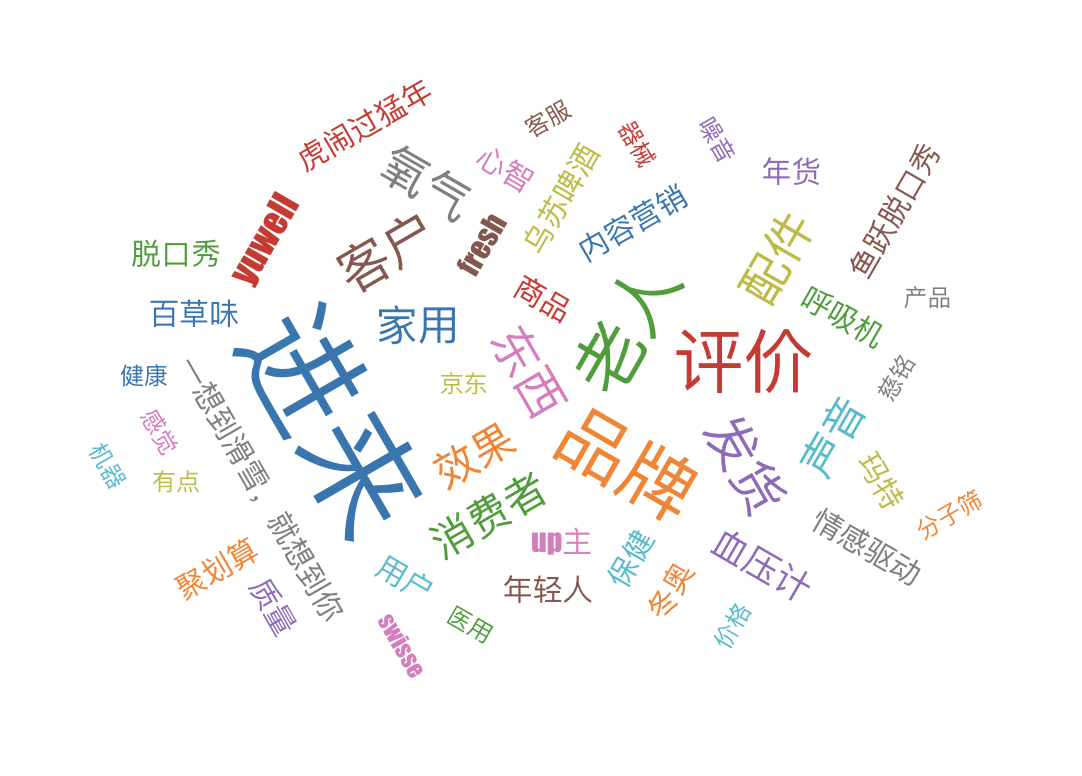
5.1. 根据词数量设置词大小
做词云图,有一个很重要的点,需要根据词数量来设置词的字号大小。因为当词很少且字号很小时,显示得就看不清。
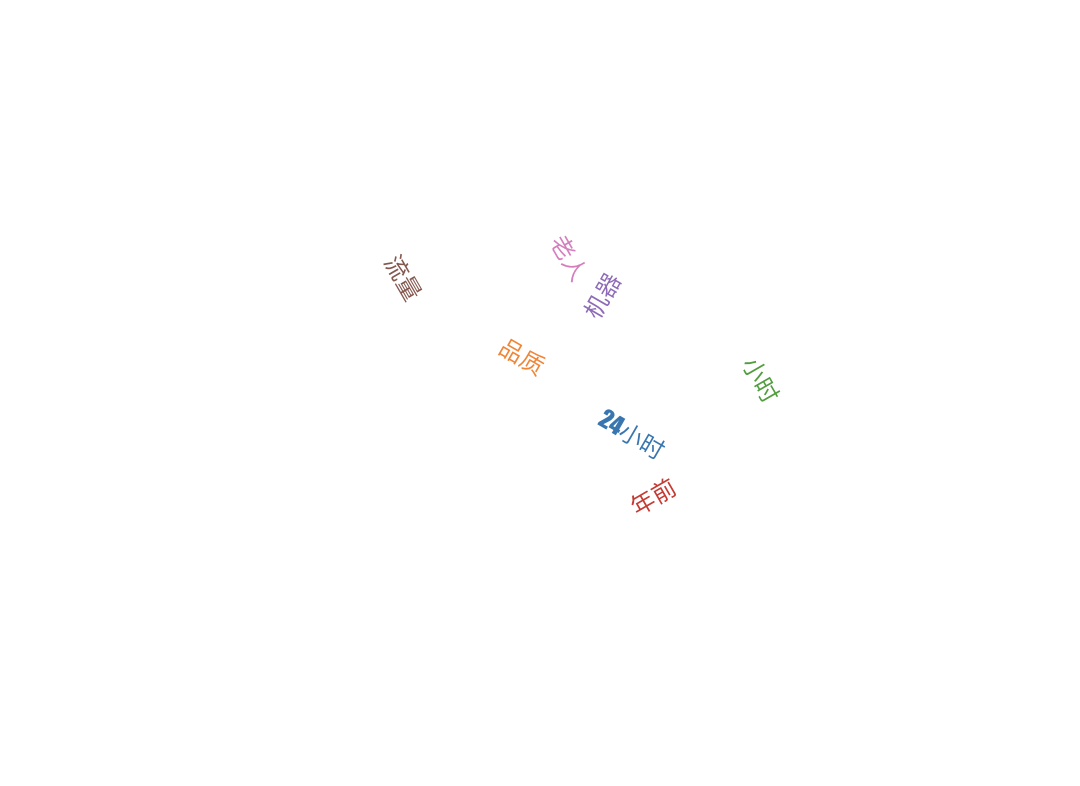
所以,需要根据词的数量来设置,词太少时,将字号设置得大一些。

6. 折线图 line
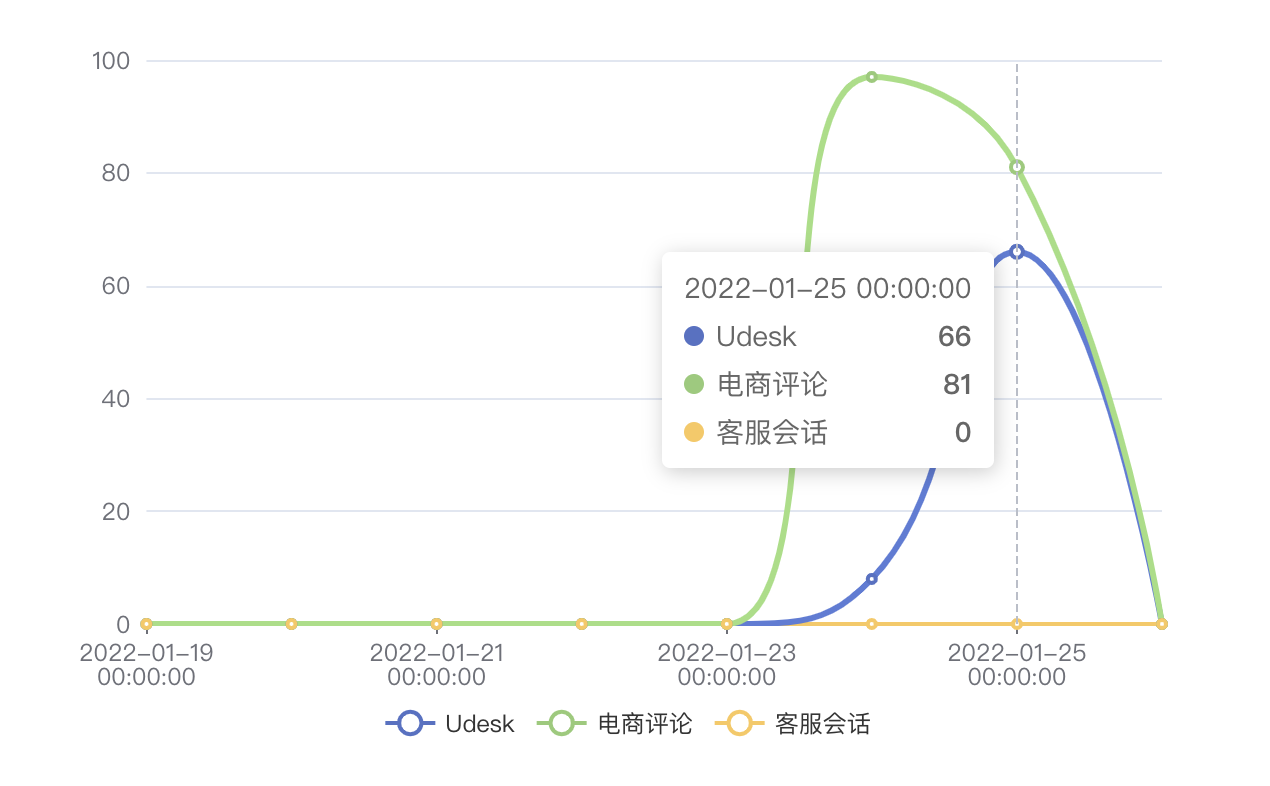
折线图是用折线将各个数据点标志连接起来的图表,用于展现数据的变化趋势。
6.1. 设置数据堆叠
数据堆叠,同个类目轴上系列配置相同的 stack 值后,后一个系列的值会在前一个系列的值上相加。
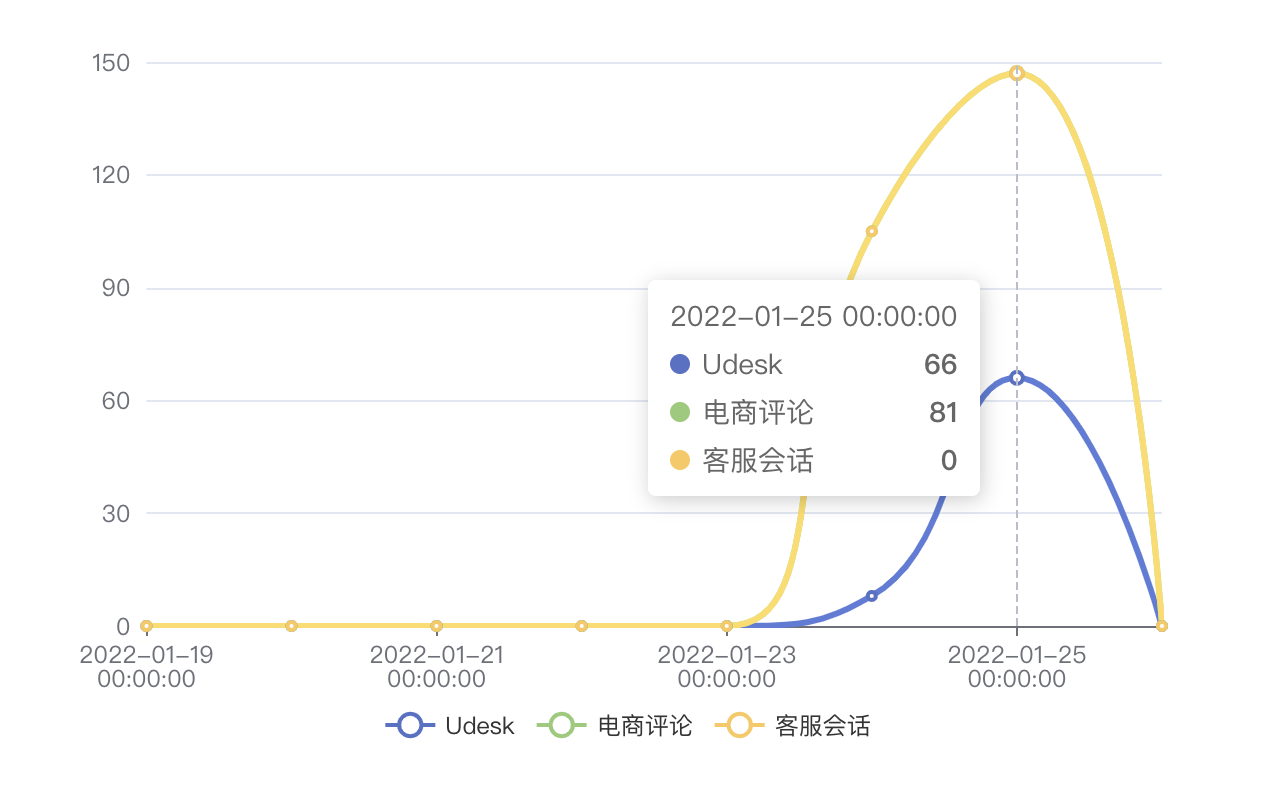
如上图,在 2022-01-25 这一时间,“客服会话”本来数值为 0,结果在图中显示为 147 了,就是因为“客服会话”的值在“Udesk”和“电商评论”的基础上叠加了。并且“客服会话”把“电商评论”的点给覆盖了。
7. 饼图 pie
饼图主要用于表现不同类目的数据在总和中的占比。每个的弧度表示数据数量的比例。
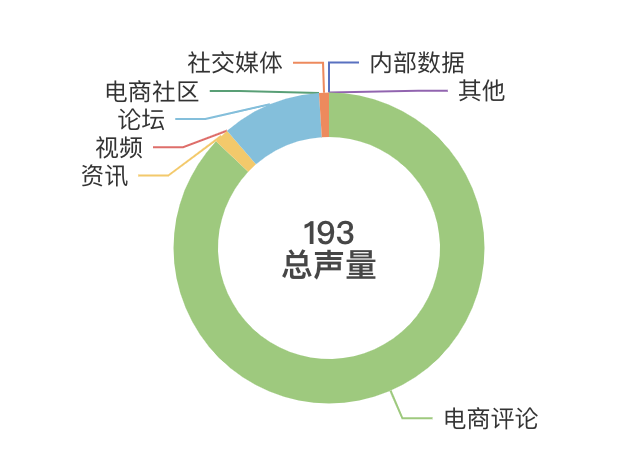
7.1. 标题的妙用
如上图, 193总声量,是用标题组件生成的。
option = {
  title: {
    text: '',
    left: 'center',
    top: 'center',
    textStyle: {
      fontSize: 16,
      align: 'center',
      verticalAlign: 'middle'
    }
  }
},

const count = Number(total).toLocaleString();
this.option.title.text = `${count}\n总声量`;

