Nacos Server的监控(十二)
Prometheus
Prometheus是一个开源的监控系统,起源于SoundCloud。它由以下几个核心组件构成:
- 数据爬虫:根据配置的时间定期的通过HTTP抓去metrics数据。
- time-series 数据库:存储所有的metrics数据。
- 简单的用户交互接口:可视化、查询和监控所有的metrics。
Grafana
Grafana使你能够把来自不同数据源比如Elasticsearch, Prometheus, Graphite, inflfluxDB等多样的数据以绚丽的图标展示出来。它也能基于你的metrics数据发出告警。当一个告警状态改变时,它能通知你通过email,slack或者其他途径。值得注意的是,Prometheus仪表盘也有简单的图标。但是Grafana的图表表现的更好。这也是为什么,我们需要整合Grafana和Pormetheus来可视化metrics数据。
Nacos server接入到监控
修改nacos的conf/application.properties配置放出Metrics for prometheus配置,然后访问http://localhost:8848/nacos/actuator/prometheus 可以看到服务监控信息,下面通过可视化的面板进行监控,先安装prometheus然后修改prometheus.yml,添加Nacos的采集任务
- 修改prometheus.yml
- job_name: 'nacos'
    metrics_path: '/nacos/actuator/prometheus'
    static_configs: - targets:
["192.168.216.128:8848","192.168.216.129:8848","192.168.216.130:8848"]
- job_name:任务名称
- metrics_path: 指标路径
- targets:实例地址/项目地址,可配置多个
- scrape_interval: 多久采集一次
- scrape_timeout: 采集超时时间
启动prometheus服务
./prometheus --config.file="prometheus.yml"
[root@localhost prometheus-2.17.1.linux-amd64]# nohup ./prometheus -- config.file=prometheus.yml --web.enable-lifecycle > prometheus.log 2>&1 &
访问:http://192.168.216.128:9090/ ,在搜索栏中搜索 nacos_monitor,如果可以看到nacos的数据,说明采集成功
采用grafana图形化展示metrics数据
wget https://dl.grafana.com/oss/release/grafana-7.0.3-1.x86_64.rpm sudo yum install grafana-7.0.3-1.x86_64.rpm
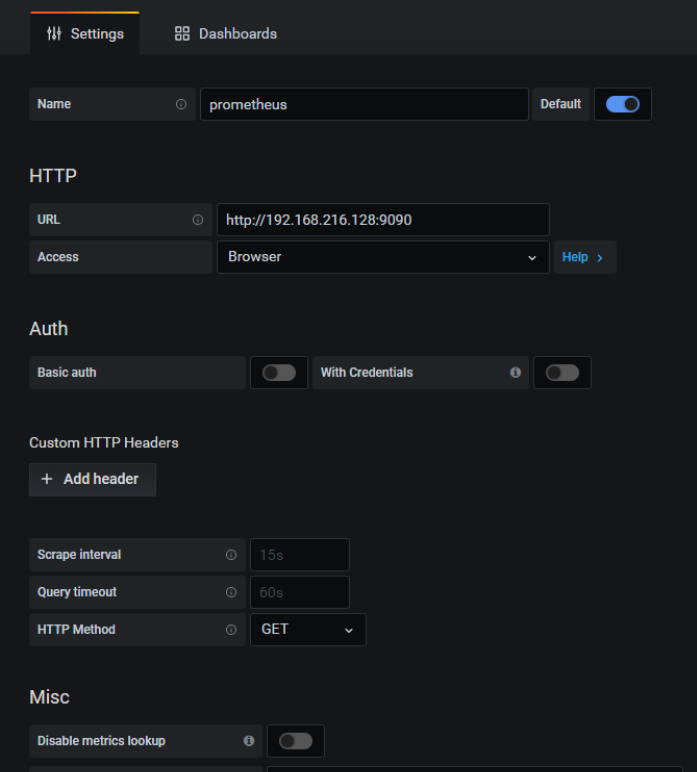
启动Grafana后访问Grafana , http://localhost:3000 , 默认的帐号密码 admin/admin;菜单选择 Configuration -> Data Source -> Add Data Source -> 名字:prometheus
![]()
导入nacos的面板数据 .nacos-granfa.json
这短短的一生我们最终都会失去,不妨大胆一点,爱一个人,攀一座山,追一个梦

 浙公网安备 33010602011771号