
matplotlib-plot-style
style
1.绘制x=1
2.不同线宽
- enumerate(Widths)
3.线型(实线,虚线,点划线) - linestyle
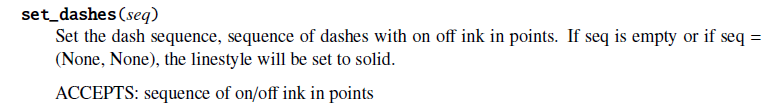
- set_dashes
4.自动设置线颜色
5.点的显示形式 - marker
- markersize
- markeredgecolor
- markerfacecolor
6.柱状图及其填充 - axes.bar
- axes.bar( .5+i, 1, hatch='/', color='white', edgecolor='blue',)
x=1
code
#!/usr/bin/env python
# -*- coding: utf-8 -*-
import numpy as np
import matplotlib
import matplotlib.pyplot as plt
#Data
Y=np.linspace(0,1,12)
X=np.ones(Y.size)
#figure
fig = plt.figure(figsize=(8,6), dpi=72, facecolor='white')
axes = plt.subplot(111)
#plot
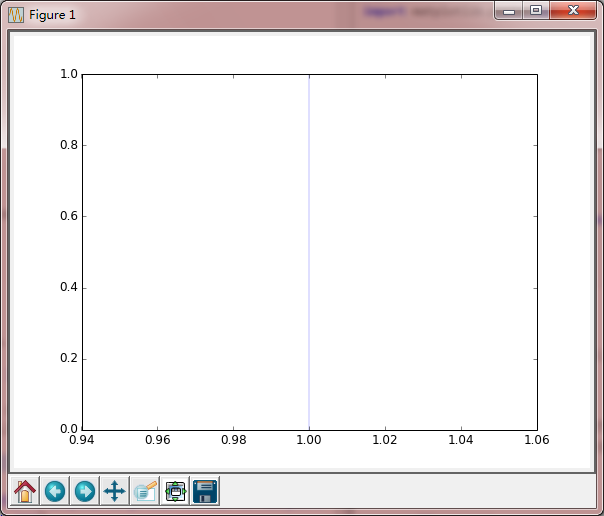
axes.plot( (1+0)*X, Y, linewidth=0.25, color='blue')
plt.show()
Keypoints
axes.plot( (1+0)*X, Y, linewidth=0.25, color='blue')
X=[ 1. 1. 1. 1. 1. 1. 1. 1. 1. 1. 1. 1.]
Y=[ 0. 0.09090909 0.18181818 0.27272727 0.36363636 0.45454545
0.54545455 0.63636364 0.72727273 0.81818182 0.90909091 1. ]
Result
不同线宽
code
#!/usr/bin/env python
# -*- coding: utf-8 -*-
import numpy as np
import matplotlib
import matplotlib.pyplot as plt

# Data to be represented
Y = np.linspace(0,1,12)
print Y

X = np.ones(Y.size)
print X

W = [0.25,0.50,0.75,1,2,3,4,5,6,7,8]  #linewidth
print W

# Actual plotting
fig = plt.figure(figsize=(8,6), dpi=72, facecolor='white')
axes = plt.subplot(111)

for i,w in enumerate(W):
    axes.plot( (1+i)*X, Y, linewidth=w, color='blue')

# X,Y axes lable
axes.set_xlim(0,len(W)+1)
axes.set_yticks([])
axes.set_xticks(np.arange(1,len(W)+1))
axes.set_xticklabels(['%.2f' % w for w in W])

plt.show()
Keypoints
for i,w in enumerate(W):
axes.plot( (1+i)*X, Y, linewidth=w, color='blue')
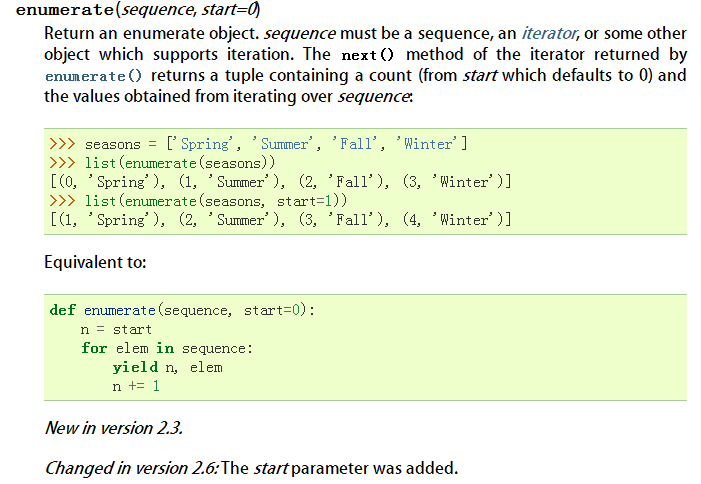
绘制12条直线,X=1,...X=12
### Result
隐藏Y轴刻度,替换X轴标签后的图形
----
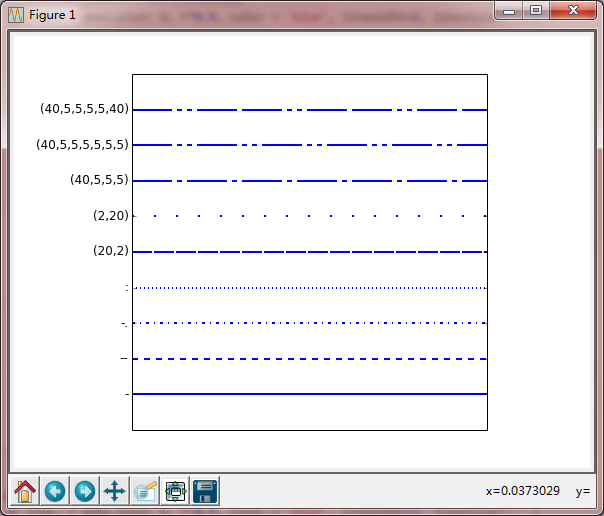
## 线型(实线,虚线,点划线)
### code
```python
#!/usr/bin/env python
# -*- coding: utf-8 -*-
import numpy as np
import matplotlib
import matplotlib.pyplot as plt
# Data to be represented
X = np.linspace(0,1,10)
Y = np.ones(X.size)
# Actual plotting
fig = plt.figure(figsize=(8,6), dpi=72, facecolor="white")
axes = plt.subplot(111,aspect=1)
axes.plot( X, Y*0.1, color = 'blue', linewidth=2, linestyle="-" )
axes.plot( X, Y*0.2, color = 'blue', linewidth=2, linestyle="--" )
axes.plot( X, Y*0.3, color = 'blue', linewidth=2, linestyle="-." )
axes.plot( X, Y*0.4, color = 'blue', linewidth=2, linestyle=":" )
line, = axes.plot( X, Y*0.5, color = 'blue', linewidth=2, linestyle="-" )
line.set_dashes([20,2])
line, = axes.plot( X, Y*0.6, color = 'blue', linewidth=2, linestyle="-" )
line.set_dashes([2,20])
line, = axes.plot( X, Y*0.7, color = 'blue', linewidth=2, linestyle="-" )
line.set_dashes((40,5,5,5))
line, = axes.plot( X, Y*0.8, color = 'blue', linewidth=2, linestyle="-" )
line.set_dashes((40,5,5,5,5,5))
line, = axes.plot( X, Y*0.9, color = 'blue', linewidth=2, linestyle="-" )
line.set_dashes((40,5,5,5,5,5,40,5))
axes.set_xlim(X.min(),X.max())
axes.set_ylim(0,1)
axes.set_xticks([])
axes.set_yticks(np.arange(1,10)/10.0)
axes.set_yticklabels(("-","--","-.",":",
"(20,2)", "(2,20)", "(40,5,5,5)",
"(40,5,5,5,5,5,5)", "(40,5,5,5,5,40)"))
plt.show()
Keypoints
axes.plot( X, Y*0.1, color = 'blue', linewidth=2, linestyle="-")
linestyle="-" 线型:
-
- --
- -.
- :
控制点划线的点,空格,划的长度:
line, = axes.plot( X, Y*0.9, color = 'blue', linewidth=2, linestyle="-" )
line.set_dashes((40,5,5,5,5,5,40,5))
40划5空格5点5空格5点5空格40划5空格
Result
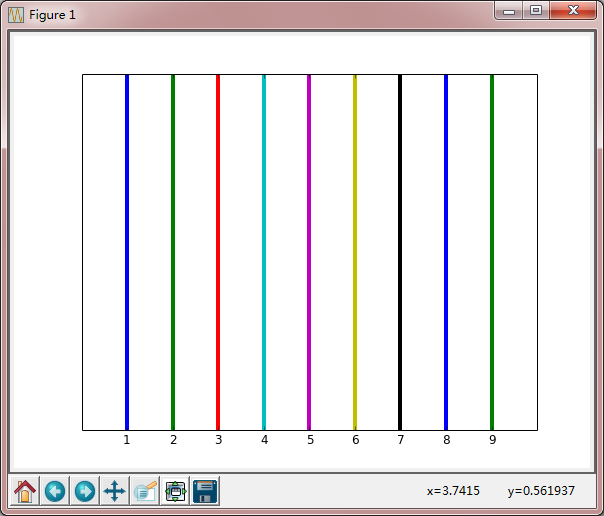
自动设置线颜色
code
#!/usr/bin/env python
# -*- coding: utf-8 -*-
import numpy as np
import matplotlib
import matplotlib.pyplot as plt

# Data to be represented
Y = np.linspace(0,1,12)
X = np.ones(Y.size)

# Actual plotting
fig = plt.figure(figsize=(8,6), dpi=72, facecolor="white")
axes = plt.subplot(111)

lineNumbers=9
for i in range(lineNumbers):
    axes.plot( (1+i)*X, Y, linewidth=4)

axes.set_xlim(0,lineNumbers+1)
axes.set_yticks([])
axes.set_xticks(np.arange(1,lineNumbers+1))

plt.show()
Keypoints
这里用循环绘制了9条直线,但是这里是自动填充颜色的?
Result
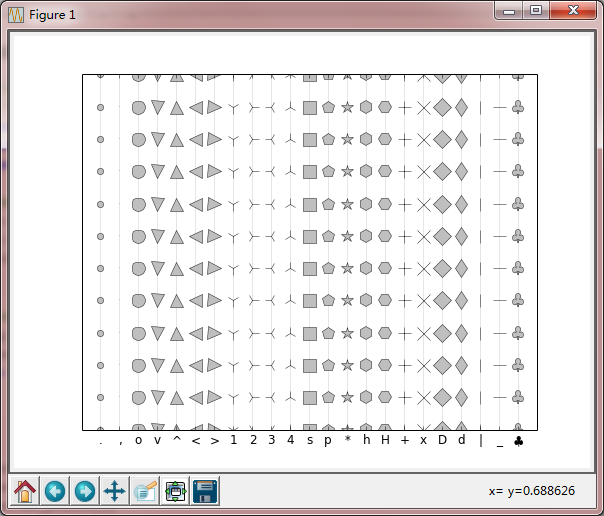
5. 点的显示形式
code
#!/usr/bin/env python
# -*- coding: utf-8 -*-
import numpy as np
import matplotlib
import matplotlib.pyplot as plt

# Data to be represented
Y = np.linspace(0,1,12)
X = np.ones(Y.size)
markers = ['.',',','o','v','^','<','>','1','2','3','4',
           's','p','*','h','H','+','x','D','d','|','_', r'$\clubsuit$']

# Actual plotting
fig = plt.figure(figsize=(8,6), dpi=72, facecolor="white")
axes = plt.subplot(111)
for i,marker in enumerate(markers):
    axes.plot( (1+i)*X, Y, color = '0.9', linewidth=1,
               markersize = 13, marker=marker,
               markeredgecolor = '0.10', markerfacecolor = '0.75')

axes.set_xlim(0,len(markers)+1)
axes.set_ylim(Y.min(),Y.max())
axes.set_yticks([])
axes.set_xticks(np.arange(1,len(markers)+1))
axes.set_xticklabels(markers)

plt.show()
Keypoints
   axes.plot( (1+i)*X, Y, color = '0.9', linewidth=1,
               markersize = 13, marker='x',
               markeredgecolor = '0.10', markerfacecolor = '0.75')
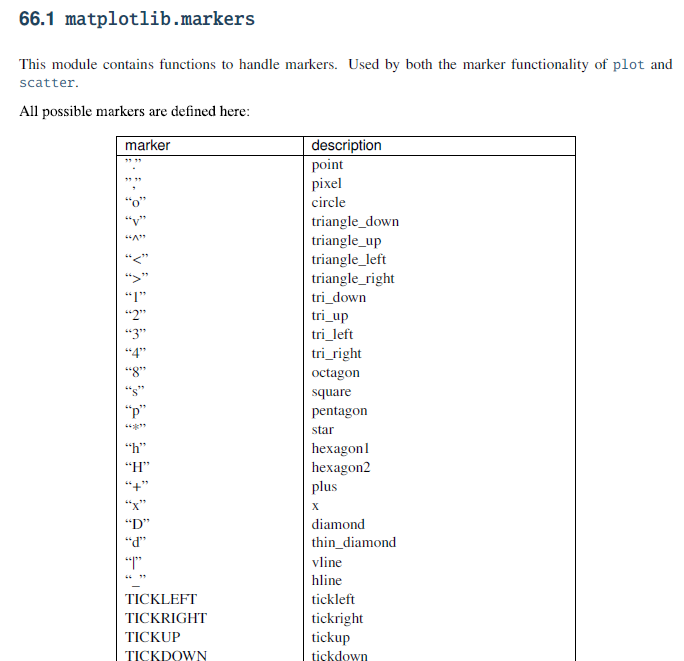
标记的大小,类型,边缘颜色,前景色
Resutl
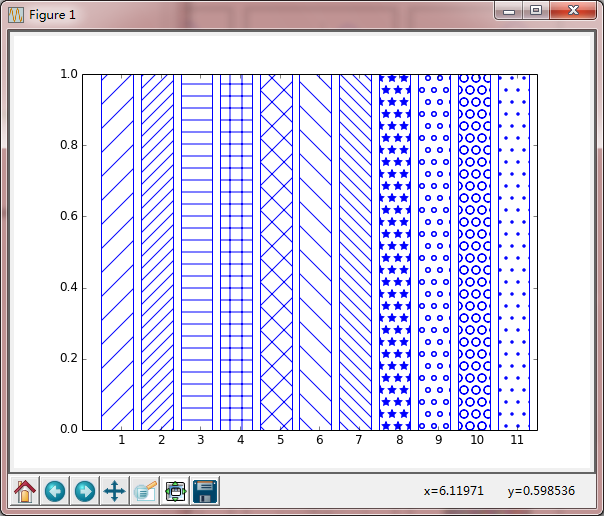
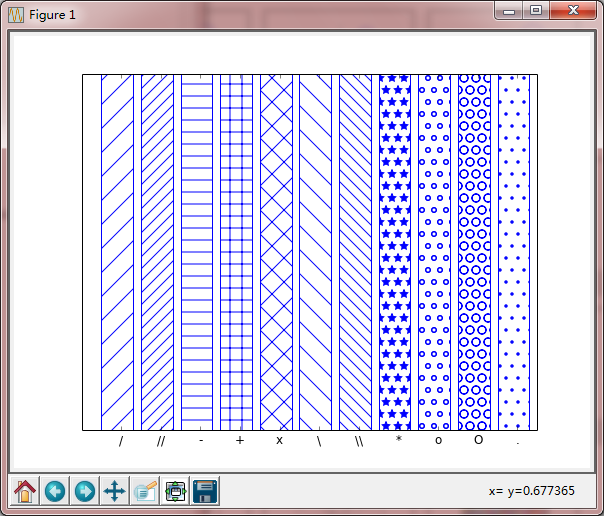
6. 柱状图及其填充
code
#!/usr/bin/env python
# -*- coding: utf-8 -*-
import numpy as np
import matplotlib
import matplotlib.pyplot as plt

# Data to be represented
X = np.linspace(0,1,10)
Y = np.ones(X.size)
patterns = ('/','//','-', '+', 'x', '\\', '\\\\', '*', 'o', 'O', '.')

# Actual plotting
fig = plt.figure(figsize=(8,6), dpi=72, facecolor="white")
axes = plt.subplot(111)
for i,pattern in enumerate(patterns):
    axes.bar( .5+i, 1, hatch=pattern, color='white', edgecolor='blue',)

axes.set_xlim(0,len(patterns)+.5)
axes.set_ylim(0,1)

axes.set_yticks([])
axes.set_xticks(np.arange(1,len(patterns)+1))
axes.set_xticklabels(patterns)

plt.show()
Keypoints
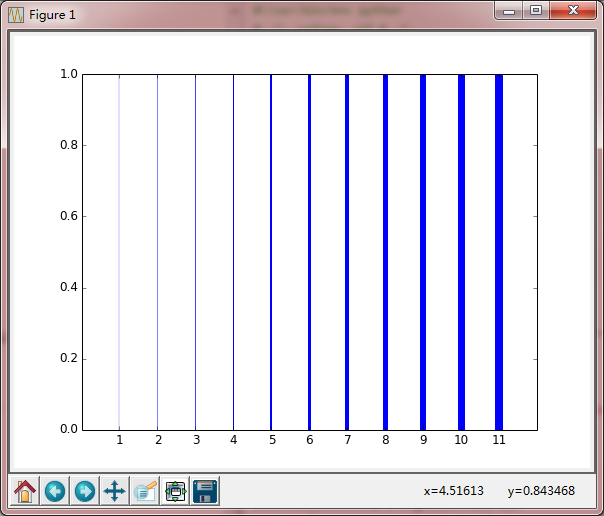
axes.bar( .5+i, 1, hatch=pattern, color='white', edgecolor='blue',)
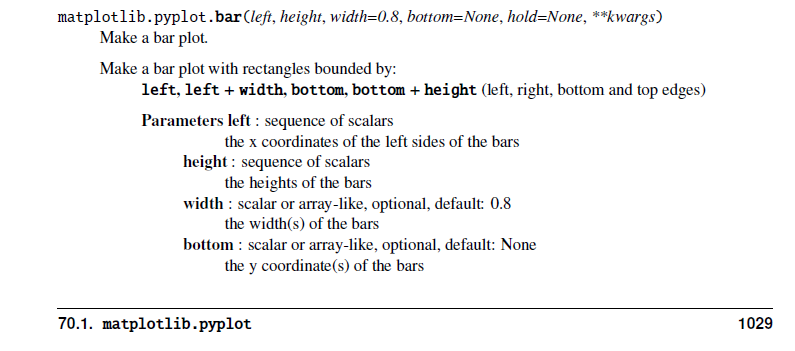
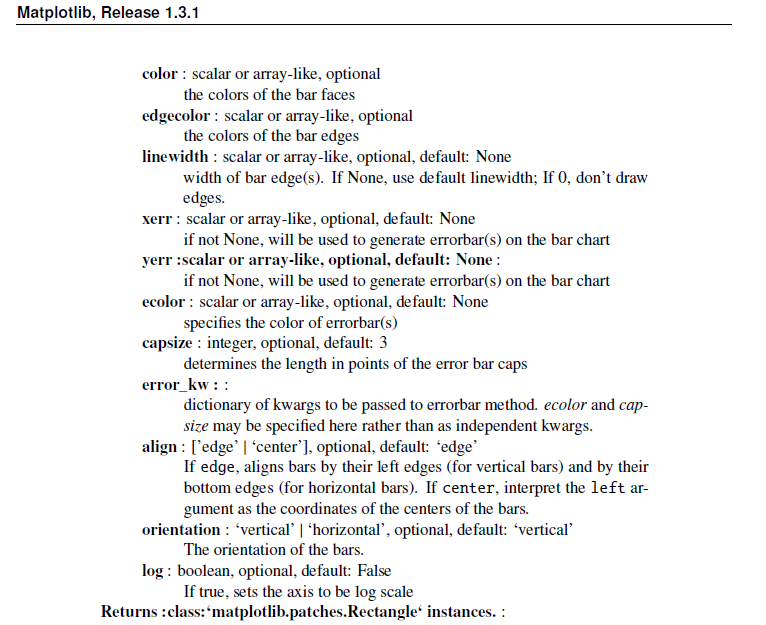
hatch,柱状图的填充:
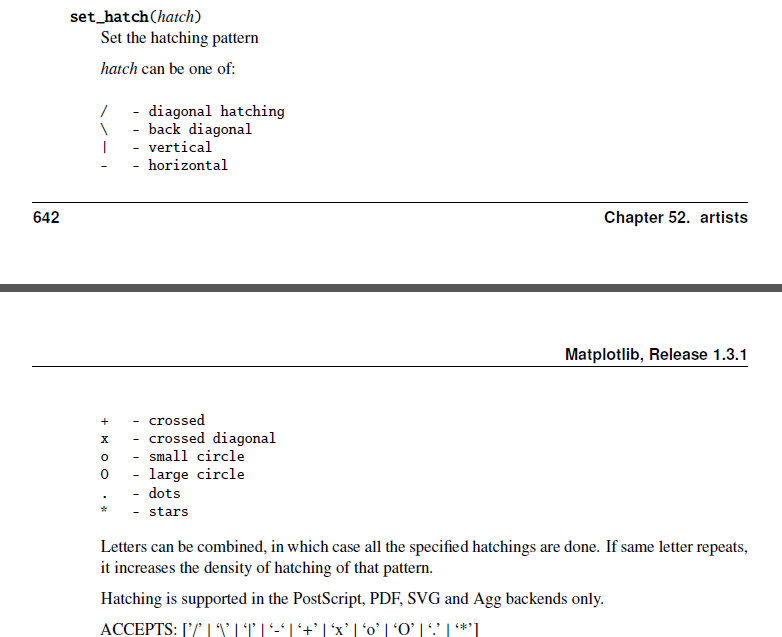
Result

 浙公网安备 33010602011771号