springboot+prometheus+grafana
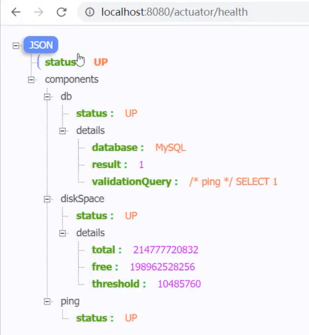
Actuator是Springboot提供的用来对应用系统进行自省和监控的功能模块,借助于Actuator开发者可以很方便地对应用系统某些监控指标进行查看、统计等。
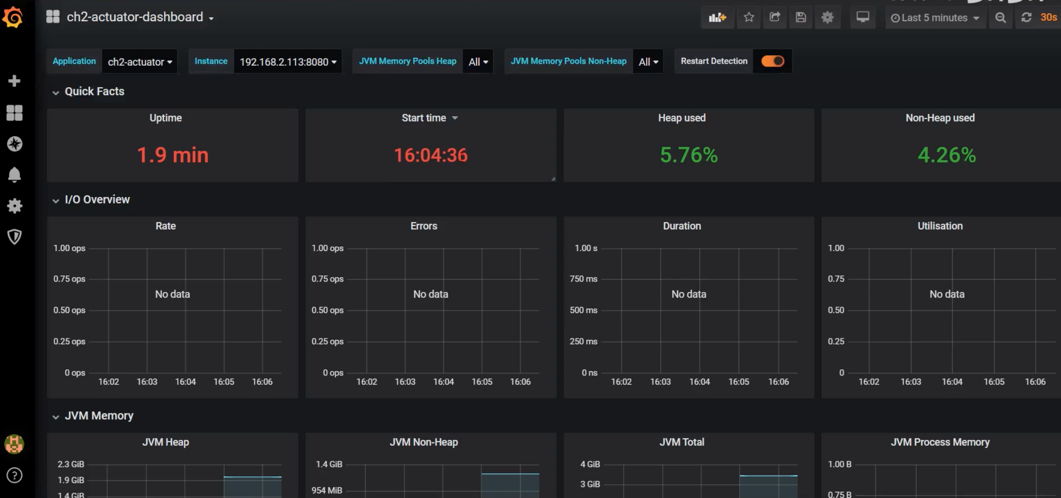
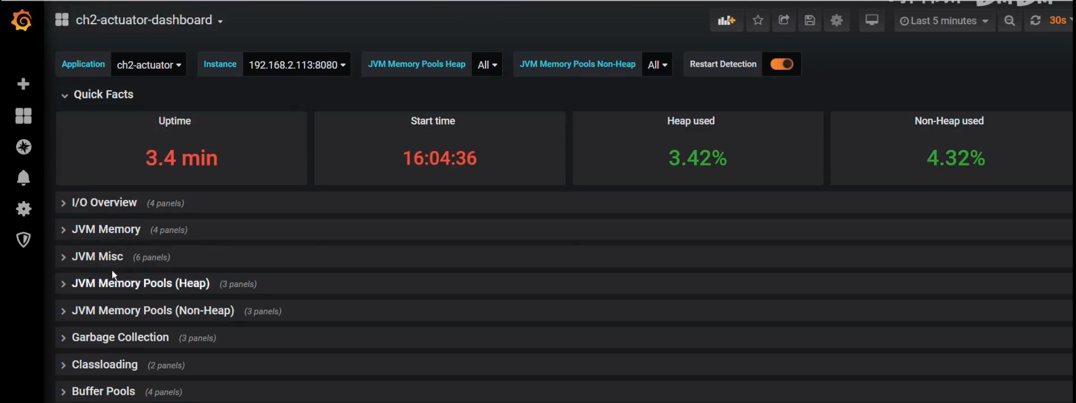
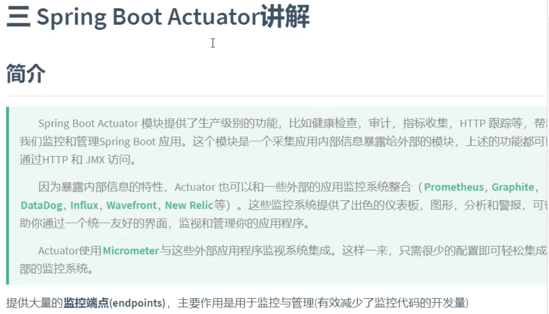
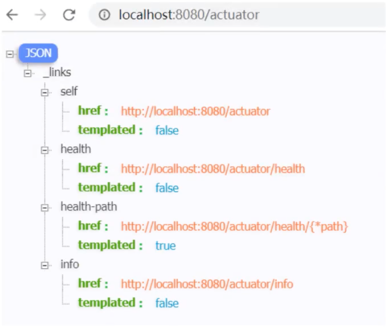
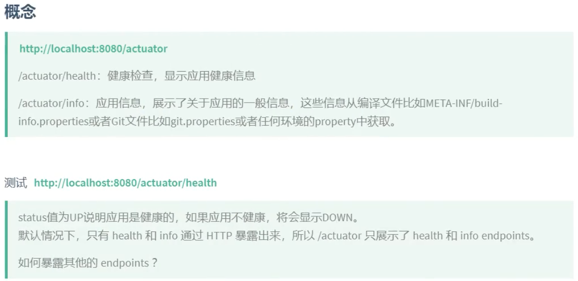
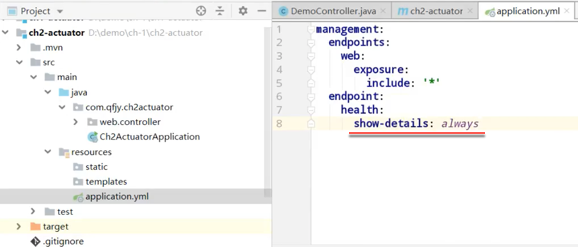
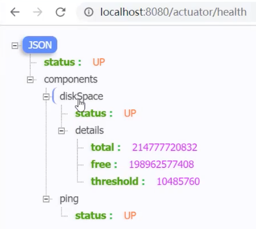
Spring Boot Actuator可以帮助你监控和管理Spring Boot应用,比如健康检查、审计、统计和HTTP追踪等。所有的这些特性可以通过JMX或者HTTP endpoints来获得。
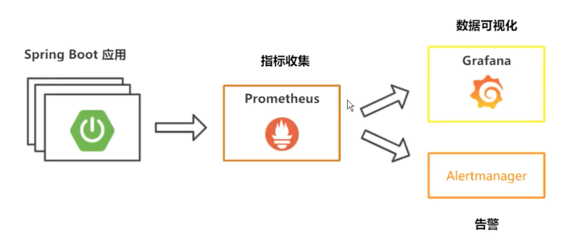
Actuator同时还可以与外部应用监控系统整合,比如 Prometheus, Graphite, DataDog, Influx, Wavefront, New Relic等。这些系统提供了非常好的仪表盘、图标、分析和告警等功能,使得你可以通过统一的接口轻松的监控和管理你的应用。
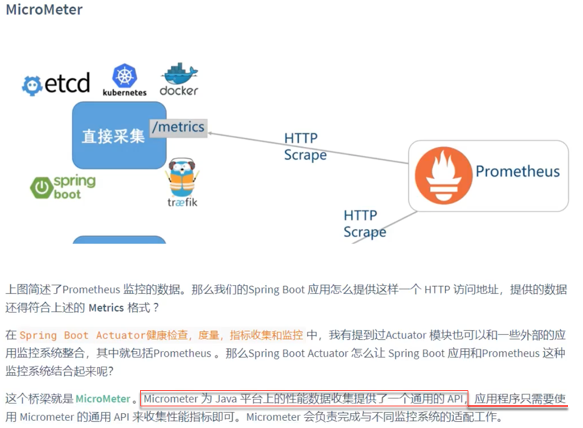
Actuator使用Micrometer来整合上面提到的外部应用监控系统。这使得只要通过非常小的配置就可以集成任何应用监控系统。
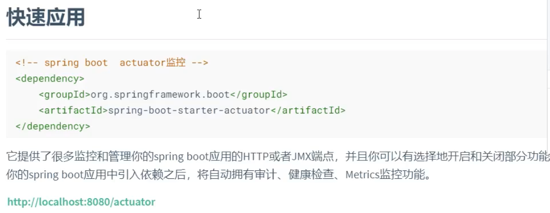
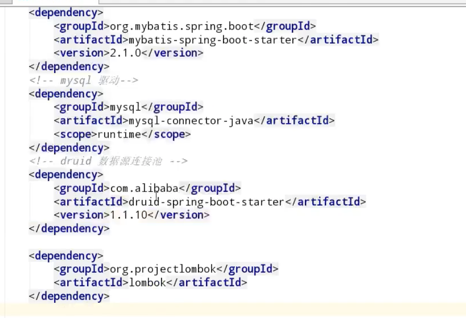
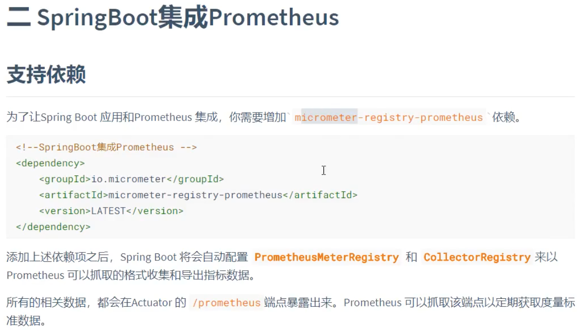
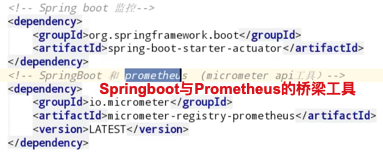
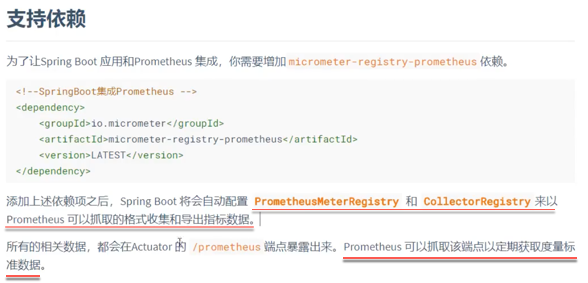
<dependencies>
    <dependency>
        <groupId>org.springframework.boot</groupId>
        <artifactId>spring-boot-starter-actuator</artifactId>
    </dependency>
</dependencies>

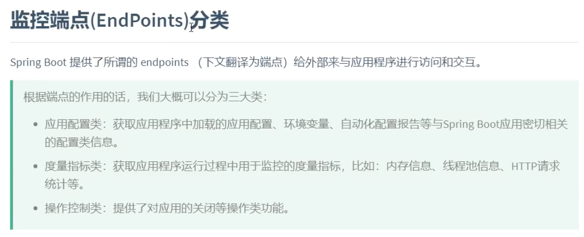
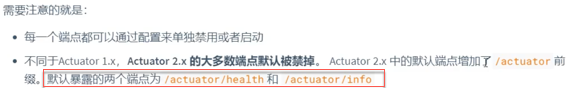
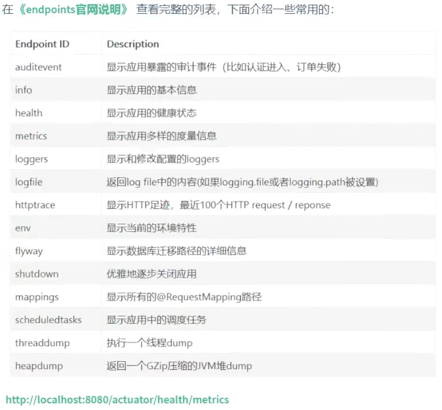
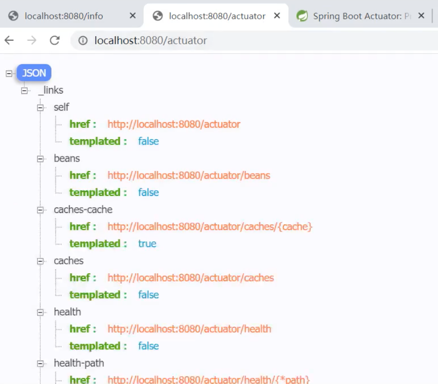
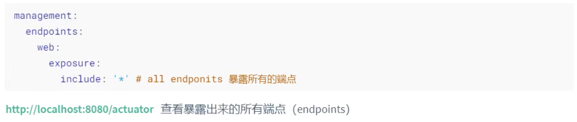
端点列表

项目配置完数据库
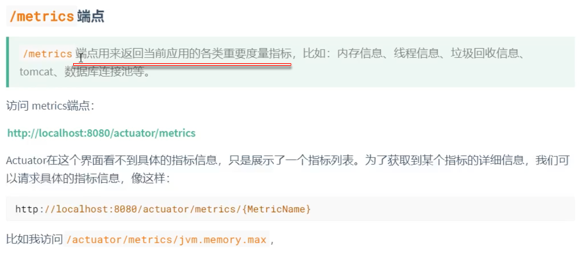
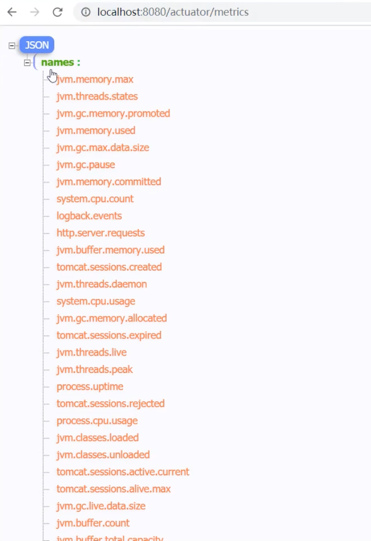
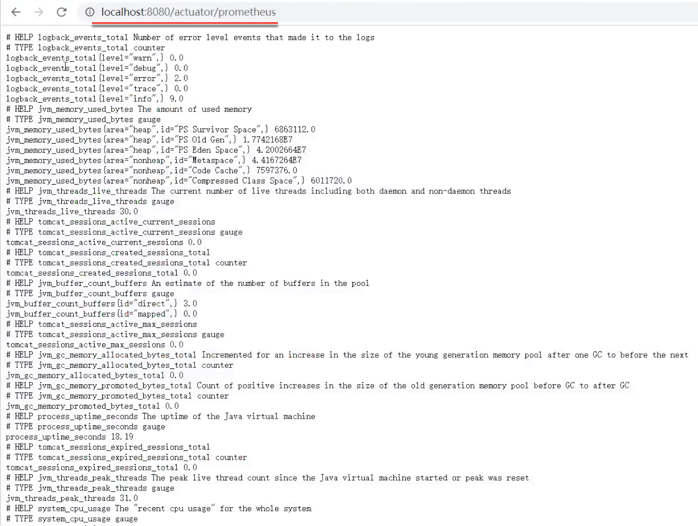
metrics端点
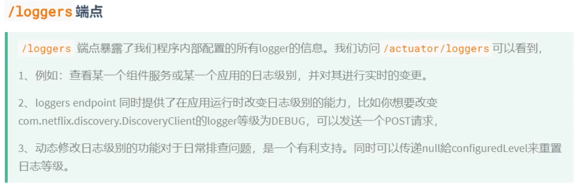
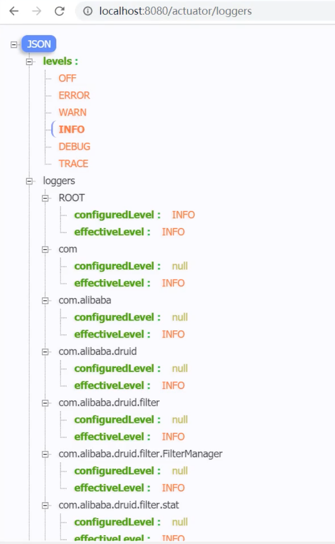
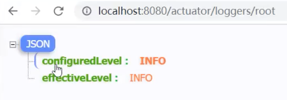
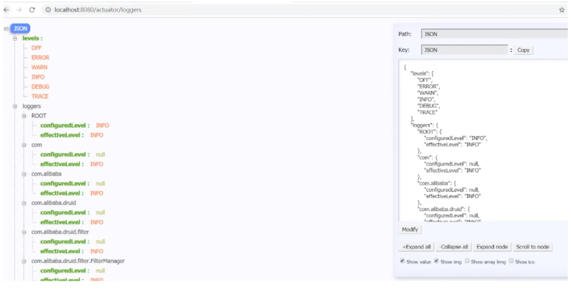
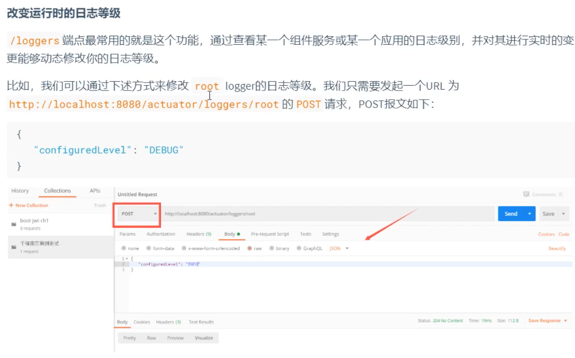
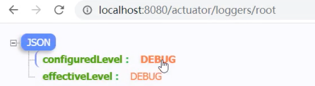
loggers端点
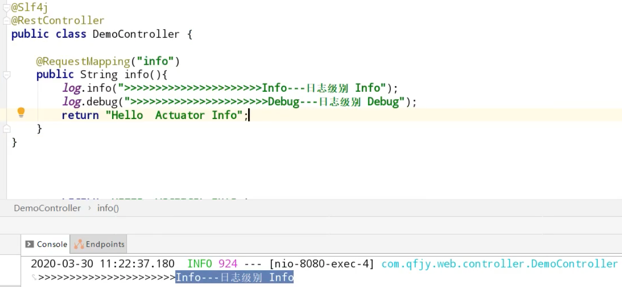

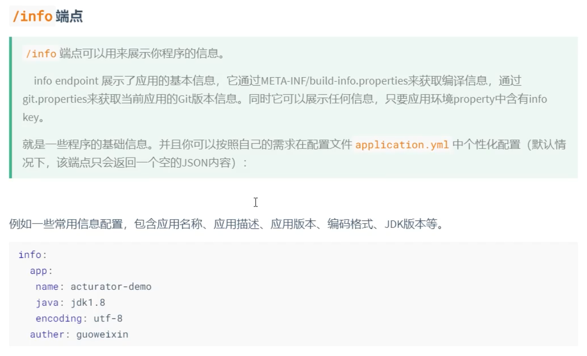
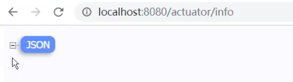
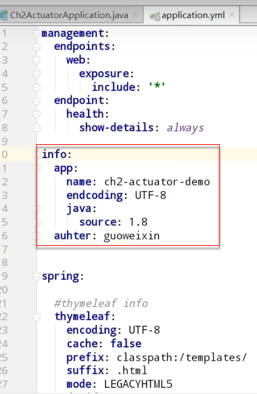
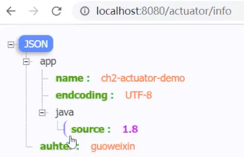
info端点
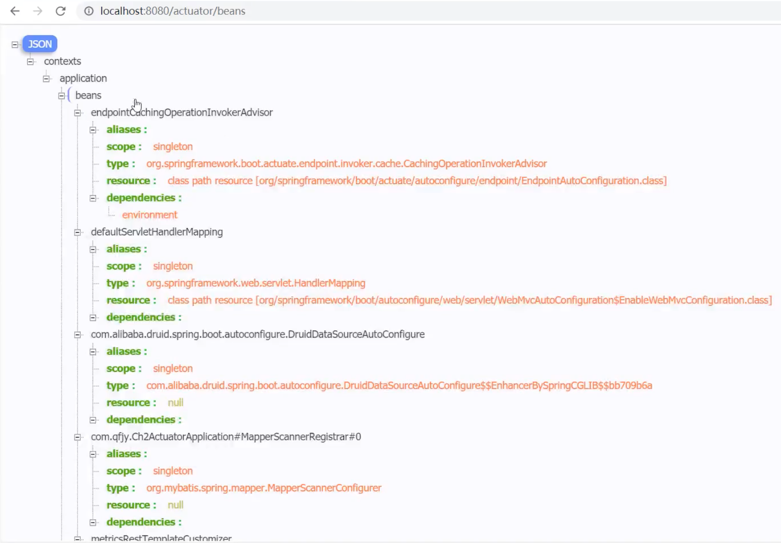
beans端点
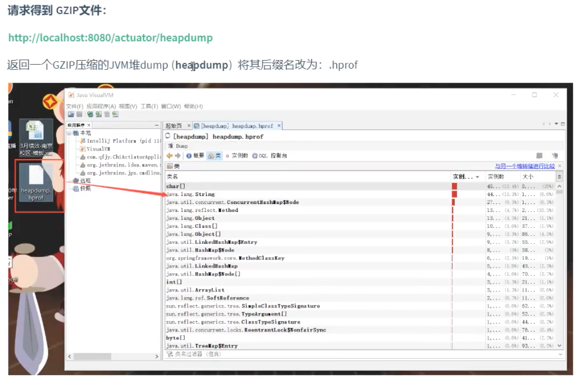
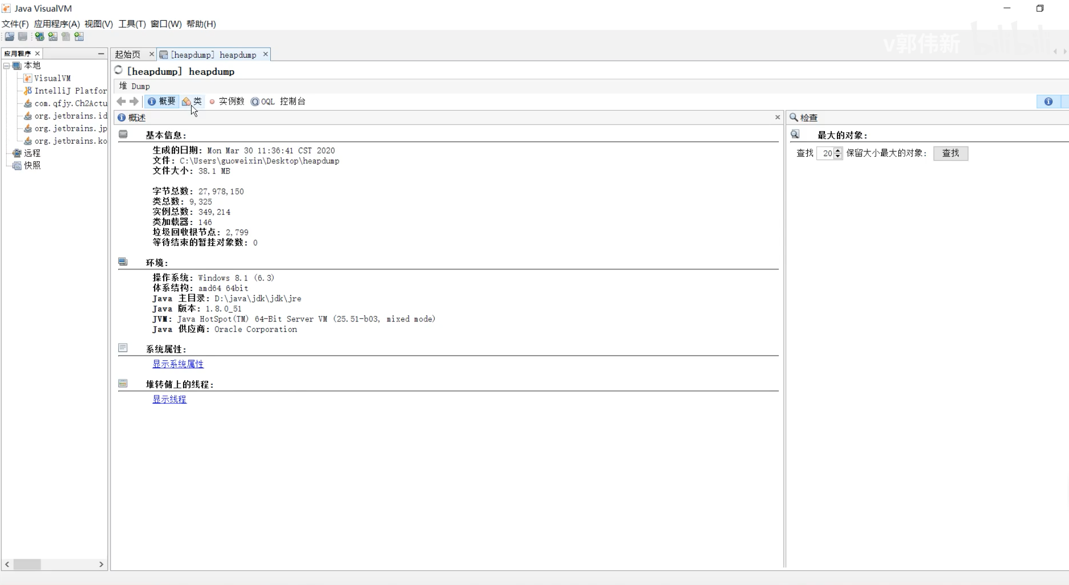
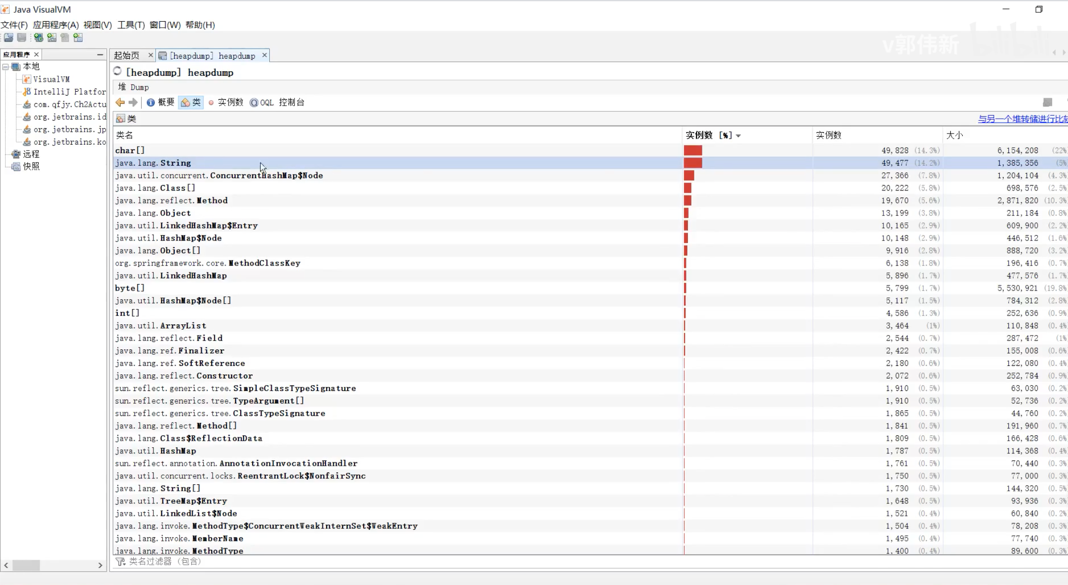
heapdump端点

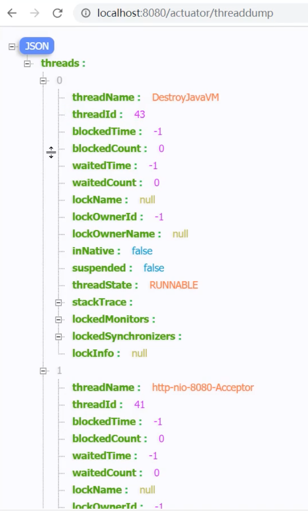
threaddump端点

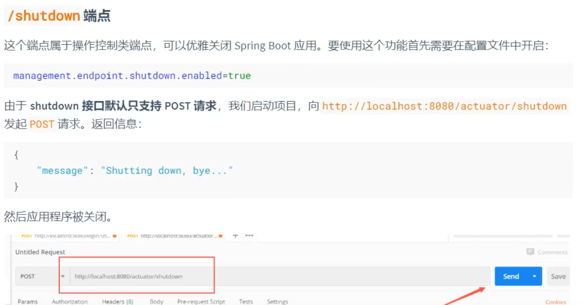
shutdown端点

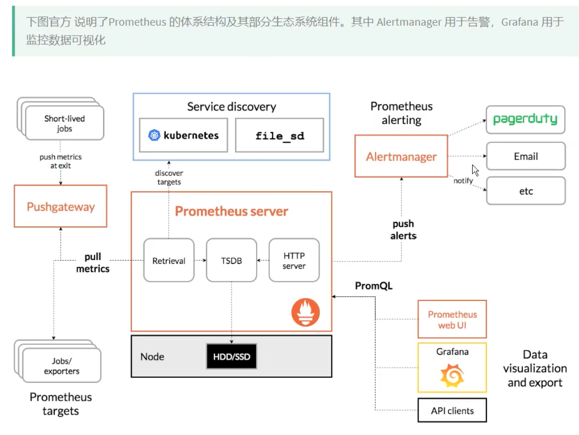


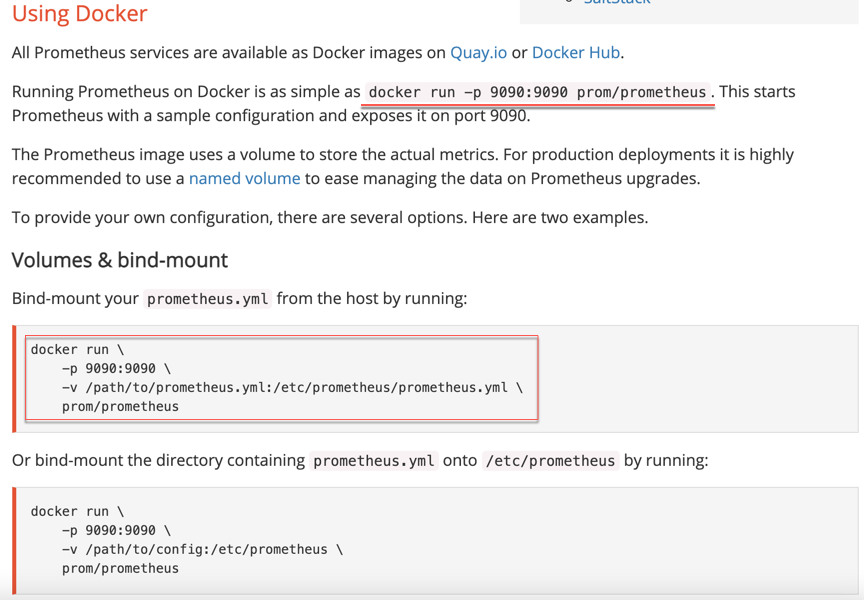
Prometheus安装
官方安装教程地址
https://prometheus.io/docs/prometheus/latest/installation/
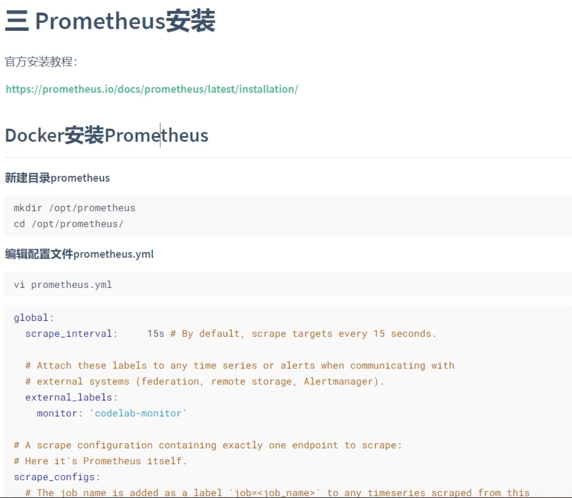
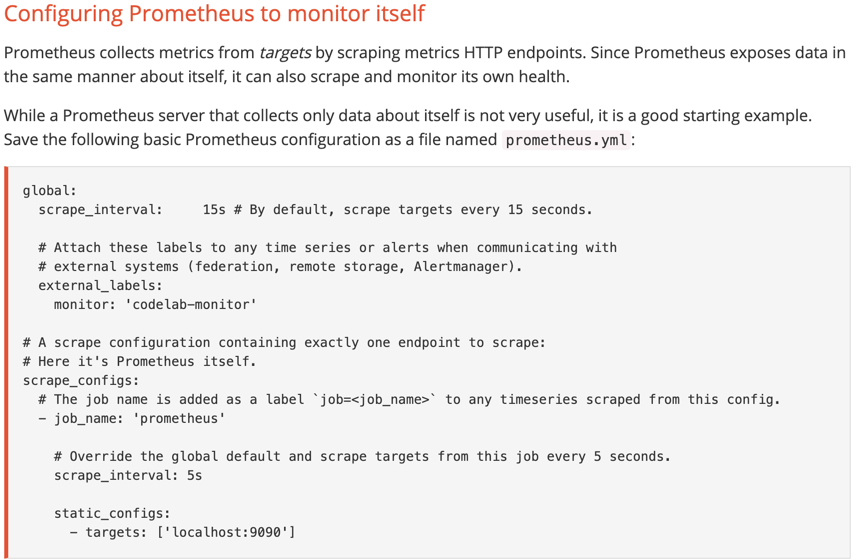
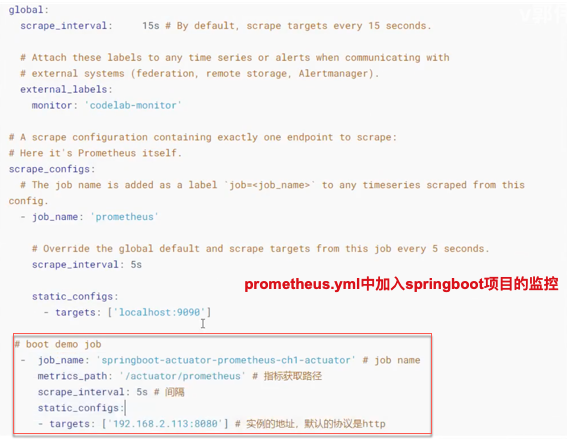
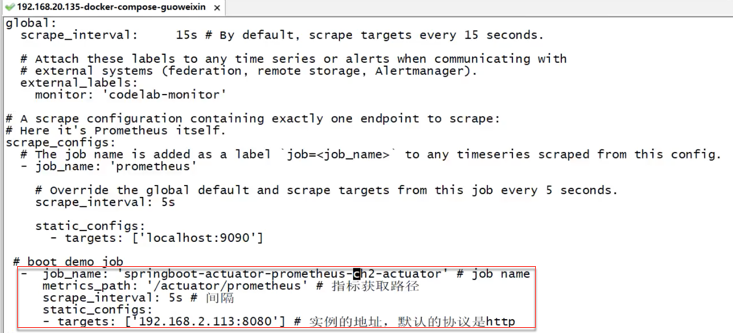
global:
scrape_interval: 15s # By default, scrape targets every 15 seconds.
# Attach these labels to any time series or alerts when communicating with
# external systems (federation, remote storage, Alertmanager).
external_labels:
monitor: 'codelab-monitor'
# A scrape configuration containing exactly one endpoint to scrape:
# Here it's Prometheus itself.
scrape_configs:
# The job name is added as a label `job=<job_name>` to any timeseries scraped from this config.
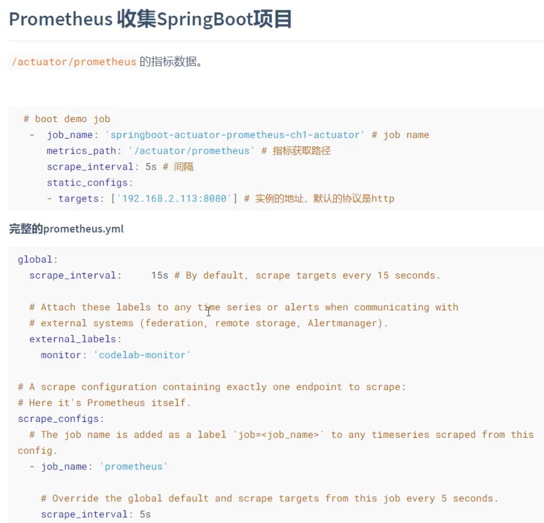
- job_name: 'prometheus'
# Override the global default and scrape targets from this job every 5 seconds.
scrape_interval: 5s
static_configs:
- targets: ['localhost:9090']
docker run \
    -p 9090:9090 \
    -v /Users/zhangxm/prometheus/prometheus.yml:/etc/prometheus/prometheus.yml \
    prom/prometheus

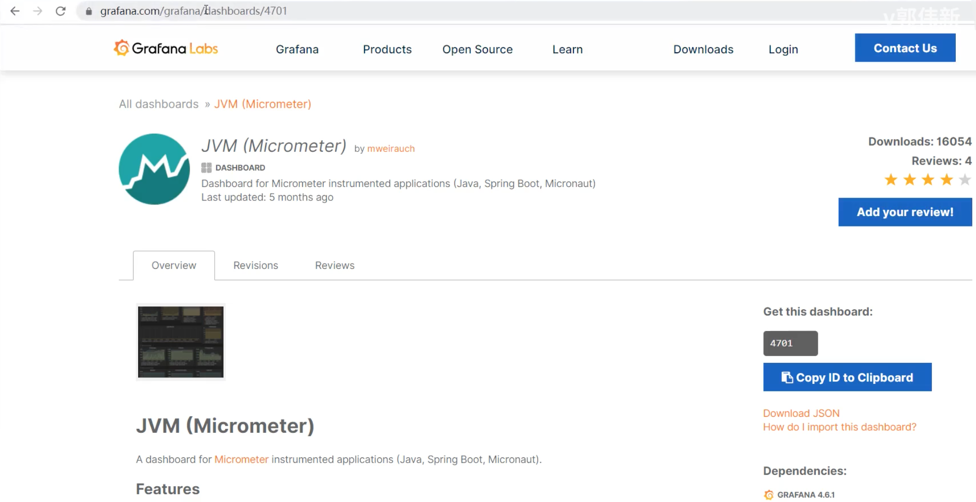
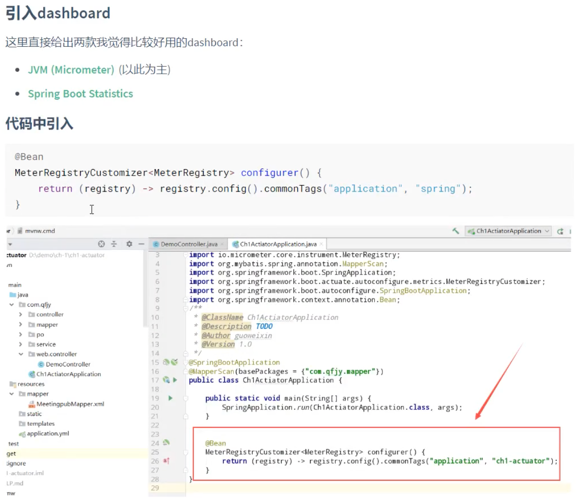
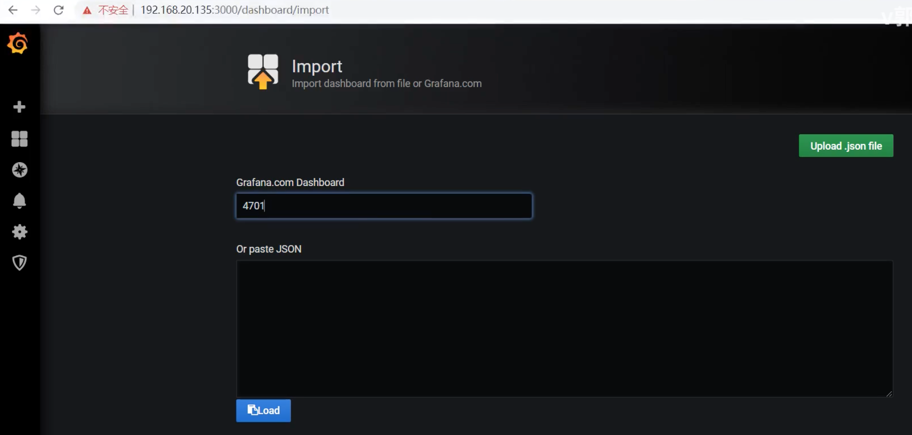
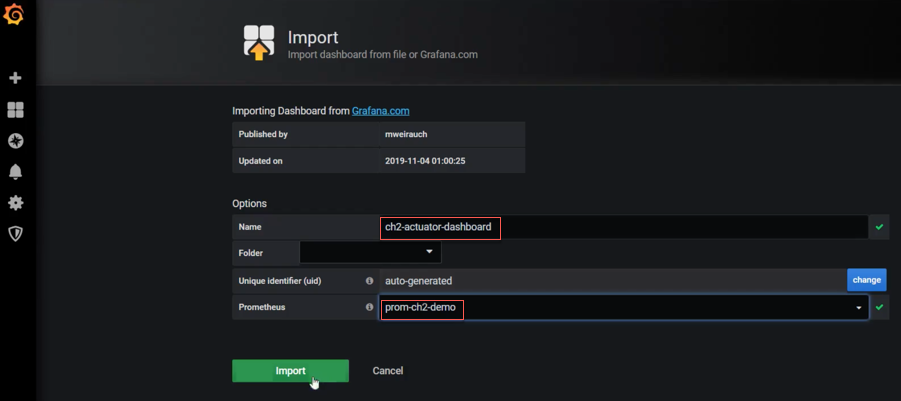
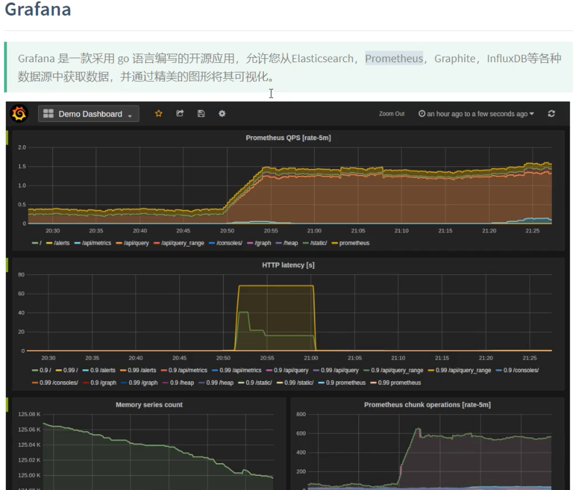
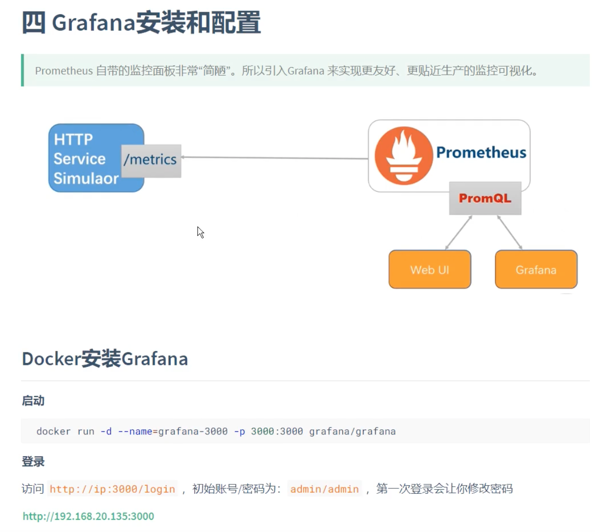
Grafana安装
Grafana插件