
SpringBoot2.X&Prometheus使用
1、启动Prometheus
[root@ip101 prometheus-2.12.0.linux-amd64]# pwd
/opt/app/prometheus-2.12.0.linux-amd64

./prometheus --config.file=prometheus.yml  &
ps -ef|grep prometheus |grep -v grep
2、Prometheus 查看
2.1、Prometheus自身metrics
http://192.168.8.101:9090/metrics
2.2、 Prometheus自身graph
http://192.168.8.101:9090/graph
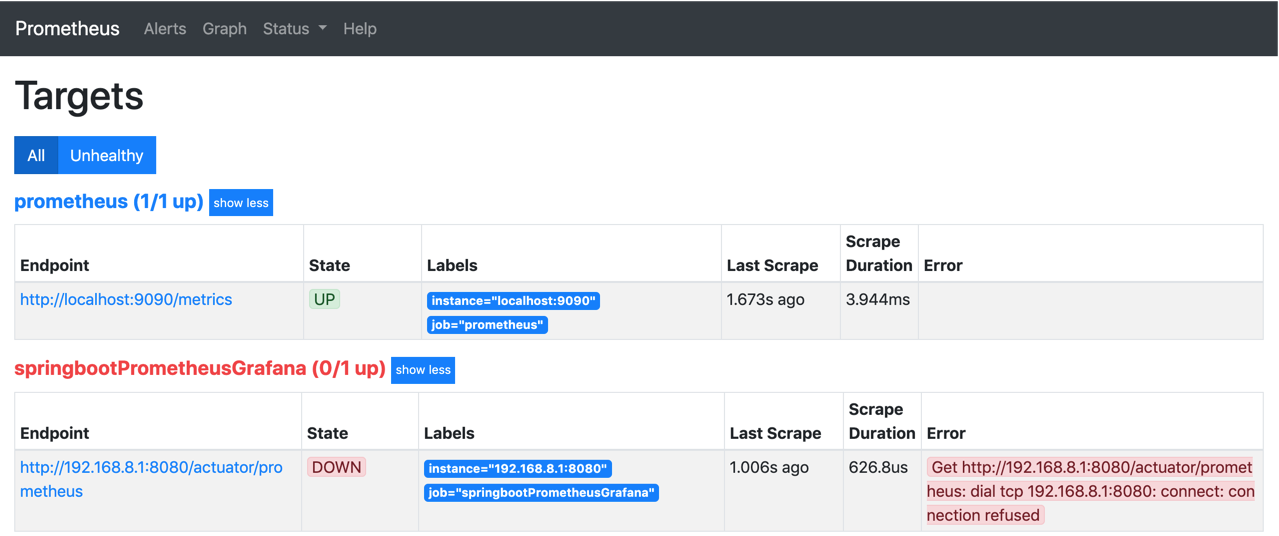
2.3、Prometheus自身targets
http://192.168.8.101:9090/targets
3、SpringBoot Actuator
server.port=8080
spring.application.name=springboot_prometheus
management.endpoints.web.exposure.include=*
management.metrics.tags.application=${spring.application.name}

#注意此处 如何配置为根目录的话,直接访问http://192.168.8.1:8080/prometheus
#http://192.168.8.1:8080/actuator/prometheus
management.endpoints.web.base-path=/actuator
Prometheus配置
global:
  scrape_interval: 15s
  scrape_timeout: 10s
  evaluation_interval: 15s
alerting:
  alertmanagers:
  - static_configs:
    - targets: []
    scheme: http
    timeout: 10s
    api_version: v1
scrape_configs:
- job_name: prometheus
  honor_timestamps: true
  scrape_interval: 15s
  scrape_timeout: 10s
  metrics_path: /metrics
  scheme: http
  static_configs:
  - targets:
    - localhost:9090
- job_name: springbootPrometheusGrafana
  honor_timestamps: true
  scrape_interval: 5s
  scrape_timeout: 5s
  metrics_path: /actuator/prometheus
  scheme: http
  static_configs:
  - targets:
    - 192.168.8.1:8080
访问SpringBoot的metrics_path: /actuator/prometheus
http://192.168.8.1:8080/actuator/prometheus
