使用Prometheus监控Linux主机(agent)
1、node组件介绍
在远程linux主机(被监控端agent)上安装node_exporter组件。
2、安装node_exporter 下载地址
(1)上传软件包node_exporter-1.6.1.linux-amd64.tar.gz到Linux Agent服务器中
(2)解压安装node_exporter组件
//解压文件
[root@VM-8-2-centos local]# tar xf node_exporter-1.6.1.linux-amd64.tar.gz
//文件夹重命名
[root@VM-8-2-centos local]# mv node_exporter-1.6.1.linux-amd64 node_exporter
(3)启动运行
[root@VM-8-2-centos node_exporter]# nohup ./node_exporter &
[1] 16635
[root@VM-8-2-centos node_exporter]# nohup: ignoring input and appending output to ‘nohup.out’
[root@VM-8-2-centos node_exporter]# tail -f nohup.out
... ...
ts=2023-10-21T08:20:39.098Z caller=tls_config.go:274 level=info msg="Listening on" address=[::]:9100
ts=2023-10-21T08:20:39.098Z caller=tls_config.go:277 level=info msg="TLS is disabled." http2=false address=[::]:9100
3、查看端口是否启动
lsof -i:9100
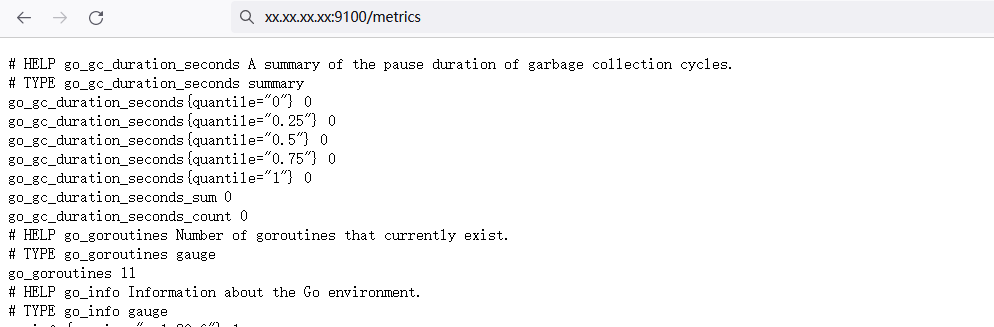
4、使用http://IP:9100/metrics 就可以获取node_exporter监控agent服务器的监控信息
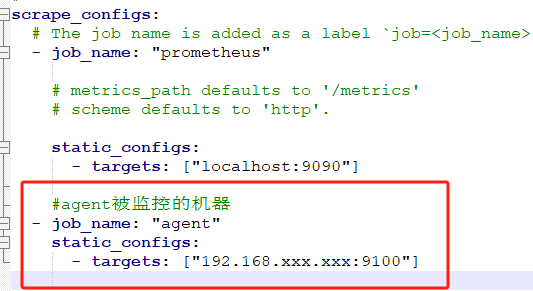
5、让prometheus监控可以拉取node节点信息,需要在prometheus.xml服务器配置文件添加监控机的配置信息
[root@server ~]# vim /usr/1ocal/prometheus/prometheus.yml
改完配置文件后,重启服务
[root@localhost prometheus]# pkill prometheus
[root@localhost prometheus]# Isof -i:9091 #查看端口没有进程占用 ,或者使用 ss -naltp | grep 9091
[root@localhost prometheus]# ./prometheus --config.file=prometheus.yml --web.listen-address=:9091 &
[root@localhost prometheus]# Isof -i:9091 # 确认端口被占用,说明重启成功
6、访问IP:9090 =》点Status =》点Targets=》可以看到两个监控目标

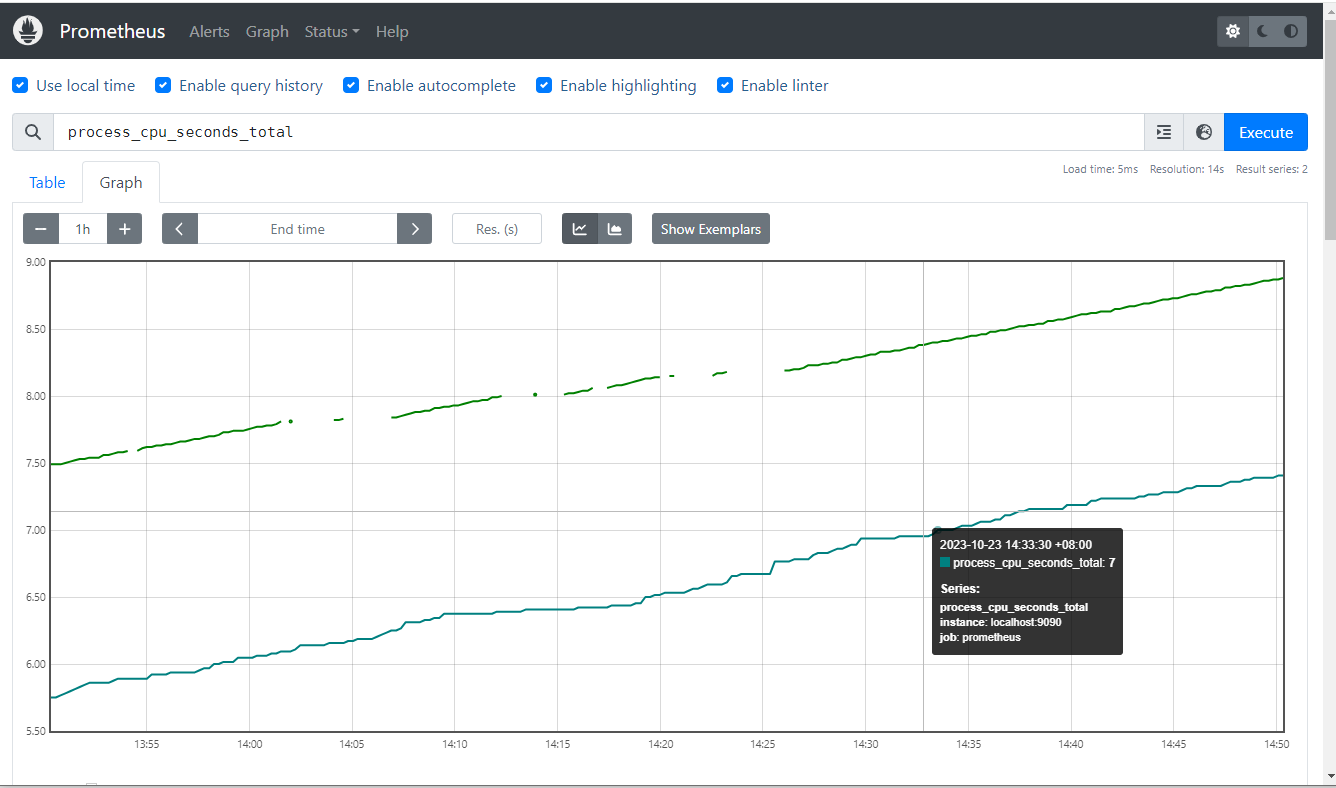
7、图像查看
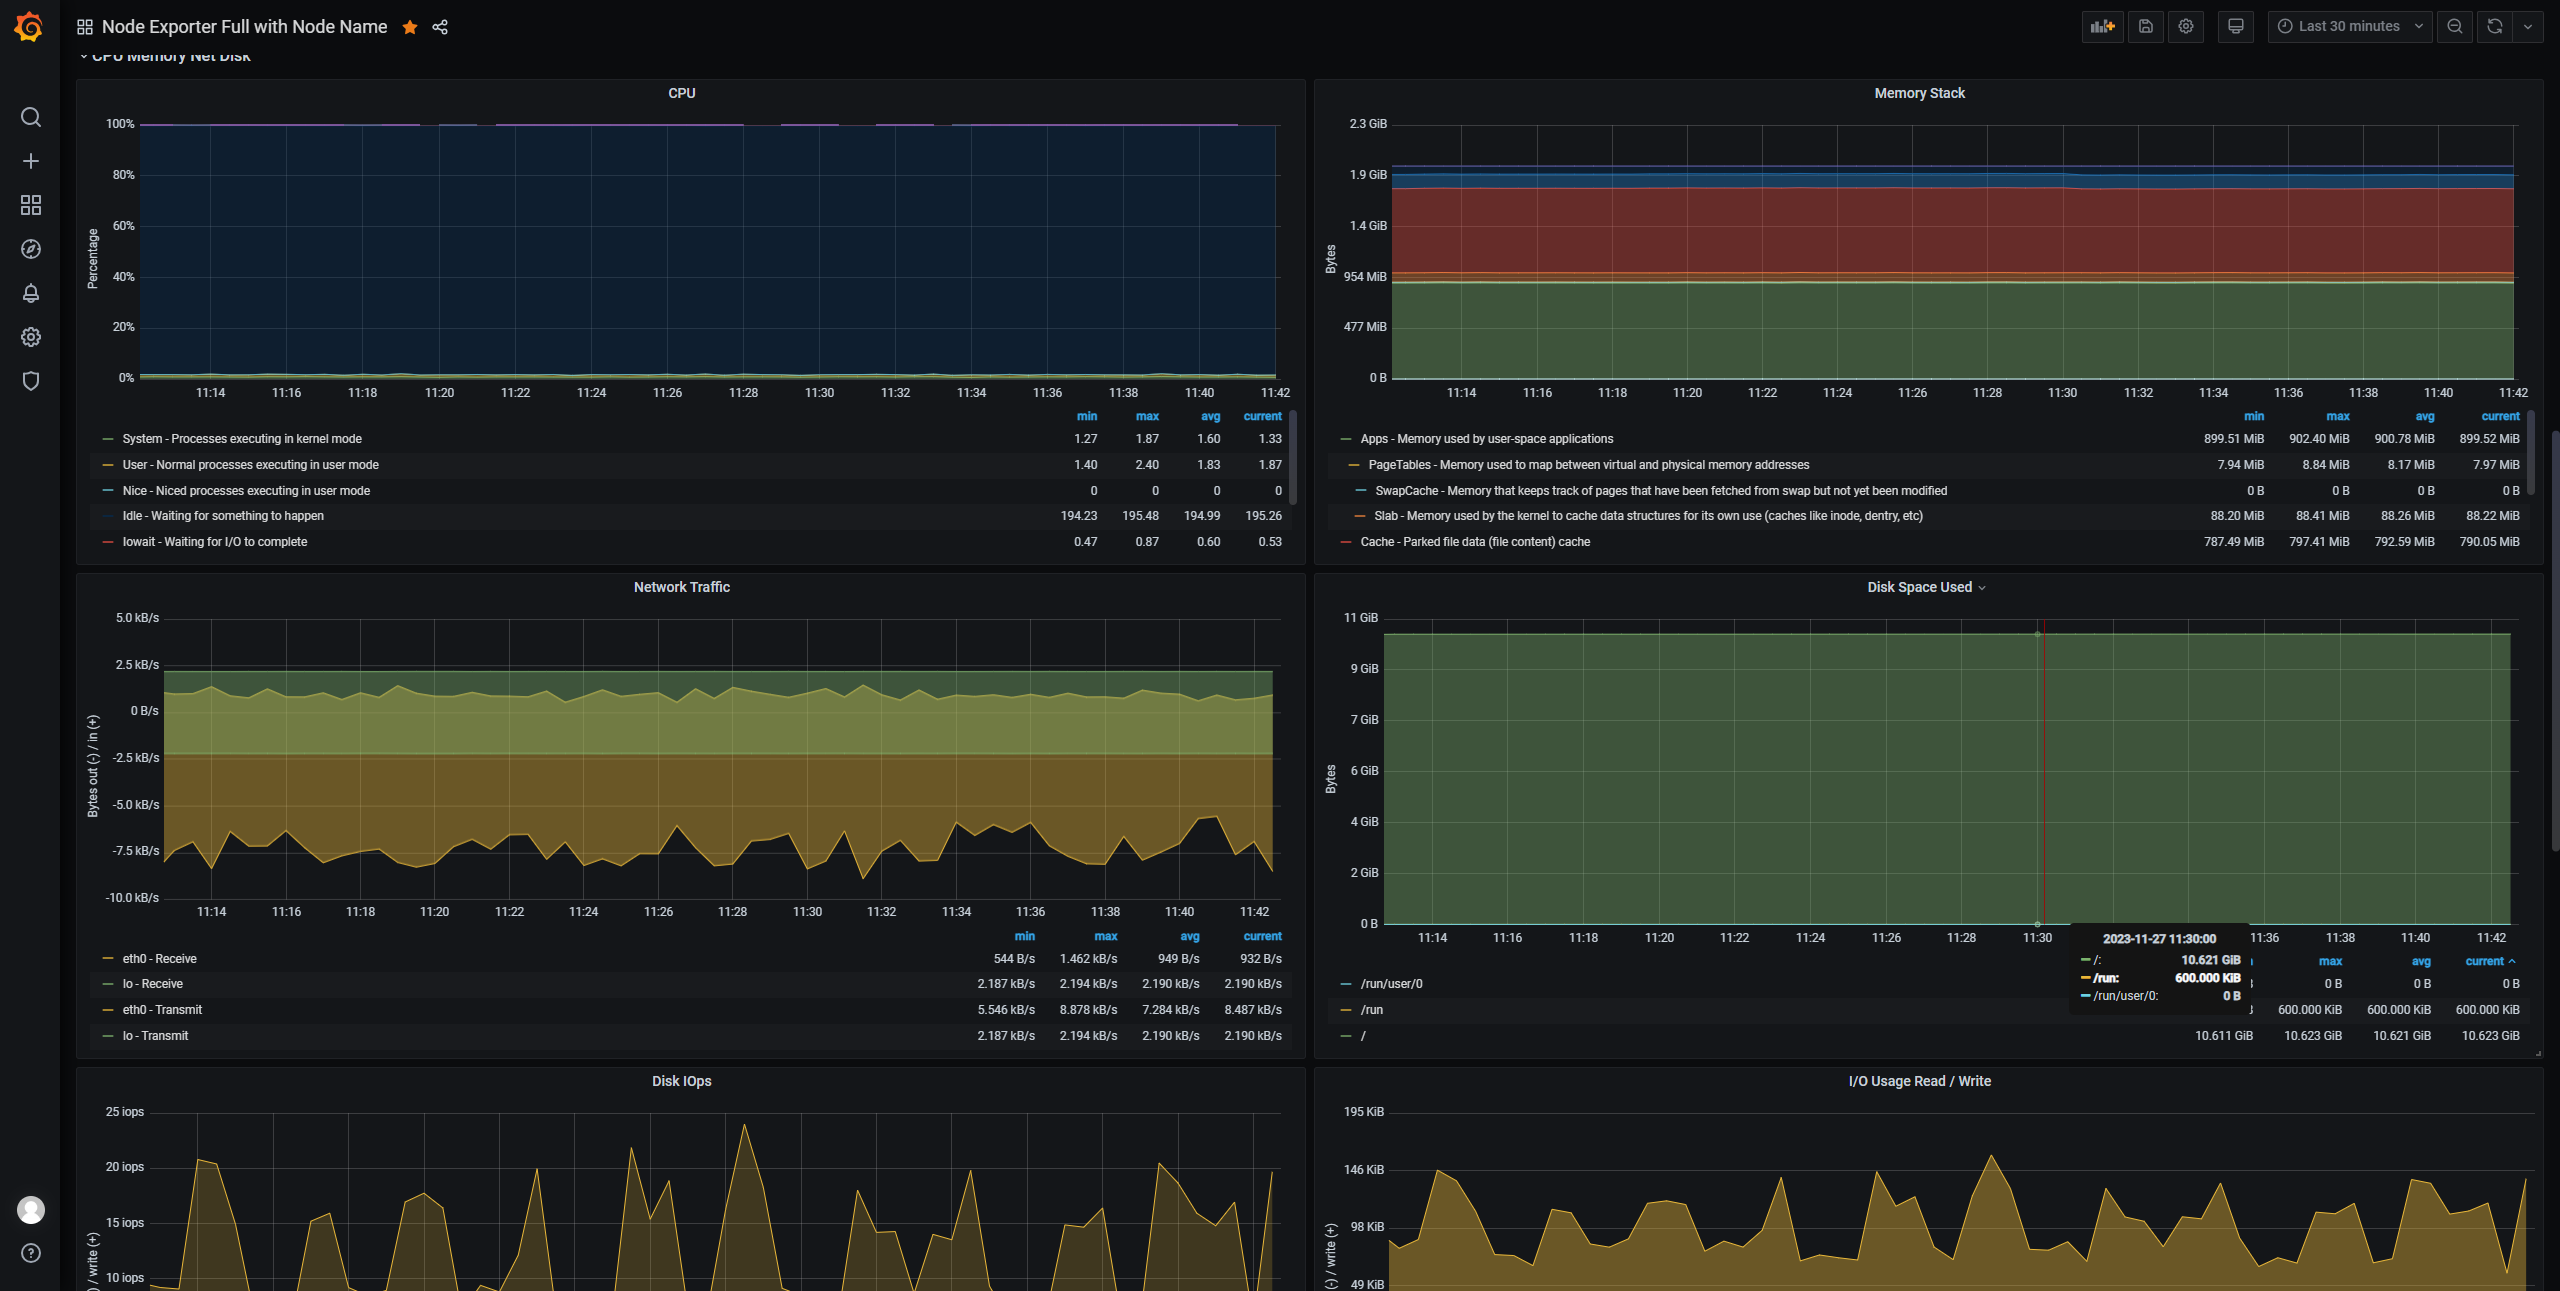
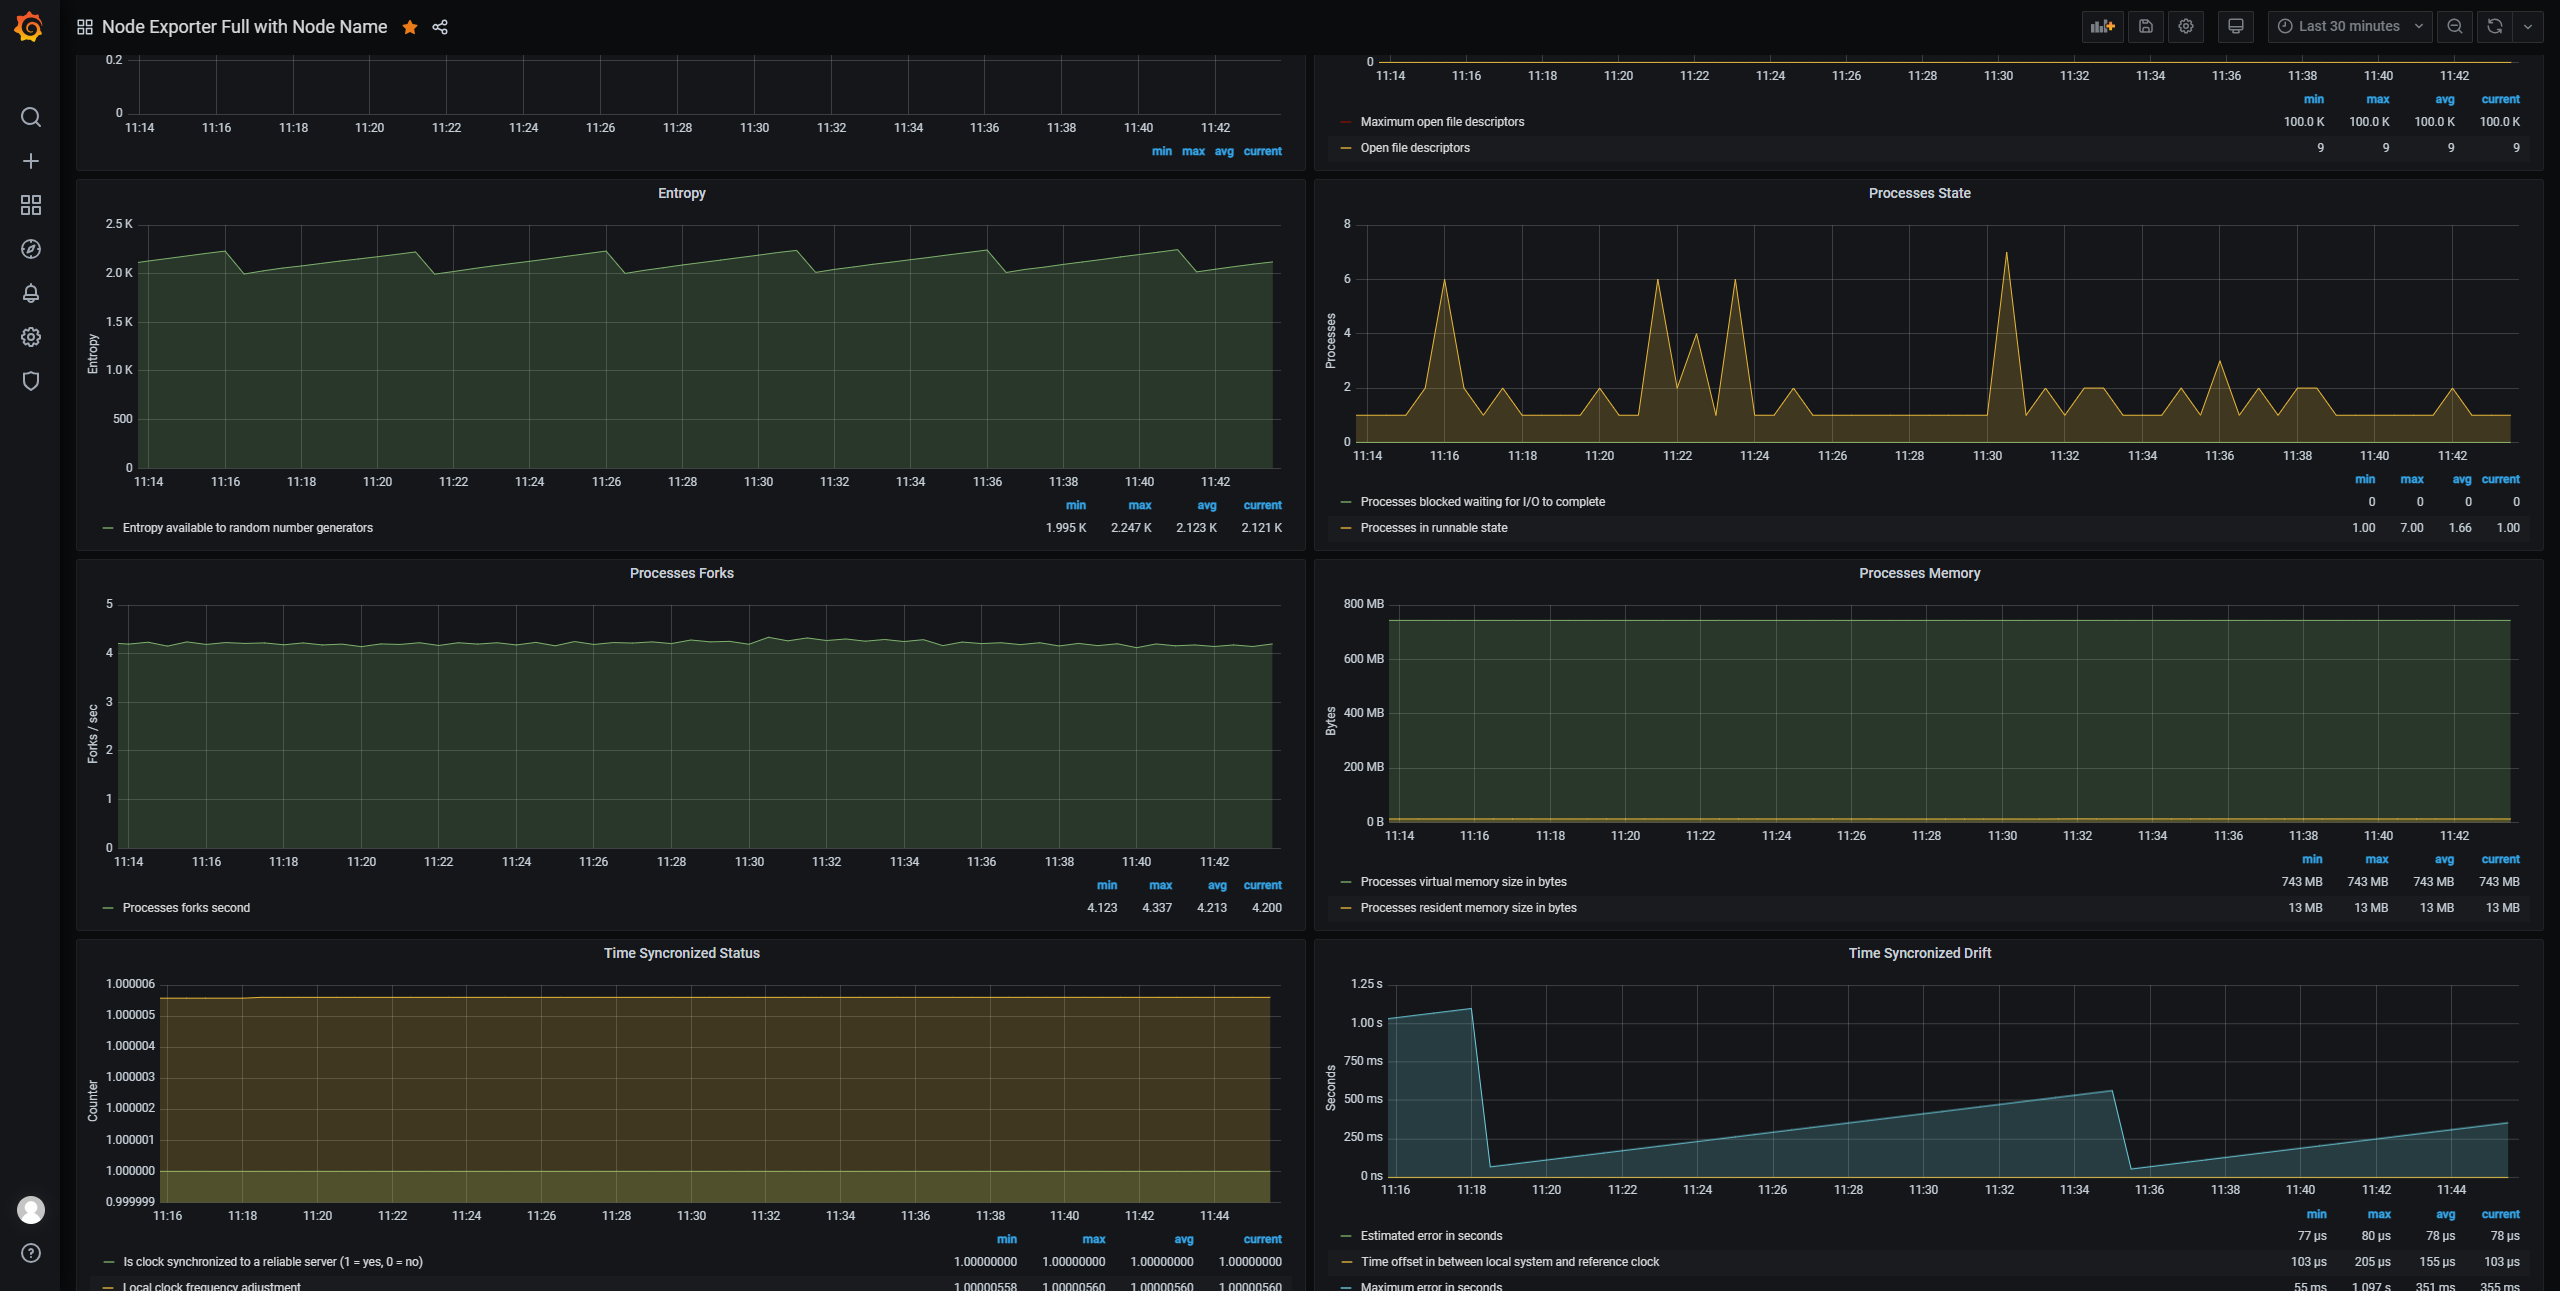
8、grafana-dashboards展示
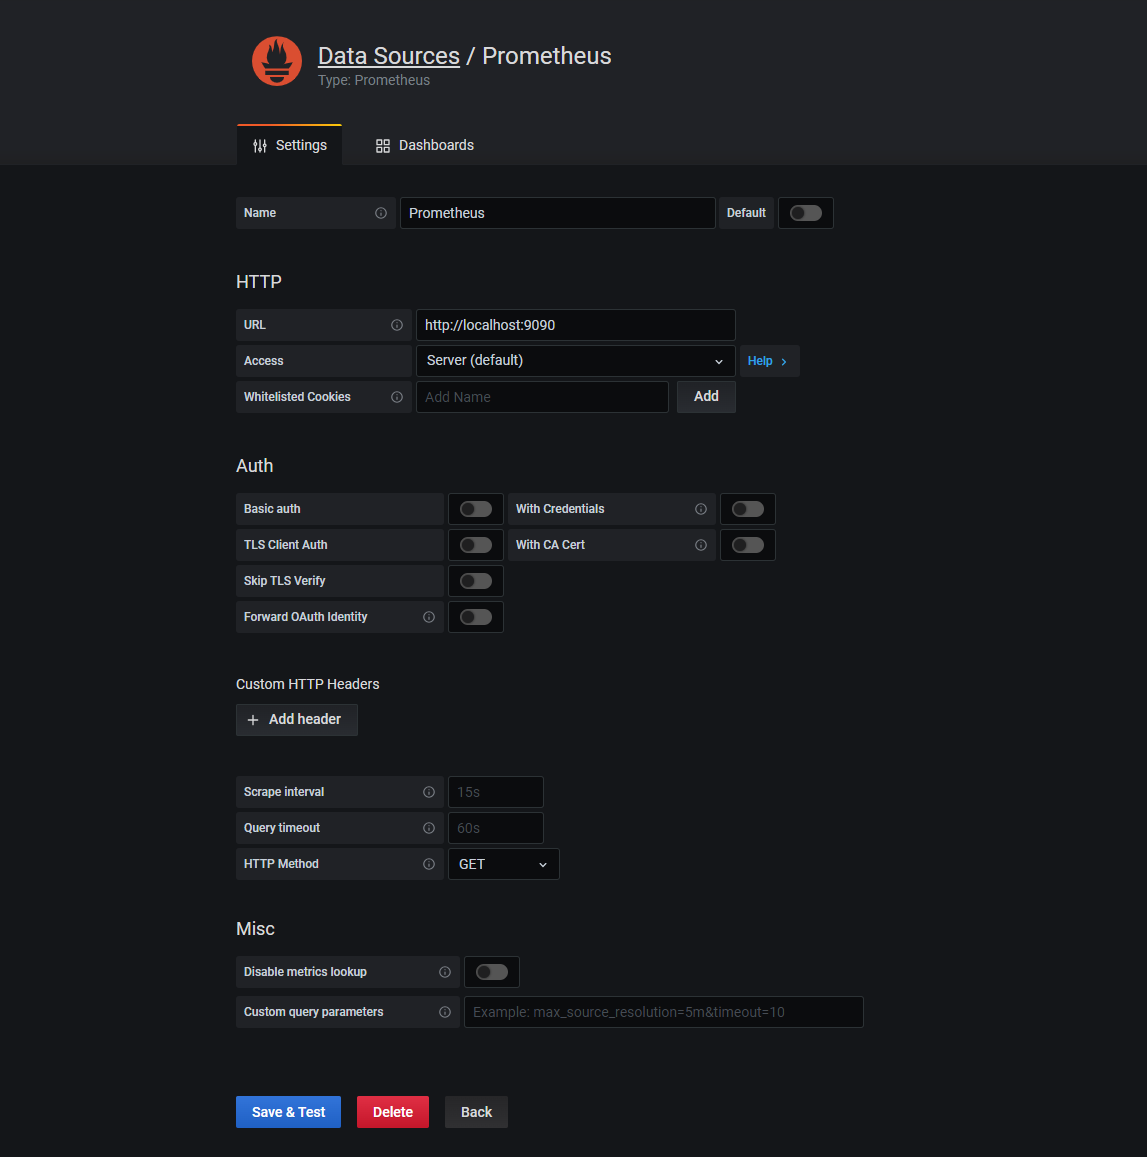
(1)首先配置Data Sources
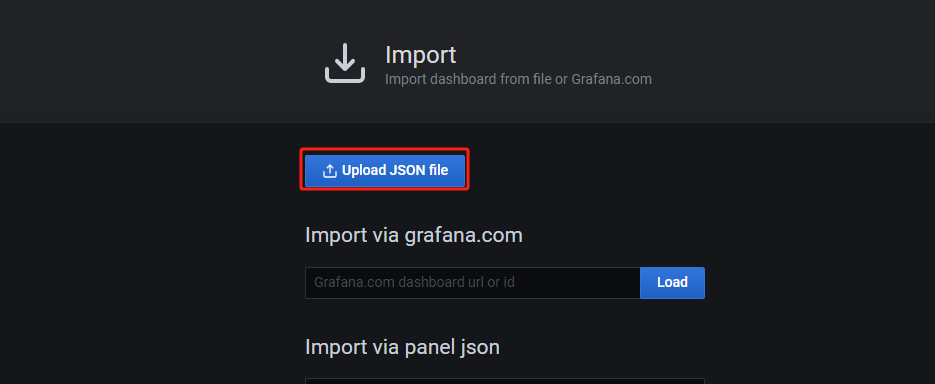
(2)导入json模板
(3)导入后