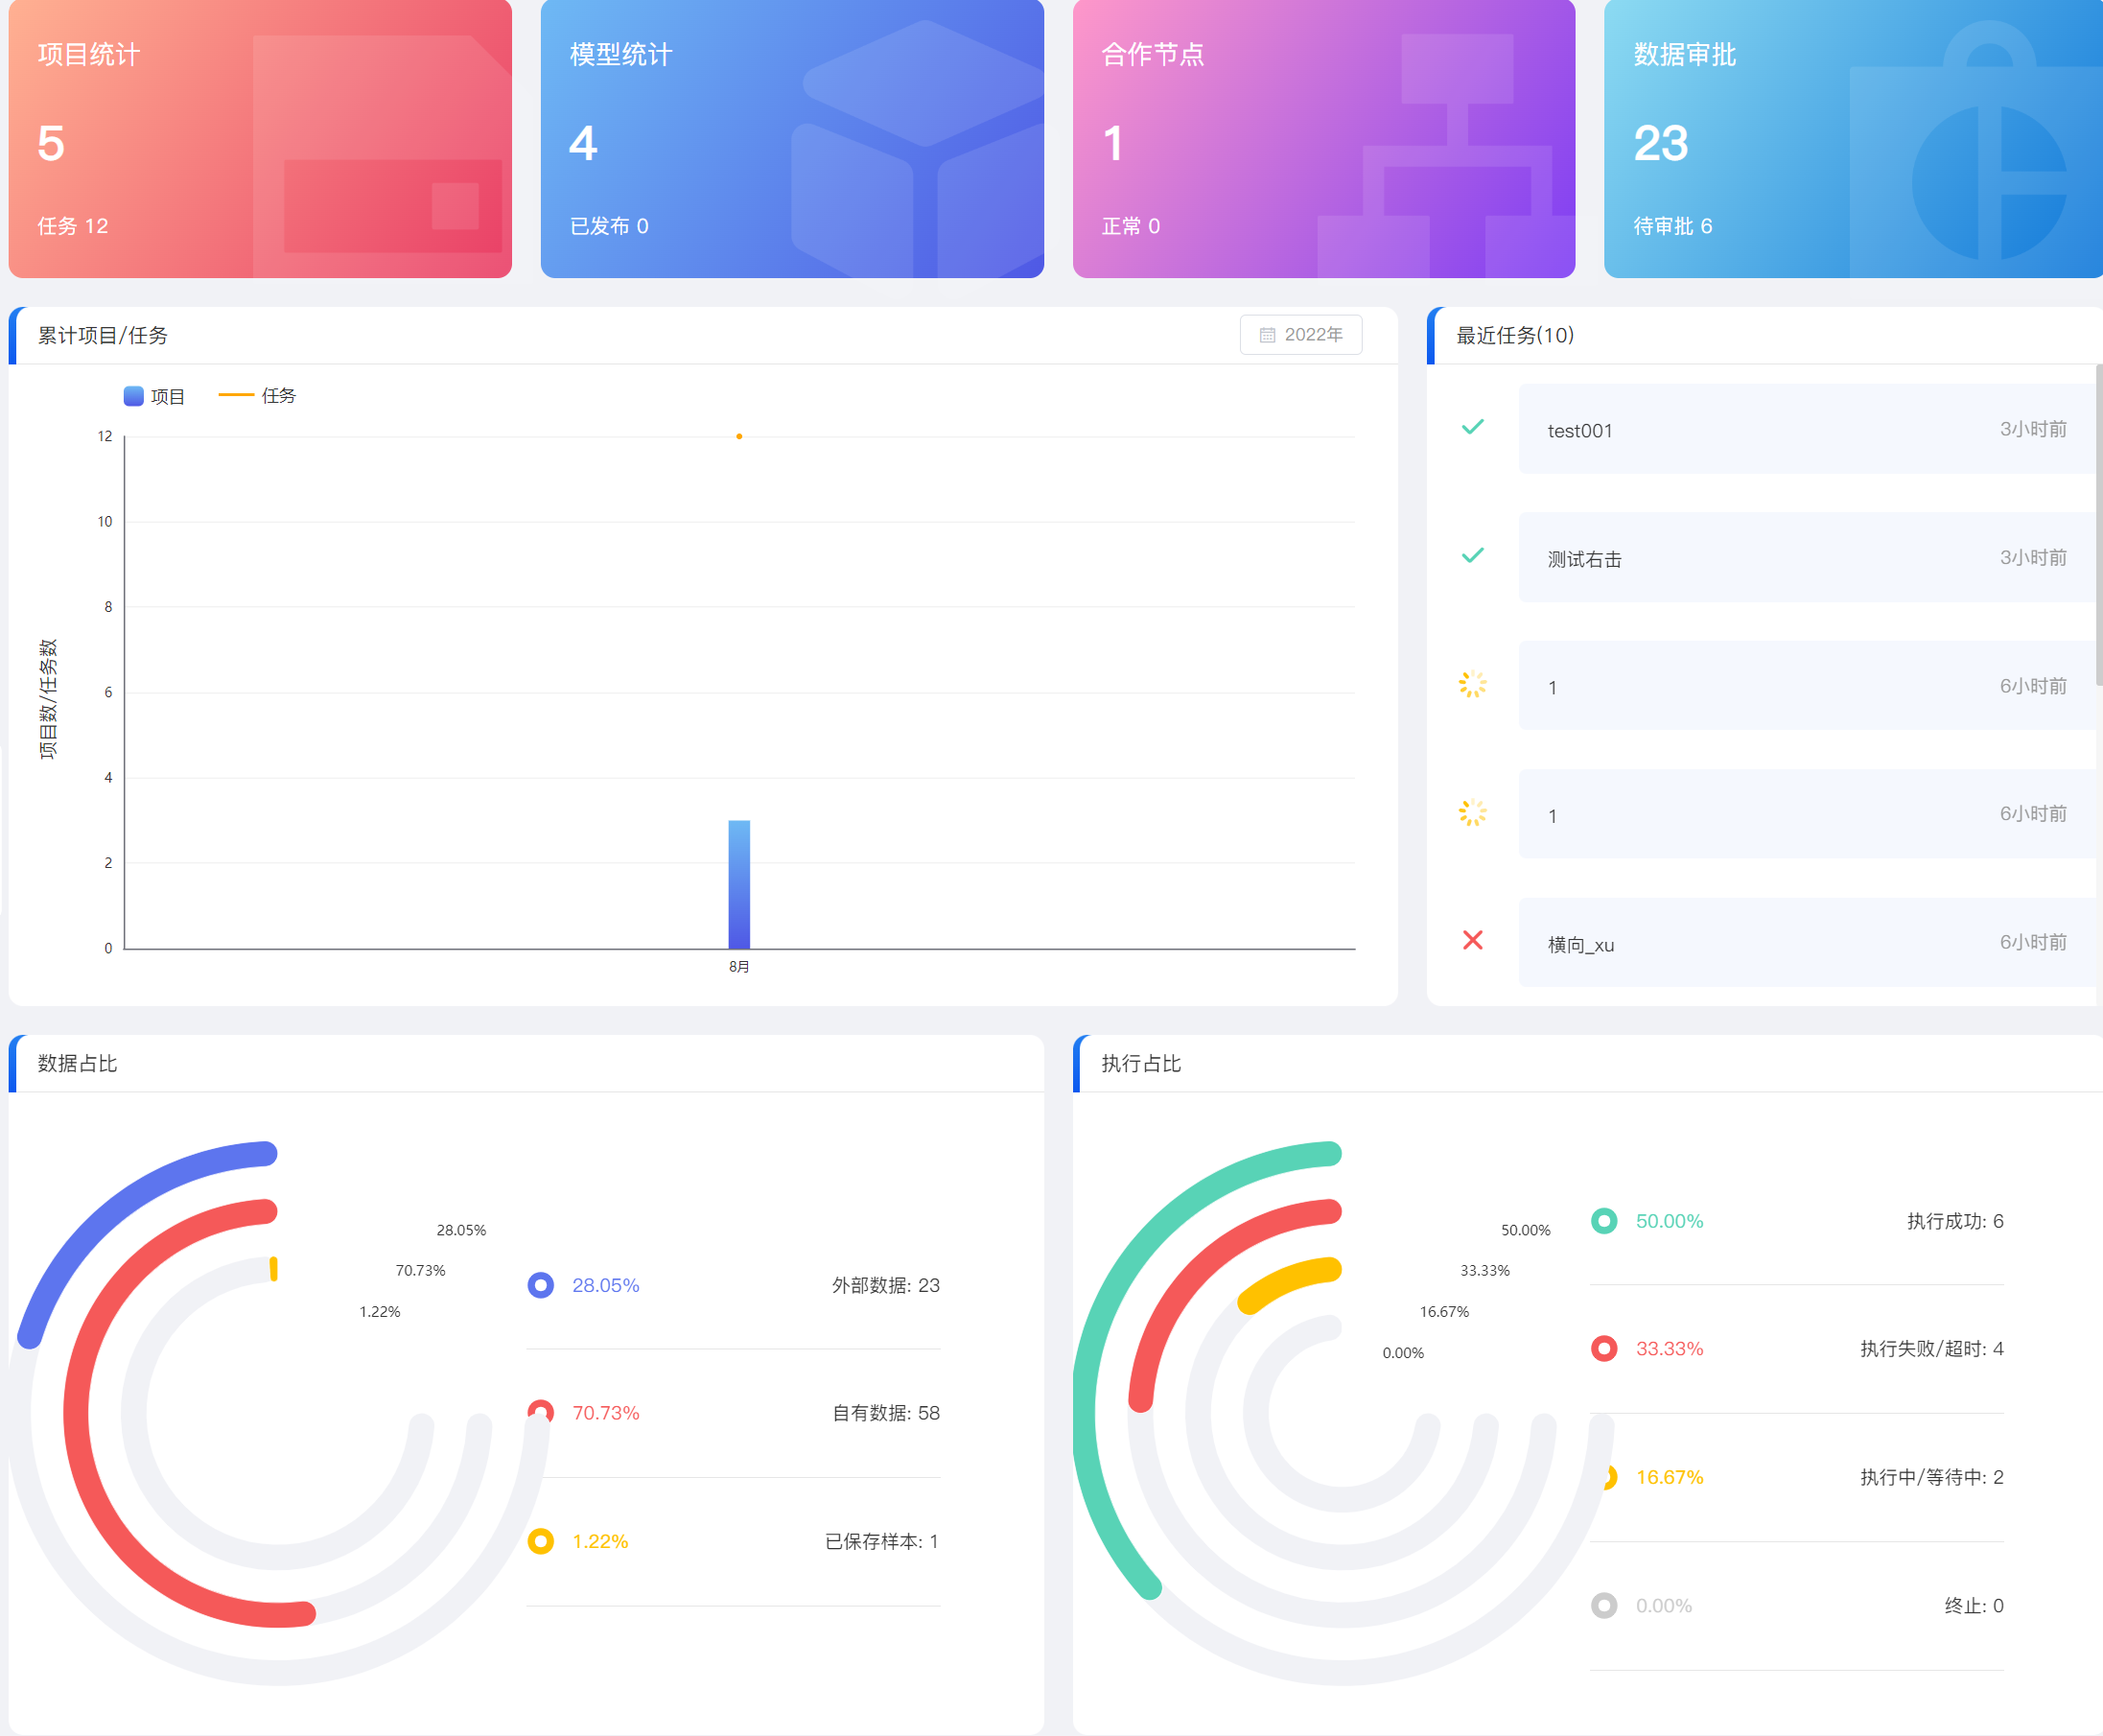
Echarts环状饼图
1,dataEcharts.vue
<template>
<div ref="chartDom" class="chartDom">
<div class="content">
<div class="items">
<div class="line">
<div class="left">
<svg
t="1660386028503"
class="icon"
viewBox="0 0 1024 1024"
version="1.1"
xmlns="http://www.w3.org/2000/svg"
p-id="10038"
width="20"
height="20"
>
<path
d="M512 298.656l0 0c119.456 0 213.344 93.856 213.344 213.344s-93.856 213.344-213.344 213.344c-119.456 0-213.344-93.856-213.344-213.344s93.856-213.344 213.344-213.344zM512 42.656c-258.144 0-469.344 211.2-469.344 469.344s211.2 469.344 469.344 469.344c258.144 0 469.344-211.2 469.344-469.344s-211.2-469.344-469.344-469.344l0 0z"
p-id="10039"
fill="#5D75EE"
></path>
</svg>
<div class="percent1">{{ dataOfData.external_ratio || "0%" }}</div>
</div>
<div class="right">
外部数据: {{ dataOfData.external_sample || 0 }}
</div>
</div>
<div class="line">
<div class="left">
<svg
t="1660386028503"
class="icon"
viewBox="0 0 1024 1024"
version="1.1"
xmlns="http://www.w3.org/2000/svg"
p-id="10038"
width="20"
height="20"
>
<path
d="M512 298.656l0 0c119.456 0 213.344 93.856 213.344 213.344s-93.856 213.344-213.344 213.344c-119.456 0-213.344-93.856-213.344-213.344s93.856-213.344 213.344-213.344zM512 42.656c-258.144 0-469.344 211.2-469.344 469.344s211.2 469.344 469.344 469.344c258.144 0 469.344-211.2 469.344-469.344s-211.2-469.344-469.344-469.344l0 0z"
p-id="10039"
fill="#F55959"
></path>
</svg>
<div class="percent2">{{ dataOfData.own_ratio || "0%" }}</div>
</div>
<div class="right">自有数据: {{ dataOfData.own_sample || 0 }}</div>
</div>
<div class="line">
<div class="left">
<svg
t="1660386028503"
class="icon"
viewBox="0 0 1024 1024"
version="1.1"
xmlns="http://www.w3.org/2000/svg"
p-id="10038"
width="20"
height="20"
>
<path
d="M512 298.656l0 0c119.456 0 213.344 93.856 213.344 213.344s-93.856 213.344-213.344 213.344c-119.456 0-213.344-93.856-213.344-213.344s93.856-213.344 213.344-213.344zM512 42.656c-258.144 0-469.344 211.2-469.344 469.344s211.2 469.344 469.344 469.344c258.144 0 469.344-211.2 469.344-469.344s-211.2-469.344-469.344-469.344l0 0z"
p-id="10039"
fill="#FFC100"
></path>
</svg>
<div class="percent3">{{ dataOfData.v_ratio || "0%" }}</div>
</div>
<div class="right">已保存样本: {{ dataOfData.v_sample || 0 }}</div>
</div>
</div>
</div>
</div>
</template>
<script>
export default {
name: "dataEcharts",
props: {
dataOfData: {
type: Object,
default: function () {
return {};
},
},
},
watch: {
dataOfData: {
immediate: false,
handler(newV) {
let chartData = [
{
label: "外部数据",
value: newV.external_sample || 0,
ratio: newV.external_ratio || "0%",
},
{
label: "自有数据",
value: newV.own_sample || 0,
ratio: newV.own_ratio || "0%",
},
{
label: "已保存样本",
value: newV.v_sample || 0,
ratio: newV.v_ratio || "0%",
},
];
console.log(chartData);
this.$nextTick(() => {
this.chartInstance && this.initData(chartData);
});
},
},
},
data() {
return {
chartInstance: null,
};
},
components: {},
methods: {
initData(chartData) {
let color = ["#5D75EE", "#F55959", "#FFC100", "#58D3B6", "#CCCCCC"];
let sum = 0;
chartData.forEach((item) => {
item.name = item.label || item.name;
sum += Number(item.value);
});
let arrValue = getArrayValue(chartData, "value");
let sumValue = eval(arrValue.join("+"));
let optionData = getData(chartData);
function getArrayValue(array, key) {
var key = key || "value";
var res = [];
if (array) {
array.forEach((t) => {
res.push(t[key]);
});
}
return res;
}
function getData(chartData) {
var res = {
series: [],
yAxis: [],
};
for (let i = 0; i < chartData.length; i++) {
res.series.push({
name: chartData[i].name,
type: "pie",
clockWise: false, //顺时加载
hoverAnimation: false, //鼠标移入变大
legendHoverLink: true,
radius: [85 - i * 18 + "%", 77 - i * 18 + "%"],
center: ["26%", "50%"],
label: {
show: false,
},
itemStyle: {
borderRadius: 20,
borderColor: "#fff",
borderWidth: 0.5,
},
data: [
{
value: chartData[i].value * 0.75,
name: chartData[i].name,
},
{
value: sumValue - chartData[i].value * 0.75,
name: "",
itemStyle: {
color: "rgba(0,0,0,0)",
borderWidth: 0,
},
hoverAnimation: false,
},
],
});
res.series.push({
name: "",
type: "pie",
silent: true,
z: 1,
clockWise: false, //顺时加载
hoverAnimation: true, //鼠标移入变大
radius: [85 - i * 18 + "%", 77 - i * 18 + "%"],
center: ["26%", "50%"],
itemStyle: {
borderRadius: 20,
borderColor: "#fff",
borderWidth: 0.5,
},
label: {
show: false,
},
data: [
{
value: 7.5,
itemStyle: {
color: "#F1F2F6",
borderWidth: 0,
},
tooltip: {
show: false,
},
hoverAnimation: false,
},
{
value: 2.5,
name: "",
itemStyle: {
color: "rgba(0,0,0,0)",
borderWidth: 0,
},
tooltip: {
show: false,
},
hoverAnimation: false,
},
],
});
res.yAxis.push(
((chartData[i].value / sumValue) * 100).toFixed(2) + "%"
);
}
// 增加雷达图
res.series.push({
name: "雷达图",
type: "radar",
symbolSize: 0,
lineStyle: {
color: "none",
},
data: [
{
value: [1000, 1000, 1000, 1000, 1000, 1000, 1000, 6],
label: {
show: true,
fontSize: "10px",
color: "#333333",
formatter: function () {
return chartData[2]?.ratio;
},
position: "inside",
},
},
{
value: [1000, 1000, 1000, 1000, 1000, 1000, 1000, 8.4],
label: {
show: true,
color: "#333333",
fontSize: "10px",
formatter: function () {
return chartData[1]?.ratio;
},
position: "inside",
},
},
{
value: [1000, 1000, 1000, 1000, 1000, 1000, 1000, 10.8],
label: {
show: true,
fontSize: "10px",
color: "#333333",
formatter: function () {
return chartData[0]?.ratio;
},
position: "inside",
},
},
],
});
return res;
}
let option = {
tooltip: {
formatter: (params) => {
if (params.name != "") {
return (
params.name +
" : " +
params.value / 0.75 +
"\n" +
"(" +
(params.percent / 0.75).toFixed(2) +
"%)"
);
}
},
},
// 雷达图
radar: {
center: ["26%", "50%"],
indicator: [
{ max: 10 },
{ max: 10 },
{ max: 10 },
{ max: 10 },
{ max: 10 },
{ max: 10 },
{ max: 10 },
{ max: 10 },
],
splitLine: {
show: false,
},
splitArea: {
show: false,
},
axisLabel: {
show: false,
},
axisLine: {
show: false,
},
},
color: color,
xAxis: [
{
show: false,
},
],
series: optionData.series,
};
this.chartInstance.setOption(option, true);
},
// 重置画布
chartResize() {
this.$nextTick(() => {
this.chartInstance && this.chartInstance.resize();
});
},
},
mounted() {
this.chartInstance = this.$echarts.init(this.$refs.chartDom, null, {
renderer: "svg",
});
window.addEventListener("resize", this.chartResize);
},
beforeUnmount() {
window.removeEventListener("resize", this.chartResize);
this.chartInstance.dispose();
},
};
</script>
<style scoped lang="scss">
.chartDom {
width: 100%;
height: 100%;
overflow: hidden;
position: relative;
}
.content {
position: absolute;
height: 100%;
width: 40%;
right: 10%;
color: #333333;
display: flex;
flex-direction: column;
justify-content: center;
.items {
height: 80%;
width: 100%;
display: flex;
flex-direction: column;
justify-content: center;
.line {
height: 25%;
width: 100%;
border-bottom: 1px solid #e6e6e6;
box-sizing: border-box;
display: flex;
align-items: center;
justify-content: space-between;
.left {
display: flex;
align-items: center;
.percent1 {
margin-left: 12px;
color: #5d75ee;
font-weight: 500;
}
.percent2 {
margin-left: 12px;
color: #f55959;
font-weight: 500;
}
.percent3 {
margin-left: 12px;
color: #ffc100;
font-weight: 500;
}
}
.right {
color: #333333;
}
}
}
}
</style>
2,executionEcharts.vue
<template>
<div ref="chartDom" class="chartDom">
<div class="content">
<div class="items">
<div class="line">
<div class="left">
<svg
t="1660386028503"
class="icon"
viewBox="0 0 1024 1024"
version="1.1"
xmlns="http://www.w3.org/2000/svg"
p-id="10038"
width="20"
height="20"
>
<path
d="M512 298.656l0 0c119.456 0 213.344 93.856 213.344 213.344s-93.856 213.344-213.344 213.344c-119.456 0-213.344-93.856-213.344-213.344s93.856-213.344 213.344-213.344zM512 42.656c-258.144 0-469.344 211.2-469.344 469.344s211.2 469.344 469.344 469.344c258.144 0 469.344-211.2 469.344-469.344s-211.2-469.344-469.344-469.344l0 0z"
p-id="10039"
fill="#58D3B6"
></path>
</svg>
<div class="percent1">
{{ executionData.success_ratio || "0%" }}
</div>
</div>
<div class="right">
执行成功: {{ executionData.success_num || 0 }}
</div>
</div>
<div class="line">
<div class="left">
<svg
t="1660386028503"
class="icon"
viewBox="0 0 1024 1024"
version="1.1"
xmlns="http://www.w3.org/2000/svg"
p-id="10038"
width="20"
height="20"
>
<path
d="M512 298.656l0 0c119.456 0 213.344 93.856 213.344 213.344s-93.856 213.344-213.344 213.344c-119.456 0-213.344-93.856-213.344-213.344s93.856-213.344 213.344-213.344zM512 42.656c-258.144 0-469.344 211.2-469.344 469.344s211.2 469.344 469.344 469.344c258.144 0 469.344-211.2 469.344-469.344s-211.2-469.344-469.344-469.344l0 0z"
p-id="10039"
fill="#F55959"
></path>
</svg>
<div class="percent2">
{{ executionData.failed_and_time_out_ratio || "0%" }}
</div>
</div>
<div class="right">
执行失败/超时: {{ executionData.failed_and_time_out_num || 0 }}
</div>
</div>
<div class="line">
<div class="left">
<svg
t="1660386028503"
class="icon"
viewBox="0 0 1024 1024"
version="1.1"
xmlns="http://www.w3.org/2000/svg"
p-id="10038"
width="20"
height="20"
>
<path
d="M512 298.656l0 0c119.456 0 213.344 93.856 213.344 213.344s-93.856 213.344-213.344 213.344c-119.456 0-213.344-93.856-213.344-213.344s93.856-213.344 213.344-213.344zM512 42.656c-258.144 0-469.344 211.2-469.344 469.344s211.2 469.344 469.344 469.344c258.144 0 469.344-211.2 469.344-469.344s-211.2-469.344-469.344-469.344l0 0z"
p-id="10039"
fill="#FFC100"
></path>
</svg>
<div class="percent3">
{{ executionData.running_waitint_ratio || "0%" }}
</div>
</div>
<div class="right">
执行中/等待中: {{ executionData.running_waitint_num || 0 }}
</div>
</div>
<div class="line">
<div class="left">
<svg
t="1660386028503"
class="icon"
viewBox="0 0 1024 1024"
version="1.1"
xmlns="http://www.w3.org/2000/svg"
p-id="10038"
width="20"
height="20"
>
<path
d="M512 298.656l0 0c119.456 0 213.344 93.856 213.344 213.344s-93.856 213.344-213.344 213.344c-119.456 0-213.344-93.856-213.344-213.344s93.856-213.344 213.344-213.344zM512 42.656c-258.144 0-469.344 211.2-469.344 469.344s211.2 469.344 469.344 469.344c258.144 0 469.344-211.2 469.344-469.344s-211.2-469.344-469.344-469.344l0 0z"
p-id="10039"
fill="#CCCCCC"
></path>
</svg>
<div class="percent4">{{ executionData.cannel_ratio || "0%" }}</div>
</div>
<div class="right">终止: {{ executionData.cannel_num || 0 }}</div>
</div>
</div>
</div>
</div>
</template>
<script>
export default {
name: "echarts",
props: {
executionData: {
type: Object,
default: function () {
return {};
},
},
},
watch: {
executionData: {
immediate: false,
handler(newV) {
let chartData = [
{
label: "执行成功",
value: newV.success_num || 0,
ratio: newV.success_ratio || "0%",
},
{
label: "执行失败/超时",
value: newV.failed_and_time_out_num || 0,
ratio: newV.failed_and_time_out_ratio || "0%",
},
{
label: "执行中/等待中",
value: newV.running_waitint_num || 0,
ratio: newV.running_waitint_ratio || "0%",
},
{
label: "终止",
value: newV.cannel_num || 0,
ratio: newV.cannel_ratio || "0%",
},
];
this.$nextTick(() => {
this.chartInstance && this.initData(chartData);
});
},
},
},
data() {
return {
chartInstance: null,
};
},
components: {},
methods: {
initData(chartData) {
let color = ["#58D3B6", "#F55959", "#FFC100", "#CCCCCC"];
let sum = 0;
chartData.forEach((item) => {
item.name = item.label || item.name;
sum += Number(item.value);
});
let arrValue = getArrayValue(chartData, "value");
let sumValue = eval(arrValue.join("+"));
let optionData = getData(chartData);
function getArrayValue(array, key) {
var key = key || "value";
var res = [];
if (array) {
array.forEach((t) => {
res.push(t[key]);
});
}
return res;
}
function getData(chartData) {
var res = {
series: [],
yAxis: [],
};
for (let i = 0; i < chartData.length; i++) {
res.series.push({
name: chartData[i].name,
type: "pie",
clockWise: false, //顺时加载
hoverAnimation: false, //鼠标移入变大
legendHoverLink: true,
radius: [85 - i * 18 + "%", 77 - i * 18 + "%"],
center: ["26%", "50%"],
label: {
show: false,
},
itemStyle: {
borderRadius: 20,
borderColor: "#fff",
borderWidth: 0.5,
},
data: [
{
value: chartData[i].value * 0.75,
name: chartData[i].name,
},
{
value: sumValue - chartData[i].value * 0.75,
name: "",
itemStyle: {
color: "rgba(0,0,0,0)",
borderWidth: 0,
},
hoverAnimation: false,
},
],
});
res.series.push({
name: "",
type: "pie",
silent: true,
z: 1,
clockWise: false, //顺时加载
hoverAnimation: true, //鼠标移入变大
radius: [85 - i * 18 + "%", 77 - i * 18 + "%"],
center: ["26%", "50%"],
itemStyle: {
borderRadius: 20,
borderColor: "#fff",
borderWidth: 0.5,
},
label: {
show: false,
},
data: [
{
value: 7.5,
itemStyle: {
color: "#F1F2F6",
borderWidth: 0,
},
tooltip: {
show: false,
},
hoverAnimation: false,
},
{
value: 2.5,
name: "",
itemStyle: {
color: "rgba(0,0,0,0)",
borderWidth: 0,
},
tooltip: {
show: false,
},
hoverAnimation: false,
},
],
});
res.yAxis.push(
((chartData[i].value / sumValue) * 100).toFixed(2) + "%"
);
}
res.series.push({
name: "雷达图",
type: "radar",
symbolSize: 0,
lineStyle: {
color: "none",
},
data: [
{
value: [1000, 1000, 1000, 1000, 1000, 1000, 1000, 3.6],
label: {
show: true,
fontSize: "10px",
color: "#333333",
formatter: function () {
return chartData[3]?.ratio;
},
position: "inside",
},
},
{
value: [1000, 1000, 1000, 1000, 1000, 1000, 1000, 6],
label: {
show: true,
fontSize: "10px",
color: "#333333",
formatter: function () {
return chartData[2]?.ratio;
},
position: "inside",
},
},
{
value: [1000, 1000, 1000, 1000, 1000, 1000, 1000, 8.4],
label: {
show: true,
color: "#333333",
fontSize: "10px",
formatter: function () {
return chartData[1]?.ratio;
},
position: "inside",
},
},
{
value: [1000, 1000, 1000, 1000, 1000, 1000, 1000, 10.8],
label: {
show: true,
fontSize: "10px",
color: "#333333",
formatter: function () {
return chartData[0]?.ratio;
},
position: "inside",
},
},
],
});
return res;
}
let option = {
tooltip: {
formatter: (params) => {
if (params.name != "") {
return (
params.name +
" : " +
params.value / 0.75 +
"\n" +
"(" +
(params.percent / 0.75).toFixed(2) +
"%)"
);
}
},
},
// 雷达图
radar: {
center: ["26%", "50%"],
indicator: [
{ max: 10 },
{ max: 10 },
{ max: 10 },
{ max: 10 },
{ max: 10 },
{ max: 10 },
{ max: 10 },
{ max: 10 },
],
splitLine: {
show: false,
},
splitArea: {
show: false,
},
axisLabel: {
show: false,
},
axisLine: {
show: false,
},
},
color: color,
grid: {
top: "5%",
bottom: "59%",
left: "26%",
containLabel: false,
},
xAxis: [
{
show: false,
},
],
series: optionData.series,
};
this.chartInstance.setOption(option, true);
},
// 重置画布
chartResize() {
this.$nextTick(() => {
this.chartInstance && this.chartInstance.resize();
});
},
},
mounted() {
this.chartInstance = this.$echarts.init(this.$refs.chartDom, null, {
renderer: "svg",
});
window.addEventListener("resize", this.chartResize);
},
beforeUnmount() {
window.removeEventListener("resize", this.chartResize);
this.chartInstance.dispose();
},
};
</script>
<style scoped lang="scss">
.chartDom {
width: 100%;
height: 100%;
overflow: hidden;
position: relative;
}
.content {
position: absolute;
height: 100%;
width: 40%;
right: 10%;
color: #333333;
display: flex;
flex-direction: column;
justify-content: center;
.items {
height: 80%;
width: 100%;
display: flex;
flex-direction: column;
justify-content: center;
.line {
height: 25%;
width: 100%;
border-bottom: 1px solid #e6e6e6;
box-sizing: border-box;
display: flex;
align-items: center;
justify-content: space-between;
.left {
display: flex;
align-items: center;
.percent1 {
margin-left: 12px;
color: #58d3b6;
font-weight: 500;
}
.percent2 {
margin-left: 12px;
color: #f55959;
font-weight: 500;
}
.percent3 {
margin-left: 12px;
color: #ffc100;
font-weight: 500;
}
.percent4 {
margin-left: 12px;
color: #cccccc;
font-weight: 500;
}
}
.right {
color: #333333;
}
}
}
}
</style>
3,projectEcharts.vue
<template>
<div ref="chartDom" class="chartDom">
<div class="title">项目数/任务数</div>
</div>
</template>
<script>
import _ from "lodash";
export default {
name: "echarts",
props: {
projectData: {
type: Object,
default: function () {
return {};
},
},
},
watch: {
projectData: {
immediate: false,
handler(newV) {
// if (_.isEmpty(newV)) return;
let dataAxis = [];
let barData = [];
let lineData = [];
for (var i in newV) {
dataAxis.push(i + "月");
barData.push(newV[i]["project_num"]);
lineData.push(newV[i]["job_num"]);
}
this.$nextTick(() => {
this.chartInstance && this.initData(dataAxis, barData, lineData);
});
},
},
},
data() {
return {
chartInstance: null,
};
},
components: {},
methods: {
initData(dataAxis, barData, lineData) {
const option = {
title: {
// text: "项目数/任务数",
subtext: "",
},
tooltip: {
trigger: "axis",
axisPointer: {
type: "shadow", // 'shadow' as default; can also be 'line' or 'shadow'
},
},
legend: [
{
left: 75,
top: 10,
data: ["项目"],
itemWidth: 14,
},
{
left: 140,
top: 10,
data: ["任务"],
itemStyle: {
opacity: 0,
},
},
],
grid: {
top: "50px",
bottom: "40px",
left: "80px",
right: "30px",
},
xAxis: {
data: dataAxis,
axisLabel: {
color: "#333333",
fontSize: "9px",
},
axisTick: {
show: false,
},
splitLine: {
show: true,
lineStyle: {
color: "#E6E6E6",
width: 0.5,
},
},
},
yAxis: {
axisLine: {
show: true,
},
splitLine: {
show: true,
lineStyle: {
color: "#E6E6E6",
width: 0.5,
},
},
axisTick: {
show: false,
},
axisLabel: {
color: "#333333",
fontSize: "9px",
},
},
dataZoom: [
{
type: "inside",
},
],
series: [
{
name: "项目",
type: "bar",
showBackground: false,
barWidth: 15, //柱图宽度
itemStyle: {
color: new this.$echarts.graphic.LinearGradient(0, 0, 0, 1, [
{ offset: 0, color: "#6EB9F4" },
{ offset: 1, color: "#4F58E5" },
]),
},
emphasis: {
itemStyle: {
color: new this.$echarts.graphic.LinearGradient(0, 0, 0, 1, [
{ offset: 0, color: "#4F58E5" },
{ offset: 1, color: "#6EB9F4" },
]),
},
focus: "series",
},
data: barData,
},
{
name: "任务",
type: "line",
lineStyle: {
color: "#FFA700",
},
itemStyle: {
color: "#FFA700",
},
emphasis: {
focus: "series",
},
symbol: "circle",
data: lineData,
},
],
};
// Enable data zoom when user click bar.
const zoomSize = 6;
this.chartInstance.on("click", (params) => {
this.chartInstance.dispatchAction({
type: "dataZoom",
startValue: dataAxis[Math.max(params.dataIndex - zoomSize / 2, 0)],
endValue:
dataAxis[
Math.min(params.dataIndex + zoomSize / 2, barData.length - 1)
],
});
});
this.chartInstance.setOption(option, true);
},
// 重置画布
chartResize() {
// debounce(() => {
this.$nextTick(() => {
this.chartInstance && this.chartInstance.resize();
});
// }, 100);
},
},
mounted() {
this.chartInstance = this.$echarts.init(this.$refs.chartDom, null, {
renderer: "svg",
});
// this.initData(); // 初始化
window.addEventListener("resize", this.chartResize);
},
beforeUnmount() {
window.removeEventListener("resize", this.chartResize);
this.chartInstance.dispose();
},
};
</script>
<style scoped lang="scss">
.chartDom {
width: 100%;
height: 100%;
overflow: hidden;
position: relative;
}
.title {
position: absolute;
left: -15px;
top: 50%;
color: #333333;
-webkit-transform: rotate(-90deg);
}
</style>
4,recenTask.vue
<template>
<section class="container">
<div class="item" v-for="(item, index) in recentData" :key="index">
<div class="icon">
<Icon
style="width: 20px; height: 20px"
:name="item.f_status | getIconByExecutionStatus"
/>
</div>
<div class="content">
<div class="left">
<TooltipWrap :text="item.job_name" />
</div>
<div class="right">
{{ item.format_time }}
<!-- {{ formatTime(new Date(item.format_time).valueOf()) }} -->
</div>
</div>
</div>
</section>
</template>
<script>
import { getIconByExecutionStatus } from "@/utils/filters.js";
export default {
name: "recentTask",
filters: { getIconByExecutionStatus },
data() {
return {
dataList: [{ status: "success" }],
};
},
props: {
recentData: {
type: Array,
default: [],
},
},
components: {},
watch: {},
created() {},
methods: {
/**
* @description: 时间格式化(例如刚刚、一分钟前、一小时前等格式化日期)
* @param {*} time 时间戳
* @return {*}
*/
// formatTime(time) {
// if (("" + time).length === 10) {
// time = parseInt(time) * 1000;
// } else {
// time = +time;
// }
// const d = new Date(time);
// const now = Date.now();
// const diff = (now - d) / 1000;
// if (diff < 30) {
// return "刚刚";
// } else if (diff < 3600) {
// return Math.ceil(diff / 60) + "分钟前";
// } else if (diff < 3600 * 24) {
// return Math.ceil(diff / 3600) + "小时前";
// } else if (diff < 3600 * 24 * 2) {
// return "1天前";
// } else if (diff < 3600 * 24 * 3) {
// return "2天前";
// } else if (diff < 3600 * 24 * 4) {
// return "3天前";
// }
// return (
// d.getFullYear() +
// "-" +
// (d.getMonth() + 1 < 10 ? "0" + d.getMonth() + 1 : d.getMonth() + 1) +
// "-" +
// (d.getDate() < 10 ? "0" + d.getDate() : d.getDate()) +
// " " +
// (d.getHours() < 10 ? "0" + d.getHours() : d.getHours()) +
// ":" +
// (d.getMinutes() < 10 ? "0" + d.getMinutes() : d.getMinutes()) +
// ":" +
// (d.getSeconds() < 10 ? "0" + d.getSeconds() : d.getSeconds())
// );
// },
},
};
</script>
<style scoped lang="scss">
.container {
height: 100%;
width: 100%;
overflow-y: auto;
.item {
display: flex;
flex-direction: row;
align-items: center;
width: 100%;
height: calc(100% / 5);
.icon {
width: 15%;
text-align: center;
}
.content {
border-radius: 5px 0 0 5px;
display: flex;
align-items: center;
justify-content: space-between;
padding: 0 20px;
width: 85%;
height: 70%;
background-color: rgba(60, 121, 242, 0.05);
.left {
color: #333333;
}
.right {
color: #999999;
width: 200px;
text-align: right;
}
}
}
}
</style>
5,index.vue
<template>
<section class="index">
<div class="container-box">
<el-row :gutter="20" class="row1">
<el-col :span="6">
<div class="row1_col1" @click="routerJump('project')">
<div class="line1">项目统计</div>
<div class="line2">
<countTo
:startVal="0"
:endVal="initData.project_statistics.total_project_num || 0"
:duration="3000"
></countTo>
</div>
<div class="line3">
任务
<countTo
:startVal="0"
:endVal="initData.project_statistics.total_job_num || 0"
:duration="3000"
></countTo>
</div>
<div class="backImg"></div>
</div>
</el-col>
<el-col :span="6">
<div class="row1_col2" @click="routerJump('model')">
<div class="line1">模型统计</div>
<div class="line2">
<countTo
:startVal="0"
:endVal="initData2.total_model_num || 0"
:duration="3000"
></countTo>
</div>
<div class="line3">
已发布
<countTo
:startVal="0"
:endVal="initData2.publish_num || 0"
:duration="3000"
></countTo>
</div>
<div class="backImg"></div>
</div>
</el-col>
<el-col :span="6">
<div class="row1_col3" @click="routerJump('node')">
<div class="line1">合作节点</div>
<div class="line2">
<countTo
:startVal="0"
:endVal="initData3.total_partys_num || 0"
:duration="3000"
></countTo>
</div>
<div class="line3">
正常
<countTo
:startVal="0"
:endVal="initData3.valid__partys_num || 0"
:duration="3000"
></countTo>
</div>
<div class="backImg"></div>
</div>
</el-col>
<el-col :span="6">
<div
class="row1_col4"
@click="routerJump('dataAssets/approval/index')"
>
<div class="line1">数据审批</div>
<div class="line2">
<countTo
:startVal="0"
:endVal="initData4.sample_statistics.sample_approve_num || 0"
:duration="3000"
></countTo>
</div>
<div class="line3">
待审批
<countTo
:startVal="0"
:endVal="initData4.sample_statistics.waitting_approve_num || 0"
:duration="3000"
></countTo>
</div>
<div class="backImg"></div>
</div>
</el-col>
</el-row>
<el-row :gutter="20" class="row2">
<el-col :span="16">
<div class="panel">
<div class="top-panel">
<div class="blue"></div>
<div class="white"></div>
<div class="title">累计项目/任务</div>
<div class="operating">
<el-date-picker
class="datePicker"
format="yyyy年"
value-format="yyyy"
size="mini"
:clearable="false"
v-model="selectYear"
type="year"
placeholder="选择年份"
></el-date-picker>
</div>
</div>
<div class="content-panel">
<projectEcharts
:projectData="initData.average_statistics[selectYear]"
/>
</div>
</div>
</el-col>
<el-col :span="8">
<div class="panel">
<div class="top-panel">
<div class="blue"></div>
<div class="white"></div>
<div class="title">
最近任务({{ initData.recent_statistics.length }})
</div>
</div>
<div class="content-panel">
<recentTask :recentData="initData.recent_statistics" />
</div>
</div>
</el-col>
</el-row>
<el-row :gutter="20" class="row3">
<el-col :span="12">
<div class="panel">
<div class="top-panel">
<div class="blue"></div>
<div class="white"></div>
<div class="title">数据占比</div>
</div>
<div class="content-panel">
<dataEcharts :dataOfData="initData4.sample_detail" />
</div>
</div>
</el-col>
<el-col :span="12">
<div class="panel">
<div class="top-panel">
<div class="blue"></div>
<div class="white"></div>
<div class="title">执行占比</div>
<div class="operating"></div>
</div>
<div class="content-panel">
<executionEcharts :executionData="initData.execute_statistics" />
</div>
</div>
</el-col>
</el-row>
</div>
</section>
</template>
<script>
import projectEcharts from "./components/projectEcharts.vue";
import recentTask from "./components/recentTask.vue";
import dataEcharts from "./components/dataEcharts.vue";
import executionEcharts from "./components/executionEcharts.vue";
import countTo from "vue-count-to";
import {
project_job_statistics_and_run,
model_statistics,
node_statistics,
sample_statistics_and_ratio,
} from "@/api/home";
export default {
name: "index",
data() {
return {
selectYear: new Date().getFullYear() + "", // 年份
initData: {
project_statistics: {
total_project_num: 0,
total_job_num: 0,
},
execute_statistics: {},
average_statistics: {},
recent_statistics: [],
}, // 累计项目/任务,执行占比统计,最近任务
initData2: {}, // 模型统计
initData3: {}, // 节点统计
initData4: { sample_detail: {}, sample_statistics: {} }, // 数据审批
};
},
components: {
projectEcharts,
recentTask,
dataEcharts,
executionEcharts,
countTo,
},
watch: {},
created() {
this.getData();
},
methods: {
/**
* @description: 获取首页数据
* @return {*}
*/
getData() {
// 累计项目/任务,执行占比统计,最近任务
project_job_statistics_and_run().then((res) => {
if (res.retcode != 0) return;
this.initData = res.data || {};
// this.initData = {
// average_statistics: {
// 2021: {
// 11: {
// job_num: 1,
// project_num: 1,
// },
// },
// 2022: {
// 6: {
// job_num: 1,
// project_num: 1,
// },
// 7: {
// job_num: 1,
// project_num: 1,
// },
// },
// },
// execute_statistics: {
// cannel_num: 0,
// cannel_ratio: "0%",
// failed_and_time_out_num: 2,
// failed_and_time_out_ratio: "66%",
// running_waitint_num: 0,
// running_waitint_ratio: "0%",
// success_num: 1,
// success_ratio: "33%",
// },
// project_statistics: {
// total_job_num: 3,
// total_project_num: 5,
// },
// recent_statistics: [
// {
// f_status: "failed",
// format_time: "2022-08-14 09:49:20",
// job_id: "job_id_2",
// job_name: " 画布1",
// },
// {
// f_status: "success",
// format_time: "2022-08-16 09:49:10",
// job_id: "job_id_1",
// job_name: " 画布2",
// },
// {
// f_status: "failed",
// format_time: "2021-11-01 01:50:07",
// job_id: "job_id_5",
// job_name: "画布3",
// },
// ],
// };
});
// 模型统计
model_statistics().then((res) => {
if (res.retcode != 0) return;
this.initData2 = res.data || {};
// this.initData2 = {
// publish_num: 2,
// total_model_num: 10,
// };
});
// 节点统计
node_statistics().then((res) => {
if (res.retcode != 0) return;
this.initData3 = res.data || {};
// this.initData3 = {
// total_partys_num: 3,
// valid__partys_num: 2,
// };
});
// 数据审批
sample_statistics_and_ratio().then((res) => {
if (res.retcode != 0) return;
this.initData4 = res.data || {};
// this.initData4 = {
// sample_detail: {
// external_ratio: "45%",
// external_sample: 78,
// own_ratio: "50%",
// own_sample: 87,
// v_ratio: "4%",
// v_sample: 7,
// },
// sample_statistics: {
// sample_approve_num: 78,
// waitting_approve_num: 2,
// },
// };
});
},
/**
* @description: 路由跳转
* @return {*}
*/
routerJump(path) {
this.$router.push({
path: path,
});
},
},
};
</script>
<style scoped lang="scss">
.container-box {
.panel {
height: calc((100vh - 130px - calc((100vh - 130px) * 1 / 6)) / 2);
min-height: 240px;
.top-panel {
width: 100%;
height: 40px;
position: relative;
background-color: #fff;
border-radius: 10px 10px 0 0;
border-bottom: 1px solid #e6e6e6;
box-sizing: border-box;
display: flex;
align-items: center;
.blue {
position: absolute;
left: 0;
top: 0;
width: 15px;
height: 40px;
background-image: linear-gradient(180deg, #237ff1, #0b58ef);
border-radius: 10px 0 0 0;
}
.white {
position: absolute;
left: 5px;
top: 0;
width: 10px;
height: 40px;
background-color: #ffffff;
border-radius: 10px 0 0 0;
border-bottom: 1px solid #e6e6e6;
box-sizing: border-box;
}
.title {
position: absolute;
color: #333333;
font-size: 14px;
left: 20px;
}
.operating {
position: absolute;
right: 20px;
.datePicker {
width: 85px;
height: 70%;
border-radius: 10px;
}
}
}
.content-panel {
height: calc(100% - 40px);
width: 100%;
background-color: #fff;
border-radius: 0 0 10px 10px;
}
}
.row1 {
.row1_col1 {
height: calc((100vh - 130px) * 1 / 6);
min-height: 110px;
background-image: linear-gradient(125deg, #ffb192, #e93e66);
border-radius: 10px;
color: #fff;
display: flex;
flex-direction: column;
justify-content: space-evenly;
padding: 0 20px;
position: relative;
cursor: pointer;
.line1 {
font-size: 18px;
font-weight: 500;
}
.line2 {
font-size: 32px;
font-weight: 800;
}
.line3 {
font-size: 14px;
}
.backImg {
position: absolute;
right: -15px;
bottom: -15px;
height: calc((100vh - 130px) * 1 / 6);
width: calc((100vh - 130px) * 1 / 6);
background-image: url("./png/home_pm.png");
background-size: 100% 100%;
}
}
.row1_col2 {
height: calc((100vh - 130px) * 1 / 6);
min-height: 110px;
background-image: linear-gradient(125deg, #6eb9f4, #4f58e5);
border-radius: 10px;
color: #fff;
display: flex;
flex-direction: column;
justify-content: space-evenly;
padding: 0 20px;
position: relative;
cursor: pointer;
.line1 {
font-size: 18px;
font-weight: 500;
}
.line2 {
font-size: 32px;
font-weight: 800;
}
.line3 {
font-size: 14px;
}
.backImg {
position: absolute;
right: -15px;
bottom: -15px;
height: calc((100vh - 130px) * 1 / 6);
width: calc((100vh - 130px) * 1 / 6);
background-image: url("./png/home_modelmanagement.png");
background-size: 100% 100%;
}
}
.row1_col3 {
height: calc((100vh - 130px) * 1 / 6);
min-height: 110px;
background-image: linear-gradient(125deg, #ff98c9, #7d3df4);
border-radius: 10px;
color: #fff;
display: flex;
flex-direction: column;
justify-content: space-evenly;
padding: 0 20px;
position: relative;
cursor: pointer;
.line1 {
font-size: 18px;
font-weight: 500;
}
.line2 {
font-size: 32px;
font-weight: 800;
}
.line3 {
font-size: 14px;
}
.backImg {
position: absolute;
right: -15px;
bottom: -15px;
height: calc((100vh - 130px) * 1 / 6);
width: calc((100vh - 130px) * 1 / 6);
background-image: url("./png/home_nodemanagement.png");
background-size: 100% 100%;
}
}
.row1_col4 {
height: calc((100vh - 130px) * 1 / 6);
min-height: 110px;
background-image: linear-gradient(125deg, #8ddbf2, #0f77d9);
border-radius: 10px;
color: #fff;
display: flex;
flex-direction: column;
justify-content: space-evenly;
padding: 0 20px;
position: relative;
cursor: pointer;
.line1 {
font-size: 18px;
font-weight: 500;
}
.line2 {
font-size: 32px;
font-weight: 800;
}
.line3 {
font-size: 14px;
}
.backImg {
position: absolute;
right: -15px;
bottom: -15px;
height: calc((100vh - 130px) * 1 / 6);
width: calc((100vh - 130px) * 1 / 6);
background-image: url("./png/home_datamanagement.png");
background-size: 100% 100%;
}
}
}
.row2 {
padding-top: 20px;
}
.row3 {
padding-top: 20px;
}
}
</style>

 浙公网安备 33010602011771号