graphviz快速入门
场景
俗话说的好“一图胜千言”,图片的展示维度很多,因此能够很容易呈现层次和结构信息,对于程序员来讲,流程图、类图等既是和其他人交流的好方式,又能帮助自己理清思路。
graphviz可以帮助你完成绘图任务,相较于visio等鼠标画图,使用graphviz需要先用dot语言以文本形式描述图片内容,然后由底层引擎完成图片生成,这样可以保证移植性,也让作图者能够将精力集中在图片结构上。
Graphviz is open source graph visualization software. Graph visualization is a way of representing structural information as diagrams of abstract graphs and networks. It has important applications in networking, bioinformatics, software engineering, database and web design, machine learning, and in visual interfaces for other technical domains.
The Graphviz layout programs take descriptions of graphs in a simple text language, and make diagrams in useful formats, such as images and SVG for web pages; PDF or Postscript for inclusion in other documents; or display in an interactive graph browser. Graphviz has many useful features for concrete diagrams, such as options for colors, fonts, tabular node layouts, line styles, hyperlinks, and custom shapes.
安装非常简单,apt或yum安装即可,graphviz官网也提供了网页使用接口。
DOT语言
dot语言提供了一套抽象语法规则,用来描述点、边、图、子图等,语法规则可以由下面表格概括
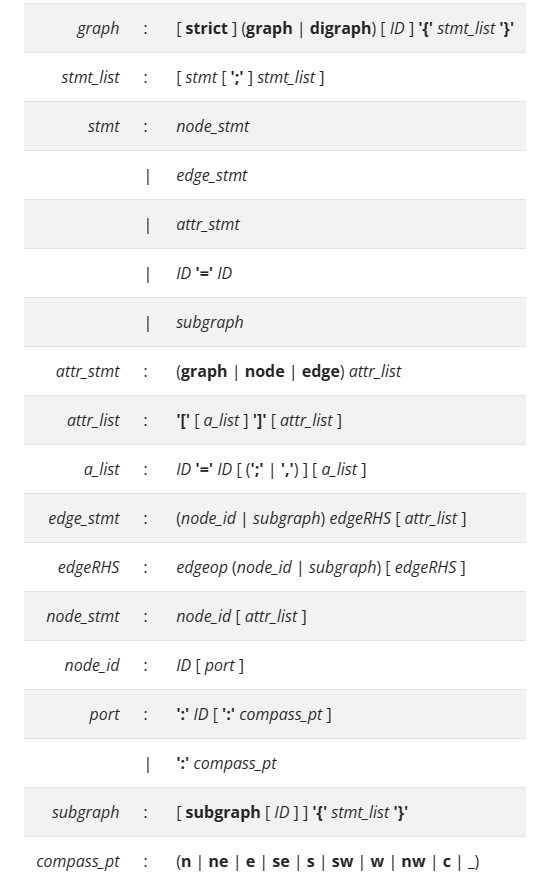
粗体可以认为是关键字,斜体可以认为是标识符或者说变量名,单引号引的粗体字是字面量,可以联想C++的语法规则。圆括号表示分组,括号里的任选一个即可,用竖线分割,方括号表示可选项。
简单解释一下语法,strict表示是否重复边,graph表示无向图,digraph表示有向图,一个图由一个graph {stmt_list}语法块表示,语句列表(stmt_list)由多个语句(stmt)组成,语句间可以用分号分隔,或者任何空白字符。语句(stmt)可以是节点(node_stmt)、边(edge_stmt)、属性(attr_stmt)、标识符复制(id),也可以是子图(subgraph),属性可以直接定义影响整个图所有的点或边,也可以针对每个点或边。attr_stmt加 graph node edge表示定义的是什么attr_list,attr_list语法块由以方括号包围的多个a_list组成,a_list是逗号或分号分隔的多个键值对形式,标识符的命名规则同C++变量命名方式。node_stmt由节点id和属性列表组成,edge_stmt是链式形式,可以由一个节点或一个子图指向另一个节点或子图,有向图用->,无向图用--,每一条边可选属性列表,边的起点通过port进行选择,eswn表示东南西北,结合record类型的节点,可以实现类似链表的图。子图(subgraph)形式为[subgraph [ID]] {stmt_list},dot语言也支持c++风格的注释
上面的语法规则十分精简,dot提供了大量属性以满足自定义需求,例如rank,shape,style等,这些可以查阅官网。
示例
下面给几个例子方便掌握
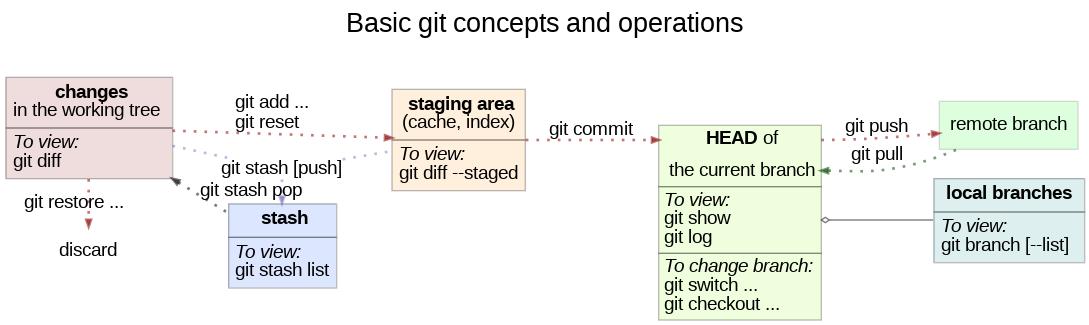
- git的基本概念和操作
digraph git_basics {
#定义全局属性
	graph [
                #图名在顶部显示
		label = "Basic git concepts and operations\n\n"
		labelloc = t
		fontname = "Helvetica,Arial,sans-serif"
		fontsize = 20
		layout = dot
                #从左到右排列系欸但
		rankdir = LR
		newrank = true
	]
	node [
                #节点内部填充颜色
		style=filled
		shape=rect
		pencolor="#00000044" // frames color
		fontname="Helvetica,Arial,sans-serif"
		shape=plaintext
	]
	edge [
		arrowsize=0.5
		fontname="Helvetica,Arial,sans-serif"
		labeldistance=3
		labelfontcolor="#00000080"
		penwidth=2
		style=dotted // dotted style symbolizes data transfer
	]
        # html风格定义节点 port可以用于连接边
	changes [
		color="#88000022"
		label=<<table border="0" cellborder="1" cellspacing="0" cellpadding="4">
			<tr> <td> <b>changes</b><br/>in the working tree </td> </tr>
			<tr> <td align="left"><i>To view: </i><br align="left"/>
			git diff
			<br align="left"/></td> </tr>
		</table>>
		shape=plain
	]
	staging [
		fillcolor="#ff880022"
		label=<<table border="0" cellborder="1" cellspacing="0" cellpadding="4">
			<tr> <td> <b>staging area</b><br/>(cache, index)</td> </tr>
			<tr> <td align="left"><i>To view: </i><br align="left"/>
			git diff --staged
			<br align="left"/></td> </tr>
		</table>>
		shape=plain
	]
	staging -> HEAD:push [label="git commit" weight=1000 color="#88000088"]
	stash [
		fillcolor="#0044ff22"
		label=<<table border="0" cellborder="1" cellspacing="0" cellpadding="4">
			<tr> <td> <b>stash</b></td> </tr>
			<tr> <td align="left"><i>To view:</i><br align="left"/>
			git stash list
			<br align="left"/></td> </tr>
		</table>>
		shape=plain
	]
	stash_push [
		label="git stash [push]"
		style=""
		shape=plain
		color="#00008844"
	]
	{
		edge [arrowhead=none color="#00008844"]
		changes ->  stash_push
		stash_push -> staging
	}
	changes -> stash [
		dir=back
		xlabel="git stash pop"
		color="#00000088" weight=0]
	stash_push -> stash [xdir=back color="#00008844" minlen=0]
	HEAD [
		fillcolor="#88ff0022"
		label=<<table border="0" cellborder="1" cellspacing="0" cellpadding="3">
			<tr> <td port="push" sides="ltr"> <b>HEAD </b>of</td> </tr>
			<tr> <td port="pull" sides="lbr"> the current branch</td> </tr>
			<tr> <td port="switch" align="left">
				<i>To view:</i>
				<br align="left"/>
				git show<br align="left"/>
				git log
				<br align="left"/>
			</td> </tr>
			<tr> <td align="left">
				<i>To change branch:</i><br align="left"/>
				git switch ...
				<br align="left"/>
				git checkout ...
				<br align="left"/>
			</td> </tr>
		</table>>
		shape=plain
	]
	remote [
		label="remote branch"
		shape=box
		color="#00000022"
		fillcolor="#00ff0022"
	]

	HEAD:push -> remote [label="git push" color="#88000088"]
	HEAD:pull -> remote [dir=back label="git pull" color="#00440088"]
	branches [
		fillcolor="#00888822"
		label=<<table border="0" cellborder="1" cellspacing="0" cellpadding="4">
			<tr> <td> <b>local branches</b> </td> </tr>
			<tr> <td align="left"><i>To view:</i><br align="left"/>
			git branch [--list]
			<br align="left"/></td> </tr>
			</table>>
		shape=plain
	]
	changes -> staging [label="git add ...    \ngit reset      " color="#88000088"]
	discard [shape=plaintext style=""]
	changes -> discard [label="git restore ..." color="#88000088"]
	{rank=same changes discard}
	// UML style aggregation
	HEAD:switch -> branches [
		dir=back
		style=""
		penwidth=1
		arrowtail=odiamond
		arrowhead=none
		color="#00000088"
	]
}
// © 2022 Costa Shulyupin, licensed under EPL
效果
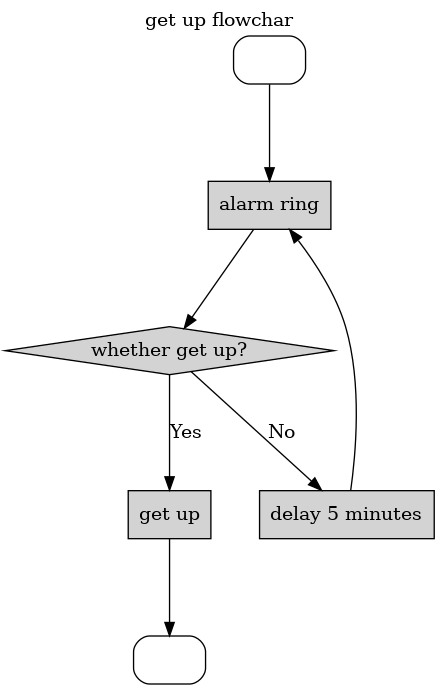
2. 简单流程图
digraph getup{
	graph [
		label="get up flowchar"
		labelloc="t"
		ranksep=1
	]
	//默认用process
	node[
		style=filled
		shape=rect
	]
	start [
		label=""
		style="rounded"
	]
	p1 [
		label="alarm ring"
	]
subgraph {
rank=same
nodesep=5
	p4 [
		label="delay 5 minutes"
	]
	p2 [
		label="whether get up?"
		shape="diamond"
	]
}
	p3 [
		label="get up"
	]
	end [
		label=""
		style="rounded"
	]
	start -> p1 -> p2
	p2 -> p3[label="Yes"]
	p3 -> end
	p2 -> p4[label="No"]
	p4 -> p1
}
参考
https://graphviz.org/doc/info/lang.html
https://blog.csdn.net/Augurlee/article/details/117913124
本文来自博客园,作者:xiaoweing,转载请注明原文链接:https://www.cnblogs.com/xiaoweing/p/17410561.html

 浙公网安备 33010602011771号