ELK安装
一、基础软件安装
yum -y localinstall elasticsearch-2.1.1.rpm
chkconfig --add elasticsearch
rpm -ivh jdk-8u111-linux-x64.rpm (elasticsearch 依赖于jdk1.8以上)
[root@rabbitmq-node2 ELK]# java -version
java version "1.8.0_111"
Java(TM) SE Runtime Environment (build 1.8.0_111-b14)
Java HotSpot(TM) 64-Bit Server VM (build 25.111-b14, mixed mode)
配置新的环境变量
[root@rabbitmq-node2 profile.d]# cat /etc/profile.d/java.sh
JAVA_HOME=/usr/java/jdk1.8.0_111
JRE_HOME=/usr/java/jdk1.8.0_111/jre
CLASS_PATH=.:$JAVA_HOME/lib/dt.jar:$JAVA_HOME/lib/tools.jar:$JRE_HOME/lib
PATH=$PATH:$JAVA_HOME/bin:$JRE_HOME/bin
export JAVA_HOME JRE_HOME CLASS_PATH PATH
修改/etc/elasticsearch/elasticsearch.yml 配置文件
[root@rabbitmq-node2 elasticsearch]# egrep -v "^$|#" elasticsearch.yml
cluster.name: gaoyang 多个机器的集群名称需要一样
node.name: node-1
path.data: /data/es-data 数据目录要创建,并且要赋值权限给elasticsearch用户。因为yum安装的默认是用的elasticsearch用户启动服务的
path.logs: /var/log/elasticsearch
bootstrap.mlockall: true 开启锁定内存
network.host: 0.0.0.0
http.port: 9200
[root@rabbitmq-node2 elasticsearch]# mkdir -p /data/es-data
chown -R elasticsearch.elasticsearch /data/es-data/
[root@rabbitmq-node2 elasticsearch]# cat /etc/security/limits.conf |grep elasticsearch
elasticsearch soft memlock unlimited
elasticsearch hard memlock unlimited
需要配置/etc/security/limits.conf文件,elasticsearch用户有权限独占内存
service elasticsearch status
service elasticsearch start 启动elasticsearch
然后查看端口和服务
[root@rabbitmq-node2 elasticsearch]# ss -tnulp|grep 9200
tcp LISTEN 0 50 :::9200 :::* users:(("java",55424,140))
[root@rabbitmq-node2 elasticsearch]# ps aux |grep elasticsearch
497 55424 5.5 3.5 4682452 583948 ? SLl 10:58 0:07 /usr/bin/java -Xms256m -Xmx1g -Djava.awt.headless=true -XX:+UseParNewGC -XX:+UseConcMarkSweepGC -XX:CMSInitiatingOccupancyFraction=75 -XX:+UseCMSInitiatingOccupancyOnly -XX:+HeapDumpOnOutOfMemoryError -XX:+DisableExplicitGC -Dfile.encoding=UTF-8 -Djna.nosys=true -Des.path.home=/usr/share/elasticsearch -cp /usr/share/elasticsearch/lib/elasticsearch-2.1.1.jar:/usr/share/elasticsearch/lib/* org.elasticsearch.bootstrap.Elasticsearch start -p /var/run/elasticsearch/elasticsearch.pid -d -Des.default.path.home=/usr/share/elasticsearch -Des.default.path.logs=/var/log/elasticsearch -Des.default.path.data=/var/lib/elasticsearch -Des.default.path.conf=/etc/elasticsearch
root 55516 0.0 0.0 105488 956 pts/1 S+ 11:00 0:00 grep elasticsearch
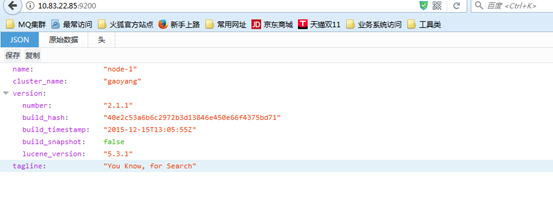
通过web页面访问,如果可以出现json格式的字符串,表示elasticsearch安装成功了。
安装完之后也可以通过查看日志来分析elasticsearch启动是否有问题
[root@rabbitmq-node1 profile.d]# tail -f /var/log/elasticsearch/xx.log
[2017-11-08 11:11:56,935][INFO ][node ] [node-2] initialized
[2017-11-08 11:11:56,936][INFO ][node ] [node-2] starting ...
[2017-11-08 11:11:57,013][WARN ][common.network ] [node-2] publish address: {0.0.0.0} is a wildcard address, falling back to first non-loopback: {10.83.22.86}
[2017-11-08 11:11:57,014][INFO ][transport ] [node-2] publish_address {10.83.22.86:9300}, bound_addresses {[::]:9300}
[2017-11-08 11:11:57,022][INFO ][discovery ] [node-2] gaoyang/1--F-NyXSHi6jMxdnQT-7A
[2017-11-08 11:12:00,061][INFO ][cluster.service ] [node-2] new_master {node-2}{1--F-NyXSHi6jMxdnQT-7A}{10.83.22.86}{10.83.22.86:9300}, reason: zen-disco-join(elected_as_master, [0] joins received)
[2017-11-08 11:12:00,087][WARN ][common.network ] [node-2] publish address: {0.0.0.0} is a wildcard address, falling back to first non-loopback: {10.83.22.86}
[2017-11-08 11:12:00,087][INFO ][http ] [node-2] publish_address {10.83.22.86:9200}, bound_addresses {[::]:9200}
[2017-11-08 11:12:00,087][INFO ][node ] [node-2] started
[2017-11-08 11:12:00,121][INFO ][gateway ] [node-2] recovered [0] indices into cluster
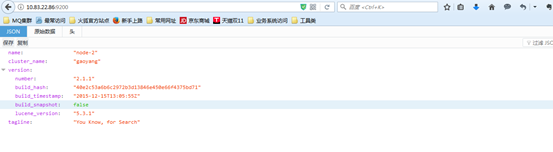
通过web访问另外一个节点Node-2
[root@rabbitmq-node2 elasticsearch]# curl -i -XGET 'http://10.83.22.86:9200/_count?pretty' -d ' {
> "query": {
> "match_all": {}
> }
> }'
HTTP/1.1 200 OK
Content-Type: application/json; charset=UTF-8
Content-Length: 95
{
"count" : 0,
"_shards" : {
"total" : 0,
"successful" : 0,
"failed" : 0
}
}
[root@rabbitmq-node2 elasticsearch]#
pretty,参数告诉elasticsearch,返回形式打印JSON结果
query:告诉我们定义查询
match_all:运行简单类型查询指定索引中的所有文档
http://blog.csdn.net/stark_summer/article/details/48830493
安装elasticsearch-head插件:
/usr/share/elasticsearch/bin/plugin install mobz/elasticsearch-head
首先创建一个索引,选择5分片,副本数为1
然后可以在这个索引里面POST数据到里面
然后可以通过ID get刚才post上去的数据
创建了index之后,黄色表示主的没有问题,备节点有问题
正常的集群应该是两个节点都是绿色的才正确
两个服务器如果要创建集群。除了上面所说的要配置同一个集群名称以外,还需要配置单播。默认用的是多播的方式。但是多播不成功的话,就需要配置单播
[root@rabbitmq-node2 elasticsearch]# cat /etc/elasticsearch/elasticsearch.yml |grep discovery
# Pass an initial list of hosts to perform discovery when new node is started:
discovery.zen.ping.multicast.enabled: false
discovery.zen.ping.unicast.hosts: ["10.83.22.85", "10.83.22.86"]
# discovery.zen.minimum_master_nodes: 3
# <http://www.elastic.co/guide/en/elasticsearch/reference/current/modules-discovery.html>
[root@rabbitmq-node2 elasticsearch]#
把集群的IP配置到单播的地址里面,并且在防火墙里面开通两个机器的集群通信端口9300;注意9200只是访问端口
安装elasticsearch的监控插件
/usr/share/elasticsearch/bin/plugin install lmenezes/elasticsearch-kopf
Install 后面紧跟着的是github的下载地址,默认会在github下面下载
安装logstash:
wget ftp://bqjrftp:Pass123$%^@10.83.20.27:9020/software/ELK/logstash-2.1.1-1.noarch.rpm
yum -y localinstall logstash-2.1.1-1.noarch.rpm
/opt/logstash/bin/logstash -e 'input { stdin{} } output { stdout{} }' 启动logstash
然后输入hello,控制台就会输出信息
Ctrc+c 取消掉logstash的运行
然后重新输入命令:
/opt/logstash/bin/logstash -e 'input { stdin{} } output { stdout{ codec => rubydebug} }'
codec:输出至前台,方便边实践边测试
#通常使用rubydebug方式前台输出展示以及测试
# /opt/logstash/bin/logstash -e 'input { stdin{} } output { elasticsearch {hosts => ["10.83.22.85:9200"] } stdout{ codec => rubydebug } }'
输出到elasticsearch,并且输出到控制台
同时在elasticsearch也可以看的到输出的数据
也可以通过写配置文件,然后启动logstash的时候指定配置文件的方式
[root@SZ33SITSIM00AP0003 software]# cat /etc/profile.d/logstash.sh 把logstash的执行文件写入到环境变量,下次执行命令就不需要写绝对路径了
LOGSTASH_HOME=/opt/logstash/bin
export PATH=$LOGSTASH_HOME:$PATH
[root@SZ33SITSIM00AP0003 software]# source /etc/profile
[root@SZ33SITSIM00AP0003 software]# logstash -f /confs/logstash-simple.conf
}
[root@SZ33SITSIM00AP0003 ~]# cat /confs/logstash-simple.conf
input {
stdin { }
}
output {
elasticsearch { hosts => ["10.83.22.85:9200"] }
stdout { codec => rubydebug }
}
[root@SZ33SITSIM00AP0003 ~]#
现在要把系统日志文件/var/log/message 还有nginx的访问日志文件access.log 放到elasticsearch里面查询的配置
input {
file {
path => "/var/log/messages"
type => "syslog"
start_position => "beginning" #表示从文件的开头开始
}
file {
path => "/usr/local/nginx/logs/access.log"
type => "nginx"
codec => "json"
start_position => "beginning"
}
}
output {
if[type] == "syslog" { #根据文件的类型创建不同的索引
elasticsearch {
hosts => ["10.83.22.85:9200"]
index => ['syslog-%{+YYYY-MM-dd}']
workers => 5 #指定多线程
}
}
if[type] == "nginx" {
elasticsearch {
hosts => ["10.83.22.85:9200"]
index => ['nginx-%{+YYYY-MM-dd}']
workers => 5
}
}
}
logstash -f /confs/logstash-simple.conf 启动logstash
安装kibana:
wget ftp://bqjrftp:Pass123$%^@10.83.20.27:9020/software/ELK/kibana-4.3.1-linux-x64.tar.gz
tar xzvf kibana-4.3.1-linux-x64.tar.gz
mv kibana-4.3.1-linux-x64 /usr/local/
ln -sv kibana-4.3.1-linux-x64/ kibana
vim /usr/local/kibana/config/kibana.yml
server.port: 5601
server.host: "0.0.0.0"
server.basePath: ""
elasticsearch.url: "http://10.83.22.85:9200"
kibana.index: ".kibana"
screen -S kibana
/usr/local/kibana/bin/kibana &
Ctrl+a+d
Screen -ls
放在后台开启
ab -n 1000 -c 20 http://10.83.36.35:80/ 模拟用户访问浏览器
注意这个ab命令 后面的网址是http://ip:端口/路径的格式
Ab命令默认系统是没有安装的,需要安装的方法是:
yum install yum-utils
cd /opt
mkdir abtmp
cd abtmp
yum install yum-utils.noarch
yumdownloader httpd-tools*
rpm2cpio httpd-*.rpm | cpio -idmv
修改nginx的配置文件(主要是修改日志的格式)
log_format access_log_json '{"user_ip":"$http_x_real_ip","lan_ip":"$remote_addr","log_time":"$time_iso8601","user_req":"$request","http_code":"$status","body_bytes_sents":"$body_bytes_sent","req_time":"$request_time","user_ua":"$http_user_agent"}';
在server段里面调用日志
access_log logs/host.access.log access_log_json;
然后设置logstash的配置文件
[root@SZ33SITSIM00AP0003 ~]# cat /confs/logstash-nginx.conf
input{
file {
path => "/usr/local/nginx/logs/host.access.log"
codec => "json"
type => "nginx-json"
start_position => "beginning"
}
}
filter{
}
output{
elasticsearch {
hosts => ["10.83.22.85:9200"]
index => "nginx-json-%{+YYYY-MM-dd}"
}
}
然后在另外一台机器模拟访问
ab -n 1000 -c 20 http://10.83.36.35:80/
最终在elasticsearch看到的效果就是
可以看到分域显示的
# Set ES_HEAP_SIZE to 50% of available RAM, but no more than 31g
ES_HEAP_SIZE=4g
# 配置 JVM内存
vim /etc/sysconfig/elasticsearch
ES_HEAP_SIZE=4g
# 这台机器的可用内存为8G
Filebeat的安装和配置
wget ftp://bqjrftp:Pass123$%^@10.83.20.27:9020/software/ELK/filebeat-5.0.1-x86_64.rpm
Rpm -ivh filebeat-5.0.1-x86_64.rpm
配置文件:/etc/filebeat/filebeat.yml
filebeat.prospectors:
- input_type: log
paths:
- /home/weblogic/scm_server/logs/logger.log 定义日志文件的路径
encoding: plain 定义日志的编码是UTF-8
document_type: scm_server_msg 定义分类,在logstash服务器上面可以通过type字段引用这个类型
- input_type: log
paths:
- /home/weblogic/scm_server/logs/logger_error.log
encoding: plain
document_type: scm_server_error
tail_files: false 表示从文件头部开始获取日志,默认是true,就是从文件的结尾开始获取日志,如果此选项没有作用的话,可以使用另外一种方法,就是删除记录日志读取位置的文件 rm -rf /var/lib/filebeat/registry
multiline: 这一段的配置主要是针对tomcat报错的多行合并
pattern: '^\#\#\#\s' 这一块是正则表达式,因为scm_server的error日志,每一行都是以###开始的,所以用正则表达式来表示以###开头紧接着是空格的 \s表示空格
negate: true 符合上面的正则表达式
match: after 向下匹配成一行
timeout: 10s 定义超时时间,如果开始一个新的事件在超时时间内没有发现匹配,也将发送日志,默认是5s
- input_type: log
paths:
- /home/weblogic/bla_server/logs/logger_error.log
encoding: plain
document_type: bla_server_error
tail_files: false
multiline:
pattern: '^\[' 这一块是正则表达式,因为bla_server的error日志,报错每一行都是以[开始的,所以用正则表达式来表示以[开头紧接着是空格的
negate: true
match: after
timeout: 10s
- input_type: log
paths:
- /home/weblogic/bla_server/logs/logger.log
encoding: plain
document_type: bla_server_msg
processors:
- drop_fields:
fields: ["input_type", "beat", "offset", "source","tags","@timestamp"]
fields:
ip_address: 172.16.8.11 在logstash里面定义的的变量内容
host: 172.16.8.11
fields_under_root: true
output.logstash: 将filebeat抓取的日志输出到logstash
hosts: ["10.83.22.118:5044"]
Logstash配置:logstash是自定义配置文件的
[root@SZ3FUATIMS00AP0001 ~]# cat /confs/logstash/conf.d/filebeat.conf
input { #这块是定义logstash的端口,filebeat服务器里面的output写了这个端口
beats {
port => 5044
}
}
output {
if [type] == "scm_server_msg" { #这个地方就是根据filebeat里面的document_type定义的类型来设置的,通过if来实现不同的日志文件,输出到elasticsearch里面为不同的索引
elasticsearch {
hosts => [ "10.83.22.118:9200" ] #定义输出到elasticsearch,端口是9200
index => "scm_server_msg-%{+YYYY.MM.dd}" #定义elasticsearch里面的index的名称
}
}
if [type] == "scm_server_error" {
elasticsearch {
hosts => [ "10.83.22.118:9200" ]
index => "scm_server_error-%{+YYYY.MM.dd}"
}
}
if [type] == "bla_server_error" {
elasticsearch {
hosts => [ "10.83.22.118:9200" ]
index => "bla_server_error-%{+YYYY.MM.dd}"
}
}
if [type] == "bla_server_msg" {
elasticsearch {
hosts => [ "10.83.22.118:9200" ]
index => "bla_server_msg-%{+YYYY.MM.dd}"
}
}
#这一块的配置主要是邮件报警,通过if判断type的名称并且日志message字段就是消息主体里面包含了ERROR的内容就触发email插件来实现报警
if [type] =~ /bla_server_error|scm_server_error/ and [message] =~ /ERROR/ {
email {
port => 25
address => "smtp.163.com"
username => "xxxx"
password => "xxx"
authentication => "plain"
from => "18688791025@163.com"
codec => "plain" 这里是指定日志的编码UTF-8
contenttype => "text/html; charset=UTF-8"
subject => "%{type}:应用错误日志!%{host}" 这里是邮件的标题,里面用到了变量,分别为type和主机ip
to => "xx.xx@xx.x"
cc #抄送给谁 => "xxx@xx"
via => "smtp"
body => "%{message}" #邮件的内容为message的内容
}
}
}

 浙公网安备 33010602011771号