Hystrix 服务熔断
服务雪崩
多个微服务之间调用的时候,假设微服务A调用微服务B和微服务C又调用其他微服务,这就是所谓的"扇出",如果扇出的链路某个某个微服务的调用响应市场过长或者不可用,对微服务A的调用就会占用越来越多的系统资源,进而引起系统崩溃,雪崩效应。
对于高流量的应用来说,单一的后端依赖可能会导致所有服务器上的所有资源在几秒内饱和。比失败更糟糕的是,这些应用程序还可能导致服务之间的延迟增加,备份队列,线程和其他系统资源紧张,导致整个系统发生更多的级联故障,这些都表示需要对故障和延迟进行隔离和管理,以便每个依赖关系的失败,不能取消整个应用程序或者系统。
什么是Hystrix
Hystrix是一个用于处理分布式系统的延迟和容错的开源库,在分布式系统里,许多依赖不可避免都会调用失败,比如超时,异常等。Hystrix能够保证在一个依赖出问题的情况下,不会导致整体服务失败,避免级联故障,以提高分布式系统的弹性。
"断路器"本身是一个开关装置,当某个服务单元发生故障之后,通过断路器的故障监控(类似于熔断保险丝),向调用方法返回一个服务预期的,可处理的备选响应(FallBack),而不是长时间的等待或者抛出调用方法无法处理的异常,这样就可以保证了服务方的线程不会被长时间爱不必要的占用,从而避免了故障在分布式系统中的蔓延,乃至雪崩。
服务熔断
熔断机制
- 熔断机制是对应雪崩效应的一种微服务链路保护机制。
- 当扇出链路的某个微服务不可用或者响应时间太长时,会进行服务的降级,进而熔断该节点微服务的调用,快速返回错误的响应信息。当检测到该节点微服务调用响应正常后恢复调用链路。在SpringCloud框架里熔断机制通过Hystrix实现。Hystrix会监控微服务键调用的状况,当失败的调用达到阈值,缺省是5秒内20次调用失败就会启动熔断机制,熔断机制的注解是@HystrixCommand。
开始
- 在之前的服务提供者[写在服务端的]https://www.cnblogs.com/xiaominaaaa/p/14044471.html,进行扩展
1.添加依赖
 <!--hystrix -->
    <dependency>
        <groupId>org.springframework.cloud</groupId>
        <artifactId>spring-cloud-starter-netflix-hystrix</artifactId>
    </dependency>
2.编写配置
用@HystrixCommand注解指定备选方法,出错时返回备选方法
/**
 * 关键,提供 Restful 服务
 */
@RestController
public class PersonController {
    @Autowired
    PersonService personService;

    @HystrixCommand(fallbackMethod = "fallback") //失败后会调用fallback这个方法
    @GetMapping("/person/{id}")
    public Person getPersonById(@PathVariable("id") int id) {
        Person person = personService.getPersonById(id);
        //优化一下,抛出异常
        if(person == null){
            throw new RuntimeException("不存在的id: "+id);
        }
        return person;
    }
    /**
     * 提供备选的方法,什么都不做,返回一个提示错误的对象
     */
    public Person fallback(@PathVariable("id") int id){
        return new Person()
                .setId(id)
                .setName("未知的用户,不存在")
                .setDb_source("unkonw database for this user");
    }
}
3. 开启注解
@SpringBootApplication
@EnableEurekaClient
@EnableDiscoveryClient //允许服务发现
@EnableCircuitBreaker //添加对熔断的支持 Circuit Breaker 熔断器
public class PersonProviderApplication_Hystrix {
    public static void main(String[] args) {
        SpringApplication.run(PersonProviderApplication_Hystrix.class,args);
    }
}
服务降级
- 当服务器压力剧增时,根据实际业务及流量,对一些服务和页面有策略的不处理或换种简单的方式处理,从而释放服务器资源以保证核心交易正常运作或高效运转。
- 如有A,B,C三个服务,当某个时间段A服务访问量特别大,但是B,C服务访问量却很少时,我们可以先减少或停止B,C服务,来保障A服务的正常运行。
开始
- 是在添加了Feign后的API接口进行扩展的[写在客户端的的]https://www.cnblogs.com/xiaominaaaa/p/14261814.html
1.编写配置
- 写FallbackFactory的实现类,返回Service,是对一个服务做手脚
/**
 * 服务降级
 */
@Component
public class PersonFallbackFactory implements FallbackFactory {
    /**
     * 返回要降级的类
     * @param throwable
     * @return
     */
    @Override
    public PersonService create(Throwable throwable) {
        return new PersonService() {
            @Override
            public Person getPersonById(Integer id) {
                return new Person().setId(id).setName("服务降级中,暂停使用");
            }
            @Override
            public List<Person> personAll() {
                return null;
            }

            @Override
            public void addPerson(Person person) {
            }
        };
    }
}
- 在之前编写的PersonService接口中指定这个工厂
@FeignClient(value = "provider-person-8001",fallbackFactory = PersonFallbackFactory.class)
public interface PersonService {
    @GetMapping("/person/{id}")
    Person getPersonById(@PathVariable("id") Integer id);
    @GetMapping("/person/getall")
    List<Person> personAll();
    @PostMapping("person/add")
    void addPerson(Person person);
}
2. 开启配置
- 在已经添加了Feign的服务消费者中,添加这段配置,开启熔断
#开启降级服务
feign:
  hystrix:
    enabled: true
Dashboard监控
1. 编写一个监控子模块
(1).pom.xml
<dependencies>
        <!--ribbon-->
        <dependency>
            <groupId>org.springframework.cloud</groupId>
            <artifactId>spring-cloud-starter-netflix-ribbon</artifactId>
        </dependency>
        <!--Eureka 客户端-->
        <dependency>
            <groupId>org.springframework.cloud</groupId>
            <artifactId>spring-cloud-starter-netflix-eureka-client</artifactId>
        </dependency>
        <!--引入api模块-->
        <dependency>
            <groupId>cn.lzm</groupId>
            <artifactId>springcloud-api</artifactId>
            <version>1.0-SNAPSHOT</version>
        </dependency>
        <!--web-->
        <dependency>
            <groupId>org.springframework.boot</groupId>
            <artifactId>spring-boot-starter-web</artifactId>
        </dependency>
        <!--hystrix 服务熔断-->
        <dependency>
            <groupId>org.springframework.cloud</groupId>
            <artifactId>spring-cloud-starter-netflix-hystrix</artifactId>
        </dependency>
        <!--hystrix监控-->
        <dependency>
            <groupId>org.springframework.cloud</groupId>
            <artifactId>spring-cloud-starter-netflix-hystrix-dashboard</artifactId>
        </dependency>
    </dependencies>
(2).application.yml
server:
  port: 9001
hystrix:
  dashboard:
    proxy-stream-allow-list: "*"
(3)主启动类
@SpringBootApplication
@EnableHystrixDashboard //开启数据监控
public class DashboardApplication_9001 {
    public static void main(String[] args) {
        SpringApplication.run(DashboardApplication_9001.class,args);
    }
}
2. 在服务端扩展
- 监控的方法必须是添加了@HystrixCommand注解的方法,也就是加了熔断的方法
(1).检查服务端有没有这两个依赖
   <!--hystrix 服务熔断-->
    <dependency>
        <groupId>org.springframework.cloud</groupId>
        <artifactId>spring-cloud-starter-netflix-hystrix</artifactId>
    </dependency>
     <!--springboot 数据监控-->
    <dependency>
        <groupId>org.springframework.boot</groupId>
        <artifactId>spring-boot-starter-actuator</artifactId>
    </dependency>
(2). 添加一个注册的bean,是固定的
    @Bean
    public ServletRegistrationBean hystrixMetricsStreamServlet(){
        ServletRegistrationBean bean = new ServletRegistrationBean(new HystrixMetricsStreamServlet());
        bean.setLoadOnStartup(1);
        bean.addUrlMappings("/actuator/hystrix.stream");
        bean.setName("HystrixMetricsStreamServlet");
        return bean;
    }
3. 监控页面
(1) 根据上面的代码访问 localhost:9001/hystrix
- 可以看到一只野猪,如下图
![]()
(2) 根据之前配置填写信息,我的路径是 http://localhost:8001/actuator/hystrix.stream
- 可看到下图:
![]()

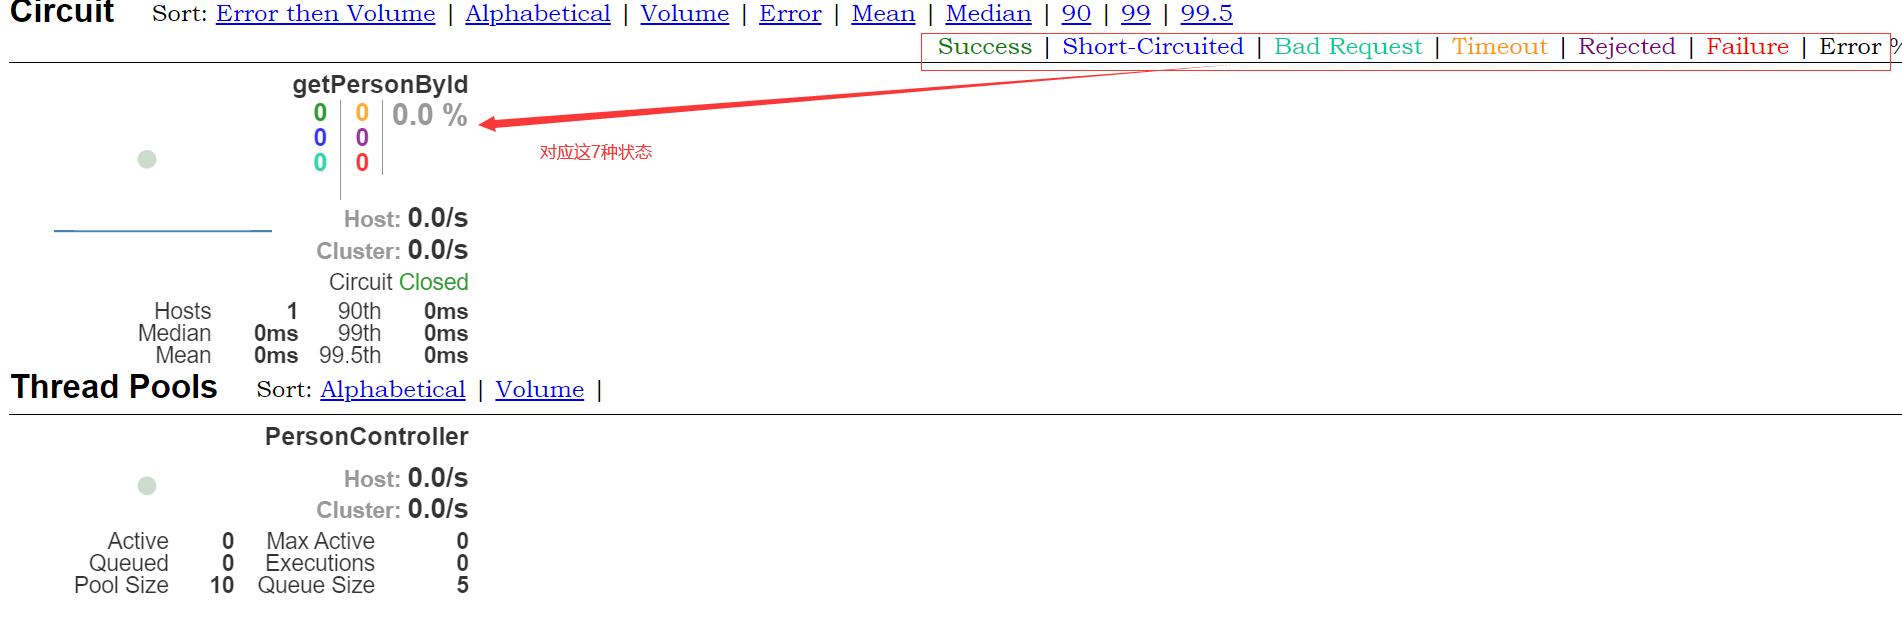
4. 监控解析
-
7色,7种颜色,7种颜色对应了7种状态
![]()
-
一圆
实心圆:有两种含义,通过对颜色的变化代表了实例的健康程度
它的健康程度从绿色<黄色<橙色<红色 递减
除了颜色会发生变化之外,它的大小也会根据实例的请求流量发生变化,流量越大,实心圆就越大,所以通过实心圆的展示,就可以在大量的实例中发现故障实例和高压力实例。 -
一线
这条线可以看到两分钟流量的的相对变化,可以通过它来观看来观察到流量的上升和下降趋势。

 浙公网安备 33010602011771号