js前端使用jOrgChart插件实现组织架构图的展示
一、说明
(1)通过后台查询数据库,生成树形数组结构,返回到前台。
(2)需要引入的js插件和css文件:
①jquery.jOrgChart.css
②jquery.min.js
③jquery.jOrgChart.js
(3)使用jOrgChart插件,根据返回的数据将其子节点加入到相应的<li></li>中。
首先,我们的数据表应该要有 id(节点),pid(父节点的id),name的字段,
那么我们要把这个数组转为树形数组结构,即将各个元素放在 pid 父类元素的 childrens字段中,下面就是简单生成树形数组的代码。至于展示出来的样式,可以在html页面中添加自定义样式覆盖它之前的样式。
注意:
后台返回的数据格式必须如下,其中id,pid字段为必须要有。childrens字段也为必须的,不过字段名可以自己定义,name字段是根据自己业务需求的字段,在这里以name字段作为要显示的文本内容:
{
  "data": [{
    "id": 1,
    "name": "企业主体信用得分",
    "pid": null,
    "childrens": [
      {
        "id": 2,
        "name": "企业素质",
        "pid": 1,
        "childrens": [
          {
            "id": 5,
            "name": "基本信息",
            "pid": 2,
            "childrens": [
              {
                "id": 10,
                "name": "企业主体信息识别",
                "pid": 5,
                "childrens": [
                ]
              },
              {
                "id": 11,
                "name": "企业持续注册时间",
                "pid": 5,
                "childrens": [
                ]
              },
              {
                "id": 12,
                "name": "注册资本",
                "pid": 5,
                "childrens": [
                ]
              }
            ]
          },
          {
            "id": 6,
            "name": "管理认证",
            "pid": 2,
            "childrens": [
              {
                "id": 13,
                "name": "国际性管理认证",
                "pid": 6,
                "childrens": [
                ]
              }
            ]
          }
        ]
      },
      {
        "id": 3,
        "name": "履约记录",
        "pid": 1,
        "childrens": [
          {
            "id": 7,
            "name": "税务执行情况",
            "pid": 3,
            "childrens": [
              {
                "id": 14,
                "name": "是否按时缴纳税款",
                "pid": 7,
                "childrens": [
                ]
              }
            ]
          },
          {
            "id": 8,
            "name": "网贷情况",
            "pid": 3,
            "childrens": [
              {
                "id": 15,
                "name": "网贷逾期",
                "pid": 8,
                "childrens": [
                ]
              }
            ]
          }
        ]
      },
      {
        "id": 4,
        "name": "公共监督",
        "pid": 1,
        "childrens": [
          {
            "id": 9,
            "name": "行政处罚",
            "pid": 4,
            "childrens": [
              {
                "id": 16,
                "name": "处罚信息",
                "pid": 9,
                "childrens": [
                ]
              }
            ]
          }
        ]
      }
    ]
  }
]
}
二、实例:
1、json文件(test.json)(即后台接口返回的json格式的数据)
{
  "data": [{
    "id": 1,
    "name": "企业主体信用得分",
    "pid": null,
    "childrens": [
      {
        "id": 2,
        "name": "企业素质",
        "pid": 1,
        "childrens": [
          {
            "id": 5,
            "name": "基本信息",
            "pid": 2,
            "childrens": [
              {
                "id": 10,
                "name": "企业主体信息识别",
                "pid": 5,
                "childrens": [
                ]
              },
              {
                "id": 11,
                "name": "企业持续注册时间",
                "pid": 5,
                "childrens": [
                ]
              },
              {
                "id": 12,
                "name": "注册资本",
                "pid": 5,
                "childrens": [
                ]
              }
            ]
          },
          {
            "id": 6,
            "name": "管理认证",
            "pid": 2,
            "childrens": [
              {
                "id": 13,
                "name": "国际性管理认证",
                "pid": 6,
                "childrens": [
                ]
              }
            ]
          }
        ]
      },
      {
        "id": 3,
        "name": "履约记录",
        "pid": 1,
        "childrens": [
          {
            "id": 7,
            "name": "税务执行情况",
            "pid": 3,
            "childrens": [
              {
                "id": 14,
                "name": "是否按时缴纳税款",
                "pid": 7,
                "childrens": [
                ]
              }
            ]
          },
          {
            "id": 8,
            "name": "网贷情况",
            "pid": 3,
            "childrens": [
              {
                "id": 15,
                "name": "网贷逾期",
                "pid": 8,
                "childrens": [
                ]
              }
            ]
          }
        ]
      },
      {
        "id": 4,
        "name": "公共监督",
        "pid": 1,
        "childrens": [
          {
            "id": 9,
            "name": "行政处罚",
            "pid": 4,
            "childrens": [
              {
                "id": 16,
                "name": "处罚信息",
                "pid": 9,
                "childrens": [
                ]
              }
            ]
          }
        ]
      }
    ]
  }
]
}
2、html页面(test.html)
<!DOCTYPE html>
<html lang="en">
<head>
    <meta charset="UTF-8">
    <title>jOrgChart异步加载</title>
    <link rel="stylesheet" href='jquery.jOrgChart.css'/>
    <script type='text/javascript' src='jquery.min.js'></script>
    <script type='text/javascript' src='jquery.jOrgChart.js'></script>
    <style>
        a {
            text-decoration: none;
            color: #fff;
            font-size: 12px;
        }
        .jOrgChart .node {
            width: 120px;
            height: 50px;
            line-height: 50px;
            border-radius: 4px;
            margin: 0 8px;
        }
    </style>
</head>
<body>
<!--显示组织架构图-->
<div id='jOrgChart'></div>


<script type='text/javascript'>
    $(function(){
        //数据返回
        $.ajax({
            url: "test.json",
            type: 'GET',
            dataType: 'JSON',
            data: {action: 'org_select'},
            success: function(result){
                var showlist = $("<ul id='org' style='display:none'></ul>");
                showall(result.data, showlist);
                $("#jOrgChart").append(showlist);
                $("#org").jOrgChart( {
                    chartElement : '#jOrgChart',//指定在某个dom生成jorgchart
                    dragAndDrop : false //设置是否可拖动
                });

            }
        });
    });

    function showall(menu_list, parent) {
        $.each(menu_list, function(index, val) {
            if(val.childrens.length > 0){

                var li = $("<li></li>");
                li.append("<a href='javascript:void(0)' onclick=getOrgId("+val.id+");>"+val.name+"</a>").append("<ul></ul>").appendTo(parent);
                //递归显示
                showall(val.childrens, $(li).children().eq(1));
            }else{
                $("<li></li>").append("<a href='javascript:void(0)' onclick=getOrgId("+val.id+");>"+val.name+"</a>").appendTo(parent);
            }
        });

    }

</script>
</body>
</html>
Tp3admin的html代码
{extend name='admin@public/content'}

{block name="content"}
<head>
    <meta charset="utf-8">
    <title>jquery组织架构插件-jOrgChart.js | jQuery特效|手机微信网站特效| 网页特效库</title>
    <link rel="stylesheet" href="/static/jorgcharts/css/jquery.jOrgChart.css"/>
    <link href="/static/jorgcharts/css/prettify.css" type="text/css" rel="stylesheet" />
    <link rel="stylesheet" href="/static/jorgcharts/css/cus.css"/>
    <script type="text/javascript" src="/static/jorgcharts/prettify.js"></script>
    <script type="text/javascript" src="/static/jorgcharts/jquery-ui.min.js"></script>
    <script src="/static/jorgcharts/jquery.jOrgChart.js"></script>
    <script>
        jQuery(document).ready(function() {
            $("#org").jOrgChart({
                chartElement : '#chart',
                dragAndDrop  : true
            });
        });
    </script>

        <style>

    </style>

</head>

<!--显示组织架构图-->
<div id='jOrgChart'></div>


<script type='text/javascript'>
    $(function(){
        //数据返回
        $.ajax({
            url: '{:url("$classuri/return_json")}',
            type: 'GET',
            dataType: 'JSON',
            data: {action: 'org_select'},
            success: function(result){
                var showlist = $("<ul id='org' style='display:none'></ul>");
                console.log(result.data);
                showall(result.data, showlist);
                $("#jOrgChart").append(showlist);
                $("#org").jOrgChart( {
                    chartElement : '#jOrgChart',//指定在某个dom生成jorgchart
                    dragAndDrop : false //设置是否可拖动
                });

            }
        });
    });

    function showall(menu_list, parent) {
        $.each(menu_list, function(index, val) {
            if(val.childrens.length > 0){

                var li = $("<li></li>");
                li.append("<a href='javascript:void(0)'  >"+val.id+val.user_name+"</a>").append("<ul></ul>").appendTo(parent);
                //递归显示
                showall(val.childrens, $(li).children().eq(1));
            }else{
                $("<li></li>").append("<a href='javascript:void(0)'  >"+val.id+val.user_name+"</a>").appendTo(parent);
            }
        });

    }

</script>
</body>


{/block}
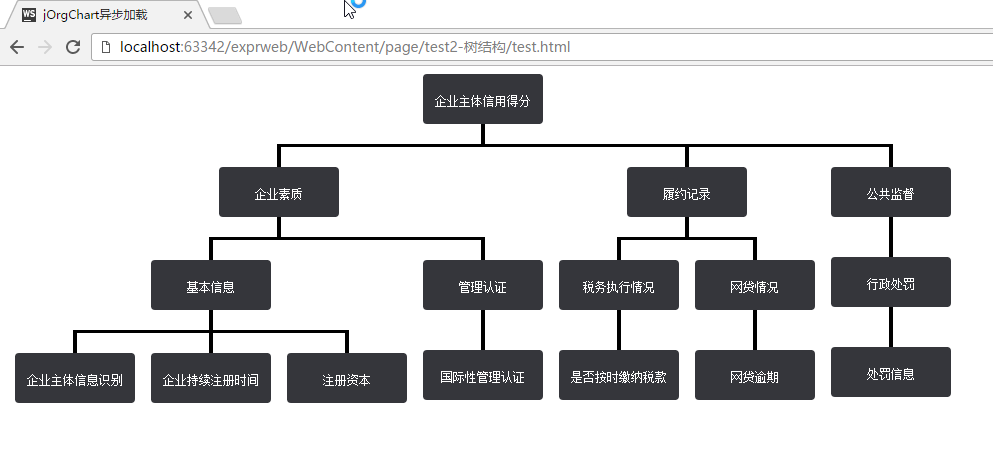
3、效果图


【推荐】国内首个AI IDE,深度理解中文开发场景,立即下载体验Trae
【推荐】编程新体验,更懂你的AI,立即体验豆包MarsCode编程助手
【推荐】抖音旗下AI助手豆包,你的智能百科全书,全免费不限次数
【推荐】轻量又高性能的 SSH 工具 IShell:AI 加持,快人一步
· 从 HTTP 原因短语缺失研究 HTTP/2 和 HTTP/3 的设计差异
· AI与.NET技术实操系列:向量存储与相似性搜索在 .NET 中的实现
· 基于Microsoft.Extensions.AI核心库实现RAG应用
· Linux系列:如何用heaptrack跟踪.NET程序的非托管内存泄露
· 开发者必知的日志记录最佳实践
· TypeScript + Deepseek 打造卜卦网站:技术与玄学的结合
· Manus的开源复刻OpenManus初探
· AI 智能体引爆开源社区「GitHub 热点速览」
· 三行代码完成国际化适配,妙~啊~
· .NET Core 中如何实现缓存的预热?