vue使用Highcharts图表
一、概述
Highcharts 是一个制作图表的纯 Javascript 类库,主要特性如下:
-
兼容性:兼容当今所有的浏览器,包括 iPhone、IE 和火狐等等;
-
对个人用户完全免费;
-
纯 JS,无 BS;
-
支持大部分的图表类型:直线图,曲线图、区域图、区域曲线图、柱状图、饼状图、散布图;
-
跨语言:不管是 PHP、Asp.net 还是 Java 都可以使用,它只需要三个文件:一个是 Highcharts 的核心文件 highcharts.js,还有 a canvas emulator for IE 和 Jquery 类库或者 MooTools 类库;
-
提示功能:鼠标移动到图表的某一点上有提示信息;
-
放大功能:选中图表部分放大,近距离观察图表;
-
易用性:无需要特殊的开发技能,只需要设置一下选项就可以制作适合自己的图表;
-
时间轴:可以精确到毫秒;
Highcharts演示:https://www.highcharts.com.cn/demo/highcharts
二、安装Highcharts
官方文档:https://www.highcharts.com.cn/docs/highcharts-vue
安装模块
npm install highcharts
npm install highcharts-vue
注意:官方文档,只写了highcharts-vue。实际情况下,还需要安装highcharts,用来导入一些依赖模块。
注册
局部注册
若仅用于特定组件,请使用局部注册方法。首先,您应该从组件文件中的 Highcharts-Vue 包中导入 Chart 组件对象:
import {Chart} from 'highcharts-vue'
然后,您需要在 Vue 实例配置中注册它,即在 components 部分中
{
    components: {
        highcharts: Chart
    }
}
配置
如果您已经完成上述任务之一(导入和注册组件),它允许您在应用程序中使用 Highcharts-Vue 组件,只需要添加 <highcharts> 元素,而且必须通过它的 :options 参数传递图表配置对象
<highcharts :options="chartOptions"></highcharts>
例如:

new Vue({
    data() {
        return {
            chartOptions: {
                series: [{
                    data: [1, 2, 3] // sample data
                }]
            }
        }
    }
})
三、使用Highcharts
折线图
基础折线图:https://www.highcharts.com.cn/demo/highcharts/line-basic
点击编辑源代码,复制下图红色部分代码
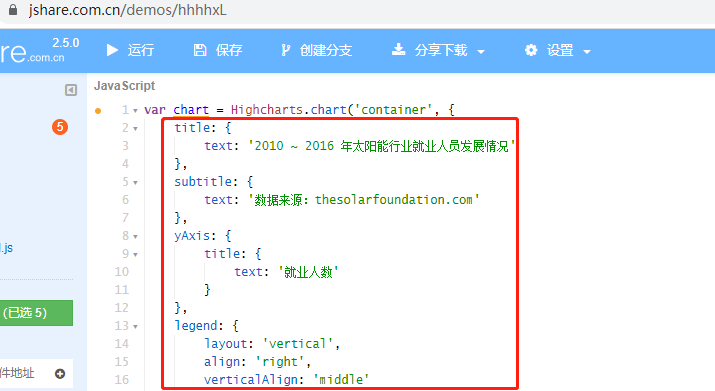
到vue文件中即可。
test.vue


<template>
  <div>
    <highcharts :options="chartOptions1"></highcharts>
  </div>
</template>

<script>
  import {Chart} from 'highcharts-vue'
  import Highcharts from 'highcharts'
  import exportingInit from 'highcharts/modules/exporting'

  exportingInit(Highcharts)

  export default {
    name: "test",
    components: {
      highcharts: Chart
    },
    data() {
      return{
        chartOptions1: {
          title: {
            text: '2010 ~ 2016 年太阳能行业就业人员发展情况'
          },
          subtitle: {
            text: '数据来源:thesolarfoundation.com'
          },
          yAxis: {
            title: {
              text: '就业人数'
            }
          },
          legend: {
            layout: 'vertical',
            align: 'right',
            verticalAlign: 'middle'
          },
          plotOptions: {
            series: {
              label: {
                connectorAllowed: false
              },
              pointStart: 2010
            }
          },
          series: [{
            name: '安装,实施人员',
            data: [43934, 52503, 57177, 69658, 97031, 119931, 137133, 154175]
          }, {
            name: '工人',
            data: [24916, 24064, 29742, 29851, 32490, 30282, 38121, 40434]
          }, {
            name: '销售',
            data: [11744, 17722, 16005, 19771, 20185, 24377, 32147, 39387]
          }, {
            name: '项目开发',
            data: [null, null, 7988, 12169, 15112, 22452, 34400, 34227]
          }, {
            name: '其他',
            data: [12908, 5948, 8105, 11248, 8989, 11816, 18274, 18111]
          }],
          responsive: {
            rules: [{
              condition: {
                maxWidth: 500
              },
              chartOptions: {
                legend: {
                  layout: 'horizontal',
                  align: 'center',
                  verticalAlign: 'bottom'
                }
              }
            }]
          }
        }
      }
    }
  }
</script>

<style scoped>

</style>
打开页面,效果如下:

如果需要去除右下角的水印,以及右上角的打印以及下载功能。添加
credits: {
  enabled: false
},
exporting: { enabled:false },
test.vue完整代码如下:
<template>
  <div>
    <highcharts :options="chartOptions1"></highcharts>
  </div>
</template>

<script>
  import {Chart} from 'highcharts-vue'
  import Highcharts from 'highcharts'
  import exportingInit from 'highcharts/modules/exporting'

  exportingInit(Highcharts)

  export default {
    name: "test",
    components: {
      highcharts: Chart
    },
    data() {
      return{
        chartOptions1: {
          credits: {
            enabled: false
          },
          exporting: { enabled:false },
          title: {
            text: '2010 ~ 2016 年太阳能行业就业人员发展情况'
          },
          subtitle: {
            text: '数据来源:thesolarfoundation.com'
          },
          yAxis: {
            title: {
              text: '就业人数'
            }
          },
          legend: {
            layout: 'vertical',
            align: 'right',
            verticalAlign: 'middle'
          },
          plotOptions: {
            series: {
              label: {
                connectorAllowed: false
              },
              pointStart: 2010
            }
          },
          series: [{
            name: '安装,实施人员',
            data: [43934, 52503, 57177, 69658, 97031, 119931, 137133, 154175]
          }, {
            name: '工人',
            data: [24916, 24064, 29742, 29851, 32490, 30282, 38121, 40434]
          }, {
            name: '销售',
            data: [11744, 17722, 16005, 19771, 20185, 24377, 32147, 39387]
          }, {
            name: '项目开发',
            data: [null, null, 7988, 12169, 15112, 22452, 34400, 34227]
          }, {
            name: '其他',
            data: [12908, 5948, 8105, 11248, 8989, 11816, 18274, 18111]
          }],
          responsive: {
            rules: [{
              condition: {
                maxWidth: 500
              },
              chartOptions: {
                legend: {
                  layout: 'horizontal',
                  align: 'center',
                  verticalAlign: 'bottom'
                }
              }
            }]
          }
        }
      }
    }
  }
</script>

<style scoped>

</style>
刷新页面,效果如下:

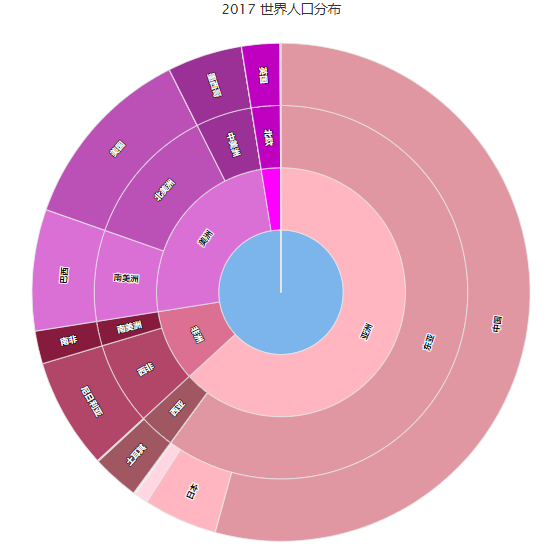
旭日图
注意:旭日图需要加载sunburst.js,因此需要在vue中,导入一下。
test.vue
<template>
<div>
<highcharts :options="chartOptions1"></highcharts>
</div>
</template>
<script>
import {Chart} from 'highcharts-vue'
import Highcharts from 'highcharts'
import exportingInit from 'highcharts/modules/exporting'
exportingInit(Highcharts)
import sunburstInit from 'highcharts/modules/sunburst'
sunburstInit(Highcharts)
export default {
name: "test",
components: {
highcharts: Chart
},
data() {
return{
chartOptions1: {
credits: {
enabled: false
},
exporting: { enabled:false },
chart: {
height: '100%'
},
title: {
text: '2017 世界人口分布'
},
subtitle: {
text: ''
},
series: [{
type: "sunburst",
data: [
{
"id":"0.0",
"parent":"",
"name":"The World"
},
{
"id":"1.3",
"parent":"0.0",
"name":"亚洲",
"color":"#FFB6C1"
},
{
"id":"1.1",
"parent":"0.0",
"name":"非洲",
"color":"#DB7093"
},
{
"id":"1.2",
"parent":"0.0",
"name":"美洲",
"color":"#DA70D6"
},
{
"id":"1.4",
"parent":"0.0",
"name":"欧洲",
"color":"#FF00FF"
},
{
"id":"1.5",
"parent":"0.0",
"name":"大洋洲",
"color":"#BA55D3"
},
{
"id":"2.1",
"parent":"1.1",
"name":"东非"
},
{
"id":"3.20",
"parent":"2.1",
"name":"塞舌尔群岛",
"value":94737
},
{
"id":"2.5",
"parent":"1.1",
"name":"西非"
},
{
"id":"3.42",
"parent":"2.5",
"name":"尼日利亚",
"value":190886311
},
{
"id":"3.36",
"parent":"2.3",
"name":"西撒哈拉",
"value":552628
},
{
"id":"2.4",
"parent":"1.1",
"name":"南美洲"
},
{
"id":"3.37",
"parent":"2.4",
"name":"南非",
"value":56717156
},
{
"id":"2.9",
"parent":"1.2",
"name":"南美洲"
},
{
"id":"3.98",
"parent":"2.9",
"name":"巴西",
"value":209288278
},
{
"id":"2.8",
"parent":"1.2",
"name":"北美洲"
},
{
"id":"3.93",
"parent":"2.8",
"name":"美国",
"value":324459463
},
{
"id":"3.97",
"parent":"2.8",
"name":"圣皮埃尔和密克隆",
"value":6320
},
{
"id":"2.7",
"parent":"1.2",
"name":"中美洲"
},
{
"id":"3.85",
"parent":"2.7",
"name":"墨西哥",
"value":129163276
},
{
"id":"2.6",
"parent":"1.2",
"name":"加勒比海"
},
{
"id":"3.83",
"parent":"2.6",
"name":"安圭拉",
"value":14909
},
{
"id":"3.84",
"parent":"2.6",
"name":"蒙特塞拉特",
"value":5177
},
{
"id":"2.13",
"parent":"1.3",
"name":"南亚"
},
{
"id":"3.144",
"parent":"2.13",
"name":"马尔代夫",
"value":436330
},
{
"id":"2.11",
"parent":"1.3",
"name":"东亚"
},
{
"id":"3.117",
"parent":"2.11",
"name":"中国",
"value":1441131303
},
{
"id":"3.118",
"parent":"2.11",
"name":"日本",
"value":127484450
},
{
"id":"3.121",
"parent":"2.11",
"name":"台湾省(中国)",
"value":23626456
},
{
"id":"3.123",
"parent":"2.11",
"name":"蒙古",
"value":3075647
},
{
"id":"2.12",
"parent":"1.3",
"name":"东南亚"
},
{
"id":"3.135",
"parent":"2.12",
"name":"文莱",
"value":428697,
"color":""
},
{
"id":"2.14",
"parent":"1.3",
"name":"西亚"
},
{
"id":"3.145",
"parent":"2.14",
"name":"土耳其",
"value":80745020
},
{
"id":"3.161",
"parent":"2.14",
"name":"巴林王国",
"value":1492584
},
{
"id":"2.15",
"parent":"1.4",
"name":"东欧"
},
{
"id":"2.16",
"parent":"1.4",
"name":"北欧"
},
{
"id":"3.173",
"parent":"2.16",
"name":"英国",
"value":66181585
},
{
"id":"3.185",
"parent":"2.16",
"name":"法罗群岛",
"value":49290
},
{
"id":"3.201",
"parent":"2.17",
"name":"梵蒂冈城",
"value":792
},
{
"id":"3.210",
"parent":"2.18",
"name":"列支敦士登",
"value":37922
},
{
"id":"2.19",
"parent":"1.5",
"name":"澳大利亚和新西兰"
},
{
"id":"2.20",
"parent":"1.5",
"name":"美拉尼西亚"
},
{
"id":"3.217",
"parent":"2.20",
"name":"瓦努阿图",
"value":276244
},
{
"id":"2.21",
"parent":"1.5",
"name":"密克罗尼西亚"
},
{
"id":"3.224",
"parent":"2.21",
"name":"瑙鲁",
"value":11359
},
{
"id":"2.22",
"parent":"1.5",
"name":"波利尼西亚"
},
{
"id":"3.225",
"parent":"2.22",
"name":"法属波利尼西亚",
"value":283007
}
],
allowDrillToNode: true,
cursor: 'pointer',
dataLabels: {
/**
* A custom formatter that returns the name only if the inner arc
* is longer than a certain pixel size, so the shape has place for
* the label.
*/
formatter: function () {
var shape = this.point.node.shapeArgs;
var innerArcFraction = (shape.end - shape.start) / (2 * Math.PI);
var perimeter = 2 * Math.PI * shape.innerR;
var innerArcPixels = innerArcFraction * perimeter;
if (innerArcPixels > 16) {
return this.point.name;
}
}
},
levels: [{
level: 2,
colorByPoint: true,
dataLabels: {
rotationMode: 'parallel'
}
},
{
level: 3,
colorVariation: {
key: 'brightness',
to: -0.5
}
}, {
level: 4,
colorVariation: {
key: 'brightness',
to: 0.5
}
}]
}],
tooltip: {
headerFormat: "",
pointFormat: '<b>{point.name}</b>:<b>{point.value}</b>'
}
}
}
}
}
</script>
<style scoped>
</style>
效果图如下:


【推荐】国内首个AI IDE,深度理解中文开发场景,立即下载体验Trae
【推荐】编程新体验,更懂你的AI,立即体验豆包MarsCode编程助手
【推荐】抖音旗下AI助手豆包,你的智能百科全书,全免费不限次数
【推荐】轻量又高性能的 SSH 工具 IShell:AI 加持,快人一步
· 开发者必知的日志记录最佳实践
· SQL Server 2025 AI相关能力初探
· Linux系列:如何用 C#调用 C方法造成内存泄露
· AI与.NET技术实操系列(二):开始使用ML.NET
· 记一次.NET内存居高不下排查解决与启示
· Manus重磅发布:全球首款通用AI代理技术深度解析与实战指南
· 被坑几百块钱后,我竟然真的恢复了删除的微信聊天记录!
· 没有Manus邀请码?试试免邀请码的MGX或者开源的OpenManus吧
· 园子的第一款AI主题卫衣上架——"HELLO! HOW CAN I ASSIST YOU TODAY
· 【自荐】一款简洁、开源的在线白板工具 Drawnix
2018-05-31 python 全栈开发,Day53(jQuery的介绍,jQuery的选择器,jQuery动画效果)