promethus监控nginx
一、摘要
promethues监控nginx可选两个exporter,通过nginx_exporter主要是获取nginx-status中的内建的指标,nginx自身提供status信息,较为简单,promethues中对应的metrics也较少,想要监控更多的指标可以通过nginx-vts-exporter采集信息,依赖在编译nginx的时候添加nginx-module-vts模块来实现。
nginx virtual host traffic status模块是nginx第三方模块之一,vts提供了访问虚拟主机状态的信息,包含server,upstream以及cache的当前状态,类似于NGINX Plus 提供的在线活动监控功能。
二、Nginx_exporter安装
下载链接:
https://github.com/discordianfish/nginx_exporter
nginx_exporter.go,需要使用go语言环境将源码编译成二进制可执行文件。
虽然我尝试安装了golang,使用
go build 代码.go
build编译未能成功,果断放弃了。
这里,介绍一个很简单的办法,先下载nginx_exporter的docker镜像。
docker pull fish/nginx-exporter
先run一下,执行之后,会hold住,先不要关闭窗口。
docker run -it fish/nginx-exporter
新开一个窗口,查看docker进程
root@ubuntu:~# docker ps|grep nginx-exporter
5baa06db43d9        fish/nginx-exporter   "/usr/local/bin/ngin…"   13 minutes ago      Up 13 minutes       9113/tcp            lucid_germain
复制编译后的文件到/opt
docker cp 5baa06db43d9:/usr/local/bin/nginx_exporter /opt/
执行帮助命令:

root@ubuntu:~# /opt/nginx_exporter --help
Usage of /opt/nginx_exporter:
  -insecure
        Ignore server certificate if using https (default true)
  -nginx.scrape_uri string
        URI to nginx stub status page (default "http://localhost/nginx_status")
  -telemetry.address string
        Address on which to expose metrics. (default ":9113")
  -telemetry.endpoint string
        Path under which to expose metrics. (default "/metrics")
如果能执行成功,说明脚本可以运行了。
然后使用Ctrl+c 关闭docker容器。
三、Nginx开启状态
在线安装nginx
安装nginx
apt-get install -y nginx
编译安装nginx
wget -c http://mirror.nienbo.com/nginx/nginx-1.12.1.tar.gz
tar -zxvf nginx-1.12.1.tar.gz
cd nginx-1.12.1
./configure --prefix=/usr/local/nginx --with-http_stub_status_module
make
make install
编辑配置文件
vi /etc/nginx/sites-enabled/status.conf
注意:这是在线安装nginx的路径。请根据实际情况修改。
内容如下:
server {
       listen 8011;
       server_name localhost;
       location /nginx_status {
           stub_status on;
           access_log off;
           allow 127.0.0.1;
       }
}
重新加载配置文件
nginx -s reload
访问nginx状态页面
root@ubuntu:/etc/nginx/sites-enabled# curl 127.0.0.1:8011/nginx_status
Active connections: 2
server accepts handled requests
 6 6 15
Reading: 0 Writing: 1 Waiting: 1
四、nginx_exporter封装service服务
创建nginx_exporter目录,移动文件
mkdir -p /etc/nginx_exporter/bin/
mv /opt/nginx_exporter /etc/nginx_exporter/bin/
封装service
vim /lib/systemd/system/nginx_exporter.service
内容如下:
[Unit]
Description=nginx monitor
After=network.target

[Service]
ExecStart=/etc/nginx_exporter/bin/nginx_exporter -nginx.scrape_uri="http://127.0.0.1:8011/nginx_status"
ExecStop=-/sbin/start-stop-daemon --quiet --stop --retry QUIT/5
TimeoutStopSec=5
KillMode=mixed

[Install]
WantedBy=multi-user.target
重新加载service配置文件,设置开机自启动,并启动服务
systemctl daemon-reload
systemctl enable nginx_exporter.service
systemctl start nginx_exporter.service
查看端口
root@ubuntu:/etc/nginx/sites-enabled# netstat -anpt|grep nginx_exporte
tcp        0      0 127.0.0.1:33780         127.0.0.1:8011          ESTABLISHED 19006/nginx_exporte
tcp6       0      0 :::9113                 :::*                    LISTEN      19006/nginx_exporte
tcp6       0      0 192.168.1.24:9113       172.17.0.2:50776        ESTABLISHED 19006/nginx_exporte
使用网页访问metrics
http://192.168.1.24:9113/metrics
效果如下:
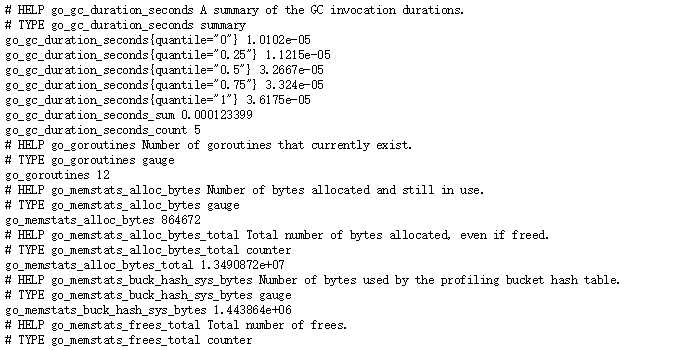
如果数据输出正常,则表示成功。
五、promethus增加job
vim /opt/prometheus/prometheus.yml
增加以下内容:
- job_name: nginx_exporter
static_configs:
  - targets:
    - 192.168.1.24:9113
    labels:
      instance: nginx-24
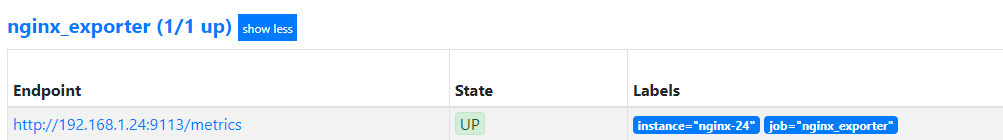
重启prometheus,访问页面:
http://192.168.1.24:9090/targets
确保nginx_exporter状态为UP
六、Grafana导入Dashboards
下载json文件
https://files.cnblogs.com/files/xiao987334176/Nginx%E7%9B%91%E6%8E%A7-1563001010074.zip
解压之后,里面就是一个json文件
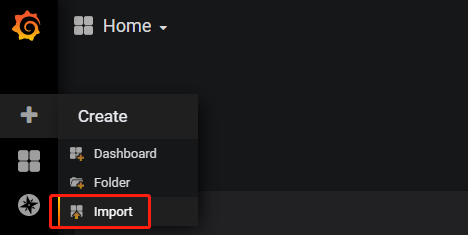
点击import
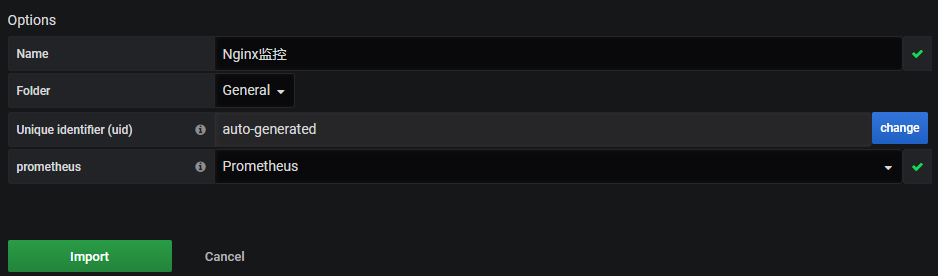
上传json文件,设置Name,选择prometheus,点击import
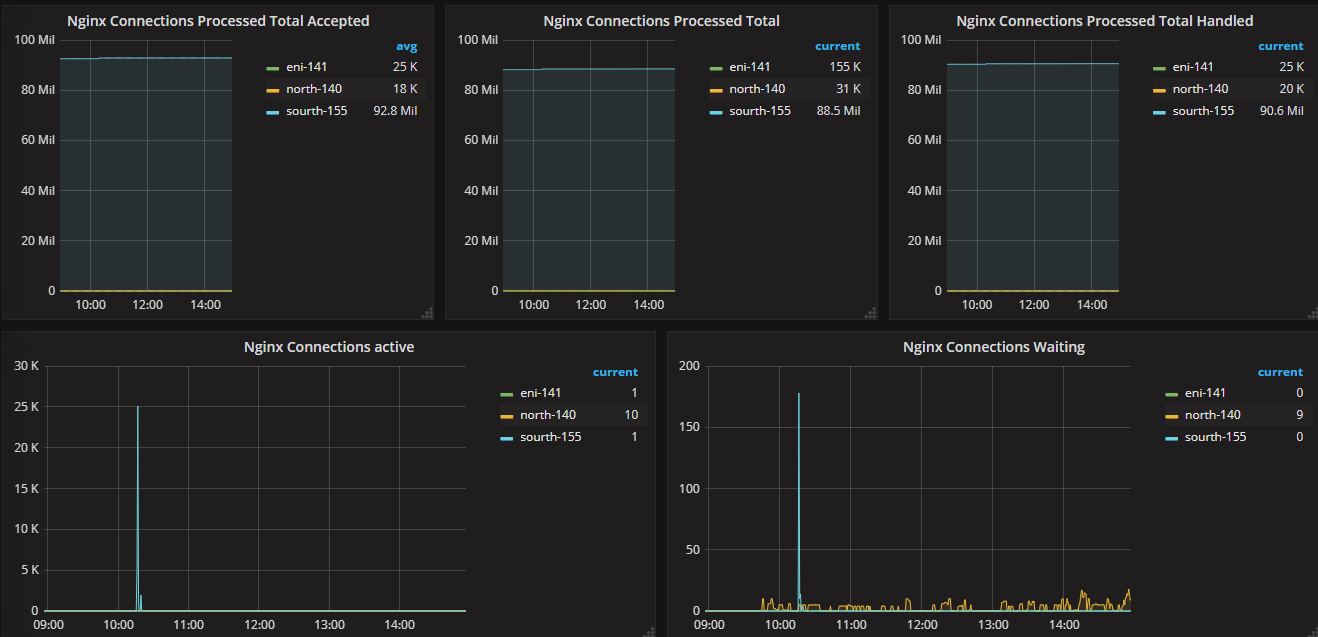
等待一段时间,数据多了之后,效果如下:
注意:TOP10 是没有数据的,据说需要使用脚本实现,具体怎么实现,我也不太清理。
可以直接将没有数据的图标删除掉!
本文参考链接:
https://it.baiked.com/nginx/2697.html


【推荐】国内首个AI IDE,深度理解中文开发场景,立即下载体验Trae
【推荐】编程新体验,更懂你的AI,立即体验豆包MarsCode编程助手
【推荐】抖音旗下AI助手豆包,你的智能百科全书,全免费不限次数
【推荐】轻量又高性能的 SSH 工具 IShell:AI 加持,快人一步
· 开发者必知的日志记录最佳实践
· SQL Server 2025 AI相关能力初探
· Linux系列:如何用 C#调用 C方法造成内存泄露
· AI与.NET技术实操系列(二):开始使用ML.NET
· 记一次.NET内存居高不下排查解决与启示
· Manus重磅发布:全球首款通用AI代理技术深度解析与实战指南
· 被坑几百块钱后,我竟然真的恢复了删除的微信聊天记录!
· 没有Manus邀请码?试试免邀请码的MGX或者开源的OpenManus吧
· 园子的第一款AI主题卫衣上架——"HELLO! HOW CAN I ASSIST YOU TODAY
· 【自荐】一款简洁、开源的在线白板工具 Drawnix
2018-07-12 python 全栈开发,Day82(点赞和踩灭,用户评论)