《机器学习实战》之K-近邻算法
K-近邻算法实现:
from numpy import *
import operator
from os import listdir
#数据集
def createDataSet():
    group = array([[1.0,1.1],[1.0,1.0],[0,0],[0,0.1]])
    labels = ['A','A','B','B']
    return group, labels

#调用
group,labels = createDataSet()
print('x:',group)
print('y:',labels)
print('………………')

#k-近邻算法,四个参数:用于分类的输入向量(新输入数据),输入的训练样本集,标签向量,用于选择最近邻居的数目
def classify0(inX, dataSet, labels, k):
    #返回行数
    dataSetSize = dataSet.shape[0]
    #新输入的数据减去训练样本集
    diffMat = tile(inX, (dataSetSize,1)) - dataSet
    #计算平方
    sqDiffMat = diffMat**2
    #计算平方和
    sqDistances = sqDiffMat.sum(axis=1)
    #对平方和开方
    distances = sqDistances**0.5
    #distances从小到大排序
    sortedDistIndicies = distances.argsort()
    classCount={}
    #只对距离最短的前K个点遍历
    for i in range(k):
        voteIlabel = labels[sortedDistIndicies[i]]
        #计算出现的频率
        classCount[voteIlabel] = classCount.get(voteIlabel,0) + 1
    #以出现的频率进行排序,从大到小
    sortedClassCount = sorted(classCount.iteritems(), key=operator.itemgetter(1), reverse=True)
    #返回出现频率最大的分类
    return sortedClassCount[0][0]

#解析文本信息
def file2matrix(filename):
    fr = open(filename)
    #获取文本行数
    numberOfLines = len(fr.readlines())
    #创建以0填充的矩阵,为简化处理将该矩阵的另一维设置为固定值3
    returnMat = zeros((numberOfLines,3))
    classLabelVector = []
    fr = open(filename)
    index = 0
    for line in fr.readlines():
        line = line.strip()
        listFromLine = line.split('\t')
        #将x的所有column取出
        returnMat[index,:] = listFromLine[0:3]
        #将y取出
        classLabelVector.append(int(listFromLine[-1]))
        index += 1
    return returnMat,classLabelVector

#调用
filename = "F://python入门//文件//machinelearninginaction//Ch02//datingTestSet2.txt"
datingDataMat,datingLabels = file2matrix(filename)
print('x对应的数据集为:\n',datingDataMat[:10])
print('y对应的数据集为:\n',datingLabels[:10])
print('………………')

#使用Matplotlib创建散点图
#import matplotlib
import matplotlib.pyplot as plt
fig = plt.figure()
ax = fig.add_subplot(111)
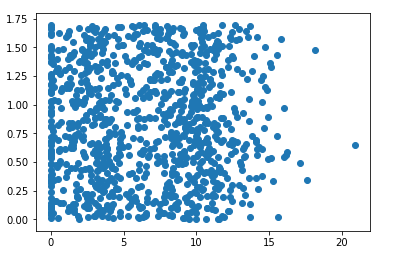
ax.scatter(datingDataMat[:,1],datingDataMat[:,2])
plt.show()
print('………………')
import matplotlib.pyplot as plt
fig = plt.figure()
ax = fig.add_subplot(111)
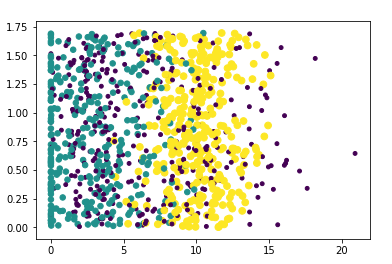
ax.scatter(datingDataMat[:,1],datingDataMat[:,2],\
           15.0*array(datingLabels),15.0*array(datingLabels))
plt.show()
print('………………')

#准备数据:归一化数值
def autoNorm(dataSet):
    minVals = dataSet.min(0)
    maxVals = dataSet.max(0)
    #最大值减最小值
    ranges = maxVals - minVals
    normDataSet = zeros(shape(dataSet))
    m = dataSet.shape[0]
    #tile()函数将变量内容复制成输入矩阵同样大小的矩阵
    normDataSet = dataSet - tile(minVals, (m,1))
    normDataSet = normDataSet/tile(ranges, (m,1))
    #返回归一化的数值,范围,最小值
    return normDataSet, ranges, minVals

#调用
normMat,ranges,minVals = autoNorm(datingDataMat)
print('归一化后的数值:',normMat[:10])
print('范围:',ranges)
print('最小值:',minVals)
结果:
x: [[1.  1.1]
 [1.  1. ]
 [0.  0. ]
 [0.  0.1]]
y: ['A', 'A', 'B', 'B']
………………
x对应的数据集为:
 [[4.0920000e+04 8.3269760e+00 9.5395200e-01]
 [1.4488000e+04 7.1534690e+00 1.6739040e+00]
 [2.6052000e+04 1.4418710e+00 8.0512400e-01]
 [7.5136000e+04 1.3147394e+01 4.2896400e-01]
 [3.8344000e+04 1.6697880e+00 1.3429600e-01]
 [7.2993000e+04 1.0141740e+01 1.0329550e+00]
 [3.5948000e+04 6.8307920e+00 1.2131920e+00]
 [4.2666000e+04 1.3276369e+01 5.4388000e-01]
 [6.7497000e+04 8.6315770e+00 7.4927800e-01]
 [3.5483000e+04 1.2273169e+01 1.5080530e+00]]
y对应的数据集为:
 [3, 2, 1, 1, 1, 1, 3, 3, 1, 3]
………………

………………

………………
归一化后的数值: [[0.44832535 0.39805139 0.56233353]
 [0.15873259 0.34195467 0.98724416]
 [0.28542943 0.06892523 0.47449629]
 [0.82320073 0.62848007 0.25248929]
 [0.42010233 0.07982027 0.0785783 ]
 [0.79972171 0.48480189 0.60896055]
 [0.39385141 0.32652986 0.71533516]
 [0.46745478 0.63464542 0.32031191]
 [0.73950675 0.41261212 0.44153637]
 [0.38875681 0.58668982 0.88936006]]
范围: [9.1273000e+04 2.0919349e+01 1.6943610e+00]
最小值: [0.       0.       0.001156]


