【转】np.linspace()、np.logspace()、np.arange()
转自:https://blog.csdn.net/ui_shero/article/details/78881067
1.np.linspace() 生成(start,stop)区间指定元素个数num的list,均匀分布
Parameters
----------
start : scalar #scalar:标量
The starting value of the sequence.
stop : scalar
The end value of the sequence, unless `endpoint` is set to False.
In that case, the sequence consists of all but the last of ``num + 1``
evenly spaced samples, so that `stop` is excluded. Note that the step
size changes when `endpoint` is False.
num : int, optional #oprional:可选项
Number of samples to generate. Default is 50. Must benon-negative.
endpoint : bool, optional #是否包括右边界点
If True, `stop` is the last sample. Otherwise, it is not included.
Default is True.
retstep : bool, optional #返回步长
---------------------
作者:IT_Shero
来源:CSDN
原文:https://blog.csdn.net/ui_shero/article/details/78881067
版权声明:本文为博主原创文章,转载请附上博文链接!
-----------------------------------
np.linspace(2.0, 3.0, num=5, retstep=True)
(array([ 2. , 2.25, 2.5 , 2.75, 3. ]),0.25)
np.linspace(2.0, 3.0, num=5)
array([ 2. , 2.25, 2.5 , 2.75, 3. ])
np.linspace(2.0, 3.0, num=5, endpoint=False)
array([ 2. , 2.2, 2.4, 2.6, 2.8])
--------------------------------
import numpy as np
import matplotlib.pyplot as plt
N = 8
y = np.zeros(N)
x1 = np.linspace(0, 10, N, endpoint=True)
x2 = np.linspace(0, 10, N, endpoint=False)
plt.plot(x1, y, 'o')
plt.plot(x2, y + 0.5, 'o')
plt.ylim([-0.5, 1]) #设置y轴区间
(-0.5, 1)
plt.show()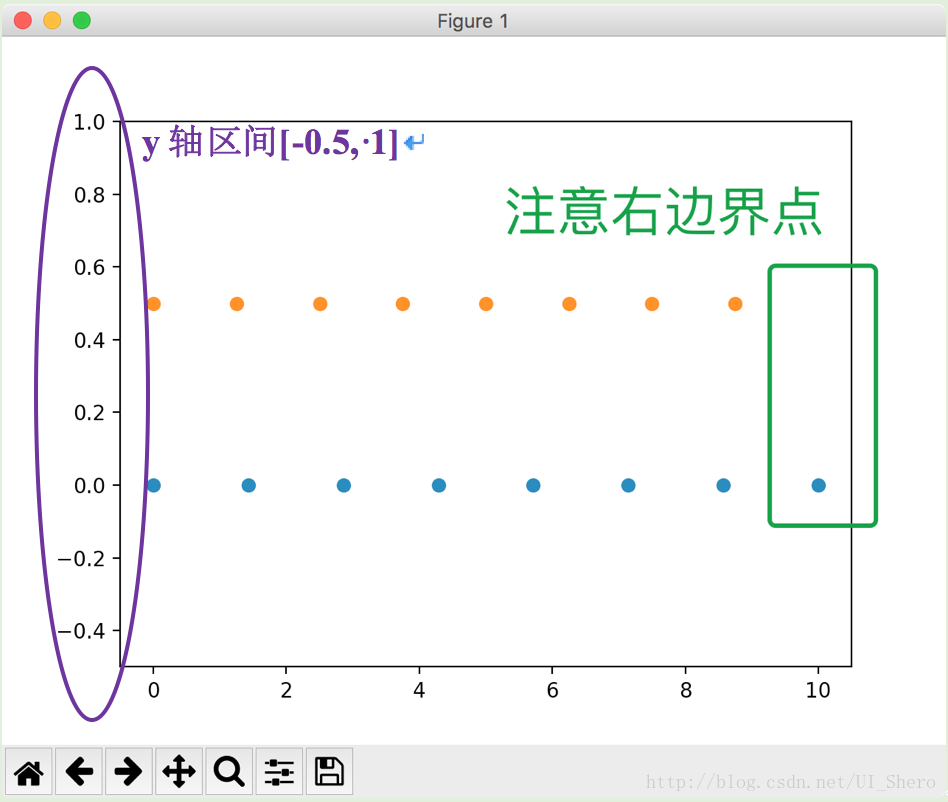
2.np.logspace() log分布间距生成list
Parameters
----------
start : float #基底base的start次幂作为左边界
``base ** start`` is the starting value of the sequence.
stop : float #基底base的stop次幂作为右边界
``base ** stop`` is the final value of the sequence, unless `endpoint`
is False. In that case, ``num + 1`` values are spaced over the
interval in log-space, of which all but the last (a sequence of
length ``num``) are returned.
num : integer, optional
Number of samples to generate. Default is 50.
endpoint : boolean, optional
If true, `stop` is the last sample. Otherwise, it is not included.
Default is True.
base : float, optional #基底
The base of the log space. The step size between the elements in
``ln(samples) / ln(base)`` (or ``log_base(samples)``) is uniform.
Default is 10.0.
dtype : dtype
The type of the output array. If `dtype` is not given, infer the data
type from the other input arguments.
---------------------
np.logspace(2.0, 3.0, num=4)
array([ 100. , 215.443469 , 464.15888336, 1000. ])
np.logspace(2.0, 3.0, num=4, endpoint=False)
array([ 100. , 177.827941 , 316.22776602, 562.34132519])
np.logspace(2.0, 3.0, num=4, base=2.0)
array([ 4. , 5.0396842 , 6.34960421, 8. ])
---------------------
import numpy as np
import matplotlib.pyplot as plt
N = 10
x1 = np.logspace(0.1, 1, N, endpoint=True)
x2 = np.logspace(0.1, 1, N, endpoint=False)
y = np.zeros(N)
plt.plot(x1, y, 'o')
plt.plot(x2, y + 0.5, '<')
plt.ylim([-0.5, 1])
(-0.5, 1)
plt.show()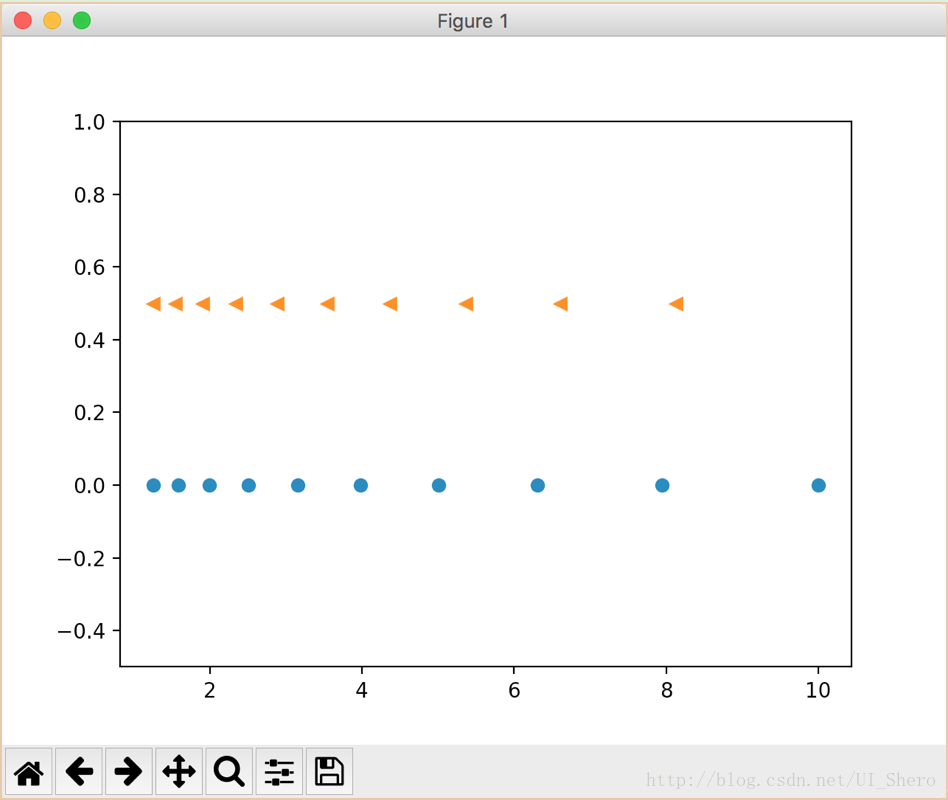
3.np.arange() 生成(start,stop)区间指定步长step的list
np.arange(3)
array([0, 1, 2])
np.arange(3.0)
array([ 0., 1., 2.])
np.arange(3,7)
array([3, 4, 5, 6])
np.arange(3,7,2)
array([3, 5])