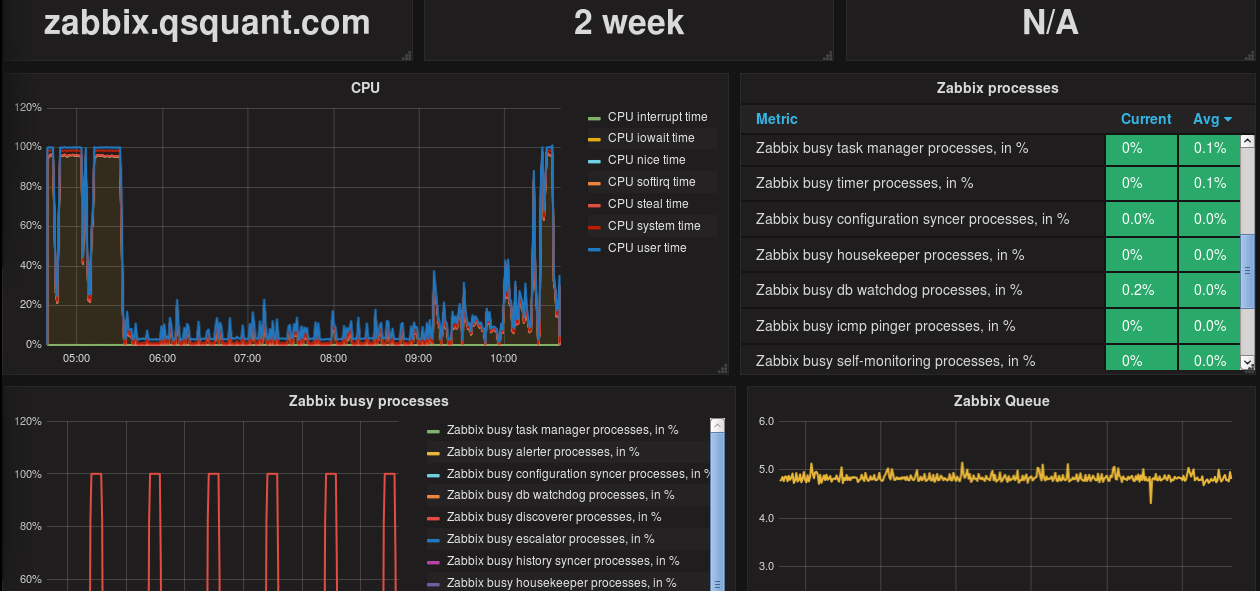
zabbix结合grafana打造炫酷监控界面
一、grafana介绍
grafana是一个开源的数据展示工具, 是一个开箱即用的可视化工具,具有功能齐全的度量仪表盘和图形编辑器,有灵活丰富的图形化选项,可以混合多种风格,支持多个数据源特点。
zabbix监控性能毋庸置疑,但也有很多人说zabbix图形显示过于简单、丑,因此用grafana显示zabbix中的数据再好不过了。
grafana使用超级简单,安装完成后登陆grafana添加数据源即可,后面的事情就是添加图表等工作了。
二、grafana安装
#安装grafana
yum install initscripts fontconfig -y
wget https://mirrors.tuna.tsinghua.edu.cn/grafana/yum/el6/grafana-4.5.1-1.x86_64.rpm -P /download/
cd /download
rpm -ivh grafana-4.5.1-1.x86_64.rpm
/sbin/chkconfig --add grafana-server
chkconfig grafana-server on
service grafana-server start

http://192.168.119.130:3000  #登陆查看grafana web页面,默认用户名&密码为admin

#安装zabbix插件
grafana-cli plugins list-remote
grafana-cli plugins install alexanderzobnin-zabbix-app
service grafana-server restart
cd /var/lib/grafana/plugins/
git clone https://github.com/alexanderzobnin/grafana-zabbix-app
service grafana-server restart
cd grafana-zabbix-app/
git pull
service grafana-server restart
三、配置grafana
以下两个链接介绍安装和创建图表非常详细
https://yq.aliyun.com/articles/60738
http://www.jianshu.com/p/6eec985c5c94
四、仪表盘显示模板


