vue 引简单引入echarts图表
第一步:安装echarts依赖
cnpm install echarts -S第二步:在main.js中全局引入
import * as echarts from 'echarts';
Vue.prototype.$echarts = echarts
第三步:为你的echarts 图表定义一个div 盒子,设置好高度,宽度
<template>
  <div class="home" >
    <div id="main" style="height: 500px;width: 1000px"></div>
  </div>
</template>
第四步:编写一个方法
 drawChart () {
      const myEchart = this.$echarts.init(document.getElementById('main'))
      const option = {
        title: {
          text: 'Stacked Line'
        },
        tooltip: {
          trigger: 'axis'
        },
        legend: {
          data: ['Email', 'Union Ads', 'Video Ads', 'Direct', 'Search Engine']
        },
        grid: {
          left: '3%',
          right: '4%',
          bottom: '3%',
          containLabel: true
        },
        toolbox: {
          feature: {
            saveAsImage: {}
          }
        },
        xAxis: {
          type: 'category',
          boundaryGap: false,
          data: ['Mon', 'Tue', 'Wed', 'Thu', 'Fri', 'Sat', 'Sun']
        },
        yAxis: {
          type: 'value'
        },
        series: [
          {
            name: 'Email',
            type: 'line',
            stack: 'Total',
            data: [120, 132, 101, 134, 90, 230, 210]
          },
          {
            name: 'Union Ads',
            type: 'line',
            stack: 'Total',
            data: [220, 182, 191, 234, 290, 330, 310]
          },
          {
            name: 'Video Ads',
            type: 'line',
            stack: 'Total',
            data: [150, 232, 201, 154, 190, 330, 410]
          },
          {
            name: 'Direct',
            type: 'line',
            stack: 'Total',
            data: [320, 332, 301, 334, 390, 330, 320]
          },
          {
            name: 'Search Engine',
            type: 'line',
            stack: 'Total',
            data: [820, 932, 901, 934, 1290, 1330, 1320]
          }
        ]
      }
      // eslint-disable-next-line no-debugger
      debugger
      myEchart.setOption(option)
    }
第五步:在构子函数中调用
  mounted () {
    this.drawChart()
  },
第六步:npm run serve 启动项目
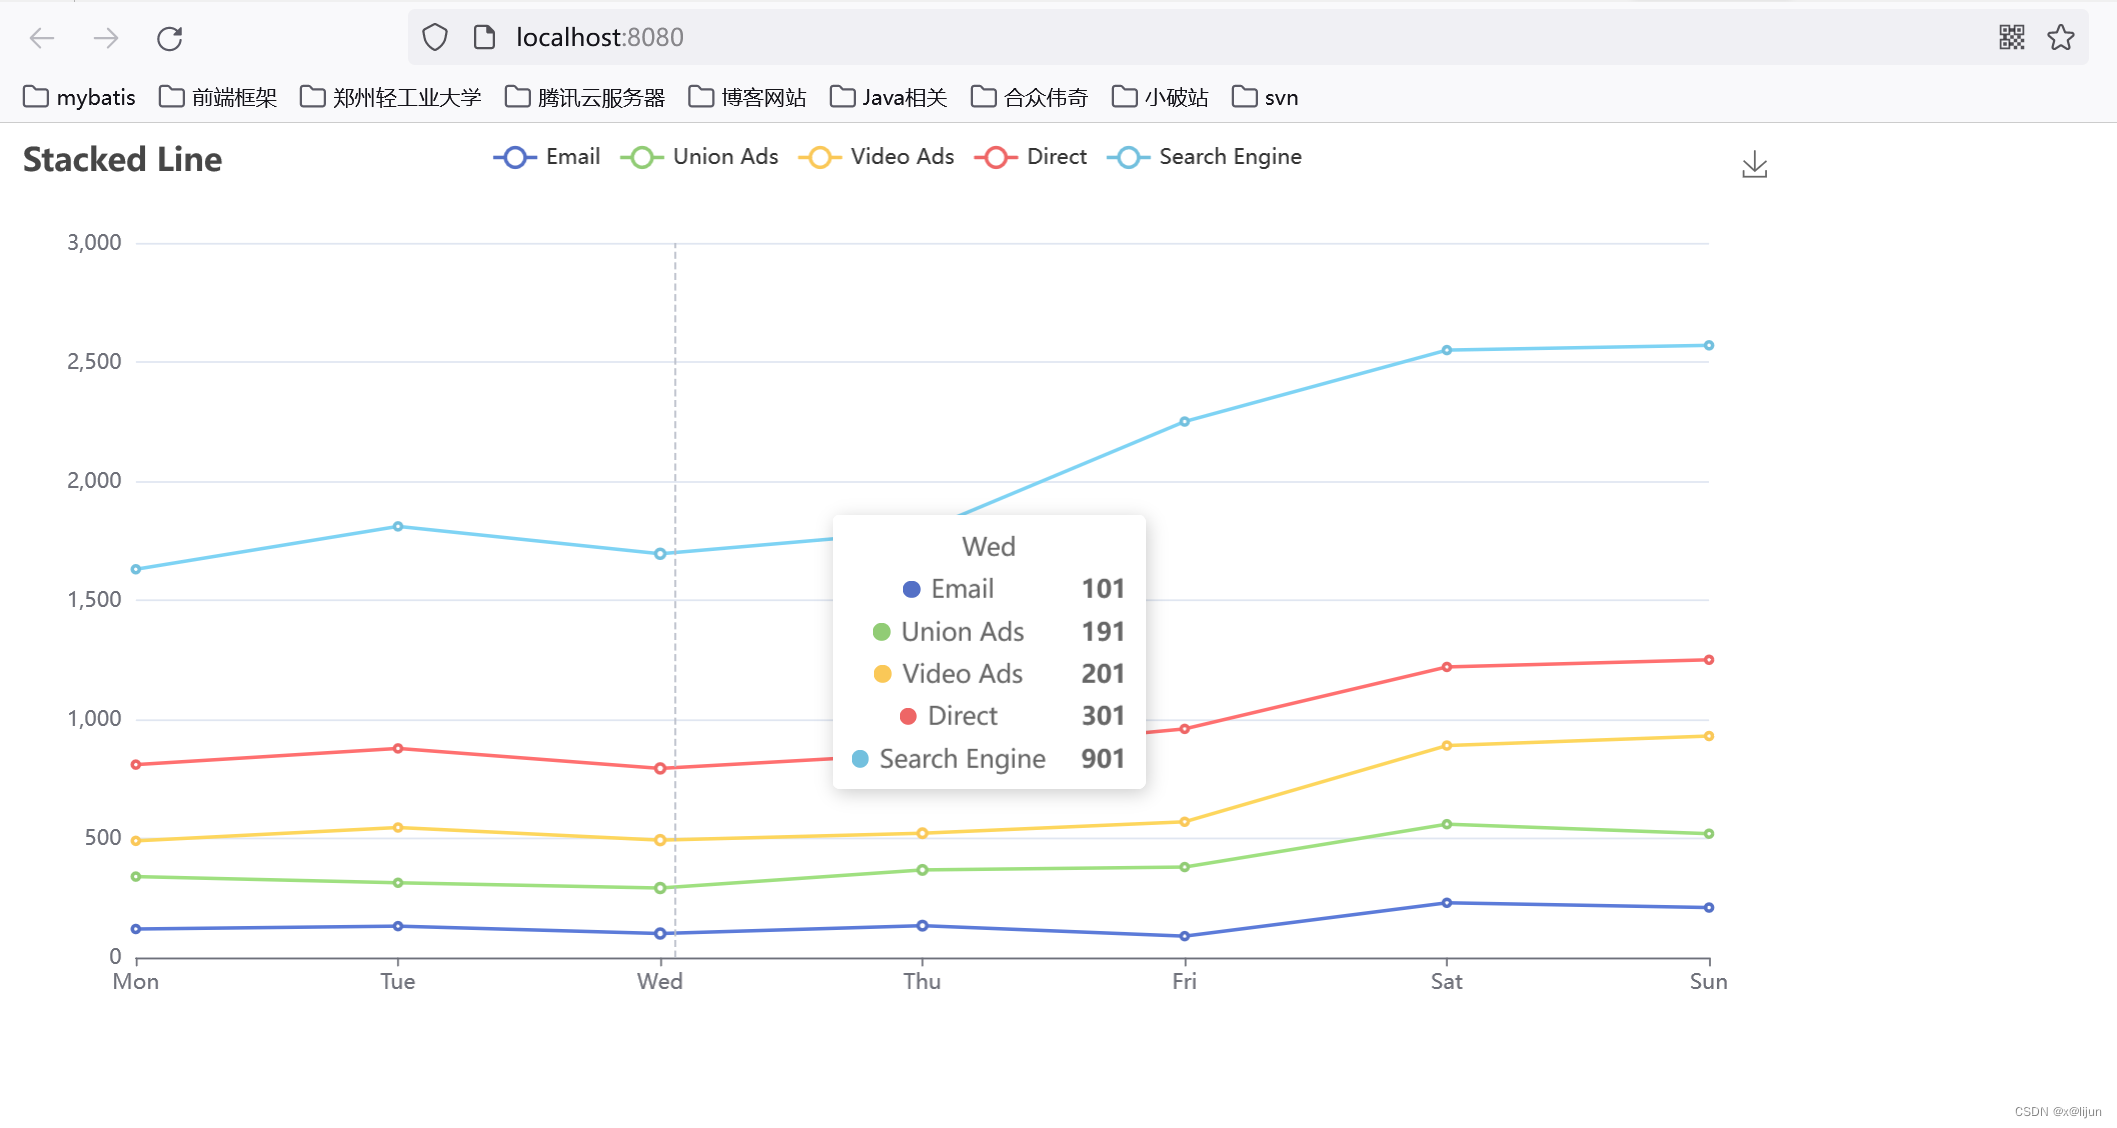
效果图如下: