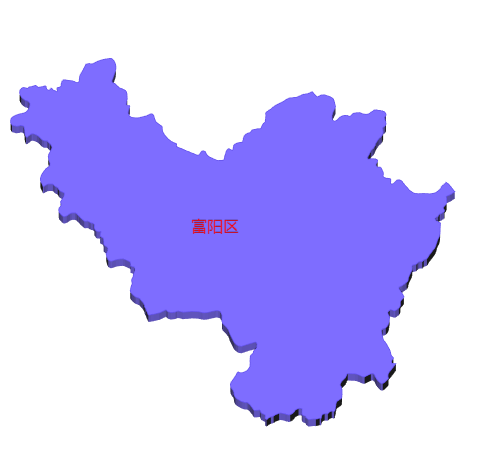
echarts 3D地图

地图选择器获取区域json数据(http://datav.aliyun.com/tools/atlas/#&lat=31.769817845138945&lng=104.29901249999999&zoom=4

import fuyang from  '../assets/fuyang.json'


zheJiang(){
      this.$echarts.registerMap("fuyang", fuyang);
      var img = new Image();
      // img.src = aa.aa
      img.width = '100%'
      img.height ='100%'
            // let imageDom = aa.aa
            let data = [
              [
                [119.5313, 29.8773],[120.498, 27.8119]
              ]
              
            ]
            var option = {
                backgroundColor: {
                  image:img
                },
                tooltip: {
                    trigger: 'item',
                    formatter: function(data){
                      console.log(data);
                    },
                },
                geo3D: {
                  viewControl: {
                    // rotateSensitivity: 0,
                    projection: 'orthographic',
                    // orthographicSize: 110, //控制地图大小
                    // maxOrthographicSize: 110,
                    // minOrthographicSize: 110,
                    // autoRotate:false,
                    // animation:true,
                    alpha:60,
                    beta:10,
                    animationDurationUpdate:10
                  },
                  map: 'fuyang',
                  roam: false,
                 itemStyle: {
                          areaColor: '#65e',
                          shadowColor: '#65e',
                          // opacity: 0.2,
                          borderWidth: 0.8,
                          borderColor: '#65e'
                      },
                  label: {
                      show: true,
                      textStyle: {
                          color: '#f00', //地图初始化区域字体颜色
                          fontSize: 16,
                          // opacity: 1,
                          backgroundColor: 'rgba(0,0,0,0)'
                      },
                  },
                  emphasis: { //当鼠标放上去  地区区域是否显示名称
                      itemStyle: {
                          areaColor: '#65e',
                          shadowColor: '#65e',
                          // opacity: 0.2,
                          borderWidth: 0.8,
                          borderColor: '#31e4ff'
                      },
                      label: {
                          show: true,
                          textStyle: {
                              color: '#fff',
                              fontSize: 16,
                              backgroundColor: 'rgba(0,23,11,0)'
                          }
                      }
                  },
                  shading: 'lambert',
                  light: { //光照阴影
                      main: {
                          color: '#65e', //光照颜色
                      // shadowColor: '#f00',
                          intensity: 1.2, //光照强度
                          //shadowQuality: 'high', //阴影亮度
                          shadow: true, //是否显示阴影
                          alpha: 55,
                          beta: 10
                      },
                      ambient: {
                          intensity: 0.1
                      }
                  },
                  realisticMaterial:{
                      detailTexture:'./images/bg.jpg'
                  }
              },
              series: {
                 name: 'ss',
                    type: 'lines3D',
                    
                    coordinateSystem: 'geo3D',
                    data: data,
                    color: {
                        // image: imageDom, // 支持为 HTMLImageElement, HTMLCanvasElement,不支持路径字符串
                        repeat: 'repeat' // 是否平铺, 可以是 'repeat-x', 'repeat-y', 'no-repeat'
                    },
                    itemStyle: {
                      normal: {
                        areaColor: '#65e'
                      }
                    }
              }
            };

        
        this.myChart4 = this.$echarts.init(this.$refs.zhejiangMap);
        this.myChart4.setOption(option);
        this.myChart4.on('click', function(e){
          console.log(e);
        })
    }


posted @ 2020-08-15 17:35  番茄西红柿u  阅读(1349)  评论(0编辑  收藏  举报