


柱状图配置项
1. 堆叠形式柱状图
var option = {
xAxis: [
{
type: "category",
// boundaryGap: true,//x轴左右留间距
axisLabel: {
color: '#02AEC0',
fontSize: 12,
},
// 坐标轴
axisLine: {
show: true,
lineStyle: {
color: "rgba(87, 209, 245, 0.5)",
},
},
axisTick: {
show: false,
},
splitLine: {
show: false,
},
data: ['一', '二', '三', '四'],
},
],
            yAxis: {
                type: 'value',
name: "㎡",
nameTextStyle: {
fontSize: 12,
color: "#02AEC0",
},
//坐标轴顶部设置箭头样式
axisLine: {
show: true,
lineStyle: {
shadowOffsetY: -14,
shadowColor: "rgba(87, 209, 245, 0.8)",
color: '#02AEC0',
width: 1,
},
symbol: ['none', 'arrow'], //箭头一端没效果,一端箭头
symbolOffset: 14, //箭头段移动8个像素
symbolSize: [7, 7]
},
            },
            series: [
                {
                    name: "柱状图1",
                    type: 'bar',
                    barWidth: 10,
                    stack: "car",
                    data: [12, 12, 12, 12]
                },
                {
                    name: "柱状图2",
                    type: 'bar',
                    barWidth: 10,
                    stack: "car",
                    itemStyle: {
                        normal: {
                            color: new echarts.graphic.LinearGradient(0, 0, 0, 1, [
                                {
                                    offset: 0,
                                    color: "rgba(249,255,59,1)",
                                },
                                {
                                    offset: 1,
                                    color: "rgba(15,38,35,0.2)",
                                },
                            ]),
                        },
                    },
                    data: [12, 12, 12, 12]
                },
            ]
        }
坐标轴样式配置:
axisLabel:坐标轴轴文字样式
axisLine:坐标轴轴线的样式
axisTick:刻度线样式
splitLine: 网格线样式 (箭头配置)
nameTextStyle: 轴顶部单位样式
*. 渐变: color: new echarts.graphic.LinearGradient(0, 0, 0, 1,[])
分别表示右,下,左,上。例如(0,0,0,1)表示从正上开始向下渐变
*. barGap: 如果想要两个系列的柱子重叠,可以设置 barGap 为 ‘-100%’。这在用柱子做背景的时候有用。
1. 上下堆叠柱状图
eg: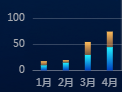
stack:属性值设置为相同时,实现上下堆叠展示
2. 柱子过多可使用滚动条展示
eg: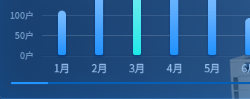
dataZoom:区域缩放
option = {
    ...
    dataZoom: [
                {
                    type: "slider",
                    show: true,
                    zoomLock: true,
                    orient: "horizontal",
                    filterMode: "none",
                    bottom: "6%",
                    start: 0,
                    end: 40,
                    textStyle: {
                        color: "#FFF",
                        fontSize: 9,
                    },
                    height: 3,
                    fillerColor: "rgba(65, 168, 255, 1)",
                    brushSelect: false,
                    handleIcon:
                        "path://M30.9,53.2C16.8,53.2,5.3,41.7,5.3,27.6S16.8,2,30.9,2C45,2,56.4,13.5,56.4,27.6S45,53.2,30.9,53.2z M30.9,3.5M36.9,35.8h-1.3z M27.8,35.8 h-1.3H27L27.8,35.8L27.8,35.8z", // 画一个圆形
                    handleSize: "100%",
                    handleStyle: {
                        color: "rgba(65, 168, 255, 1)",
                        borderWidth: 0,
                    },
                    backgroundColor: "rgba(0, 91, 169, 1)", //两边未选中的滑动条区域的颜色

                    borderColor: "transparent",
                    showDataShadow: false,
                },
            ],
}

