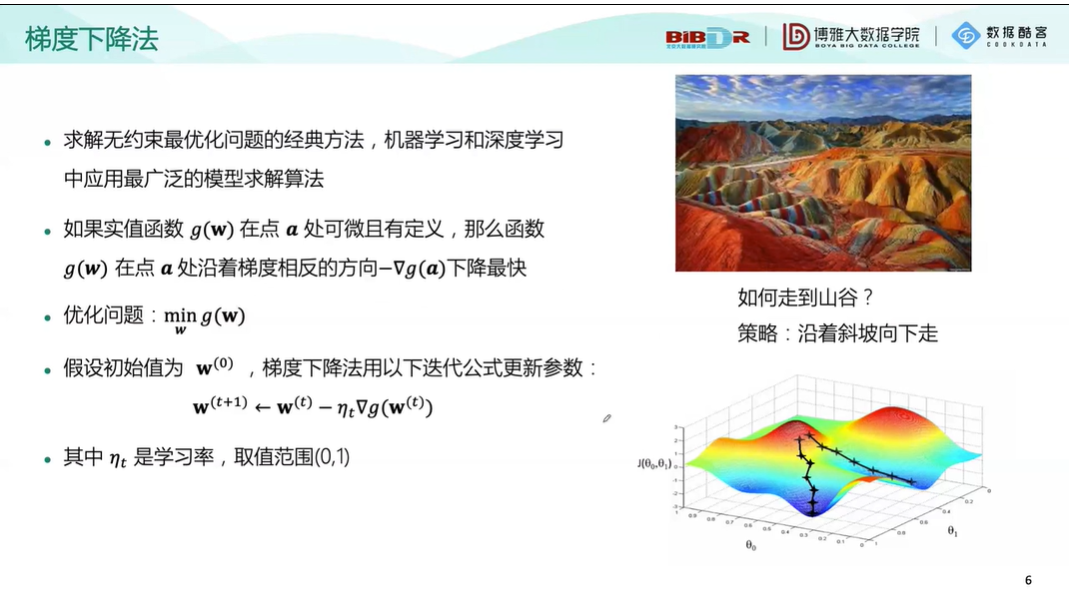
机器学习十讲第三讲
本讲开始讲了梯度下降算法和最大似然估计算法。


from sklearn import datasets
random_samples = datasets.make_classification(n_samples=60, #样本数量
                                              n_classes=2, #类别数量
                                              n_features=2, #特征数量
                                              n_informative=2,#有信息特征数量
                                              n_redundant=0, #冗余特征数量
                                              n_repeated=0, # 重复特征数量
                                              n_clusters_per_class=1, #每一类的簇数
                                              flip_y=0, # 样本标签随机分配的比例
                                              class_sep=3,#不同类别样本的分散程度
                                              random_state=203)
import pandas as pd
data = pd.DataFrame(data=random_samples[0],columns=["x1","x2"])
data["label"] = random_samples[1]
data["ones"] = 1
print(data.head())
data["label"] = data["label"].map({0:-1,1:1})
data_pos = data[data["label"]==1]
data_neg = data[data["label"]==-1]
import matplotlib.pyplot as plt
import numpy as np
w = [1,1,-4]
x1 = np.linspace(-6,6,50)
x2 = -(w[0]/w[1])*x1 - w[2]/w[1]
plt.figure(figsize=(8,8))
plt.scatter(data_pos["x1"],data_pos["x2"],c="#E4007F",marker="^")
plt.scatter(data_neg["x1"],data_neg["x2"],c="#007979",marker="o")
plt.plot(x1,x2,c="gray") #画出分类直线
plt.xlabel("$x_1$")
plt.ylabel("$x_2$")
plt.xlim(-6,6)
plt.ylim(1,5)
plt.show()


