如何定位和分析 Node.js 项目中的内存泄漏问题 All In One
如何定位和分析 Node.js 项目中的内存泄漏问题 All In One
How to locate and analyze memory leaks in Node.js projects
内存泄漏 / memory leaks
- 内存管理
- 垃圾回收
// GC
-
Reference-counting garbage collection / 引用计数垃圾收集 ❌ (
引用计数)
⚠️ 注意:现代浏览器不再使用引用计数来进行垃圾回收。 -
Mark-and-sweep algorithm / 标记扫描算法 ✅ (
标记清除)
该算法将“不再需要对象”的定义简化为“无法访问对象”。
avaScript 引擎通常提供公开内存模型的标志。
例如,Node.js 提供了额外的选项和工具,这些选项和工具公开了用于配置和调试内存问题的底层 V8 机制。
此配置在浏览器中可能不可用,对于网页(通过 HTTP 标头等)更是如此。
garbage collector / 垃圾收集器
# 使用 --max-old-space-size 标志, 增加可用堆内存的最大数量
$ node --max-old-space-size=6000 index.js

# 使用 --expose-gc --inspec 标志和 Chrome 调试器公开垃圾收集器以调试内存问题
$ node --expose-gc --inspect index.js
https://developer.mozilla.org/en-US/docs/Web/JavaScript/Memory_Management
https://nodejs.org/en/docs/guides/debugging-getting-started/
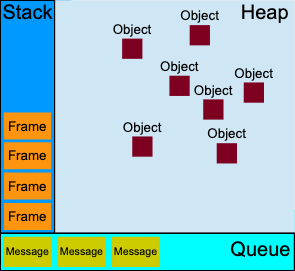
js 数据类型
- 值类型(
值),内存分配使用栈??? - 引用类型(
指针),内存分配使用堆(内存泄漏)
https://developer.mozilla.org/en-US/docs/Web/JavaScript/Data_structures
https://developer.mozilla.org/en-US/docs/Web/JavaScript/EventLoop
Debugging
Most memory issues can be solved by determining how much space our specific type of objects take and what variables are preventing them from being garbage collected.
It can also help to know the allocation pattern of our program over time.
大多数内存问题可以通过确定我们特定类型的对象占用多少空间以及哪些变量阻止它们被垃圾收集来解决。
它还可以帮助了解我们的程序随时间的分配模式。
Heap Profiler / 堆分析器
Heap Snapshot / 堆快照
GC Traces / GC 跟踪
https://nodejs.org/en/docs/guides/diagnostics/memory/#debugging
refs
https://nodejs.org/en/docs/guides/diagnostics/memory/
©xgqfrms 2012-2021
www.cnblogs.com/xgqfrms 发布文章使用:只允许注册用户才可以访问!
原创文章,版权所有©️xgqfrms, 禁止转载 🈲️,侵权必究⚠️!
本文首发于博客园,作者:xgqfrms,原文链接:https://www.cnblogs.com/xgqfrms/p/17211580.html
未经授权禁止转载,违者必究!


【推荐】国内首个AI IDE,深度理解中文开发场景,立即下载体验Trae
【推荐】编程新体验,更懂你的AI,立即体验豆包MarsCode编程助手
【推荐】抖音旗下AI助手豆包,你的智能百科全书,全免费不限次数
【推荐】轻量又高性能的 SSH 工具 IShell:AI 加持,快人一步
· 被坑几百块钱后,我竟然真的恢复了删除的微信聊天记录!
· 【自荐】一款简洁、开源的在线白板工具 Drawnix
· 没有Manus邀请码?试试免邀请码的MGX或者开源的OpenManus吧
· 园子的第一款AI主题卫衣上架——"HELLO! HOW CAN I ASSIST YOU TODAY
· 无需6万激活码!GitHub神秘组织3小时极速复刻Manus,手把手教你使用OpenManus搭建本
2022-03-13 js sort string array by alphabetically All In One
2022-03-13 Node.js process All In One
2022-03-13 js Object.setPrototypeOf & Object.create All In One
2022-03-13 How to create a Chinese translation in Wikipedia All In One
2022-03-13 github & vscode online env All in One
2021-03-13 Python API Frameworks All In One
2021-03-13 JSON.stringify() You Don't Know All In One