v-charts column width All In One
v-charts column width All In One
过多数据处理方式
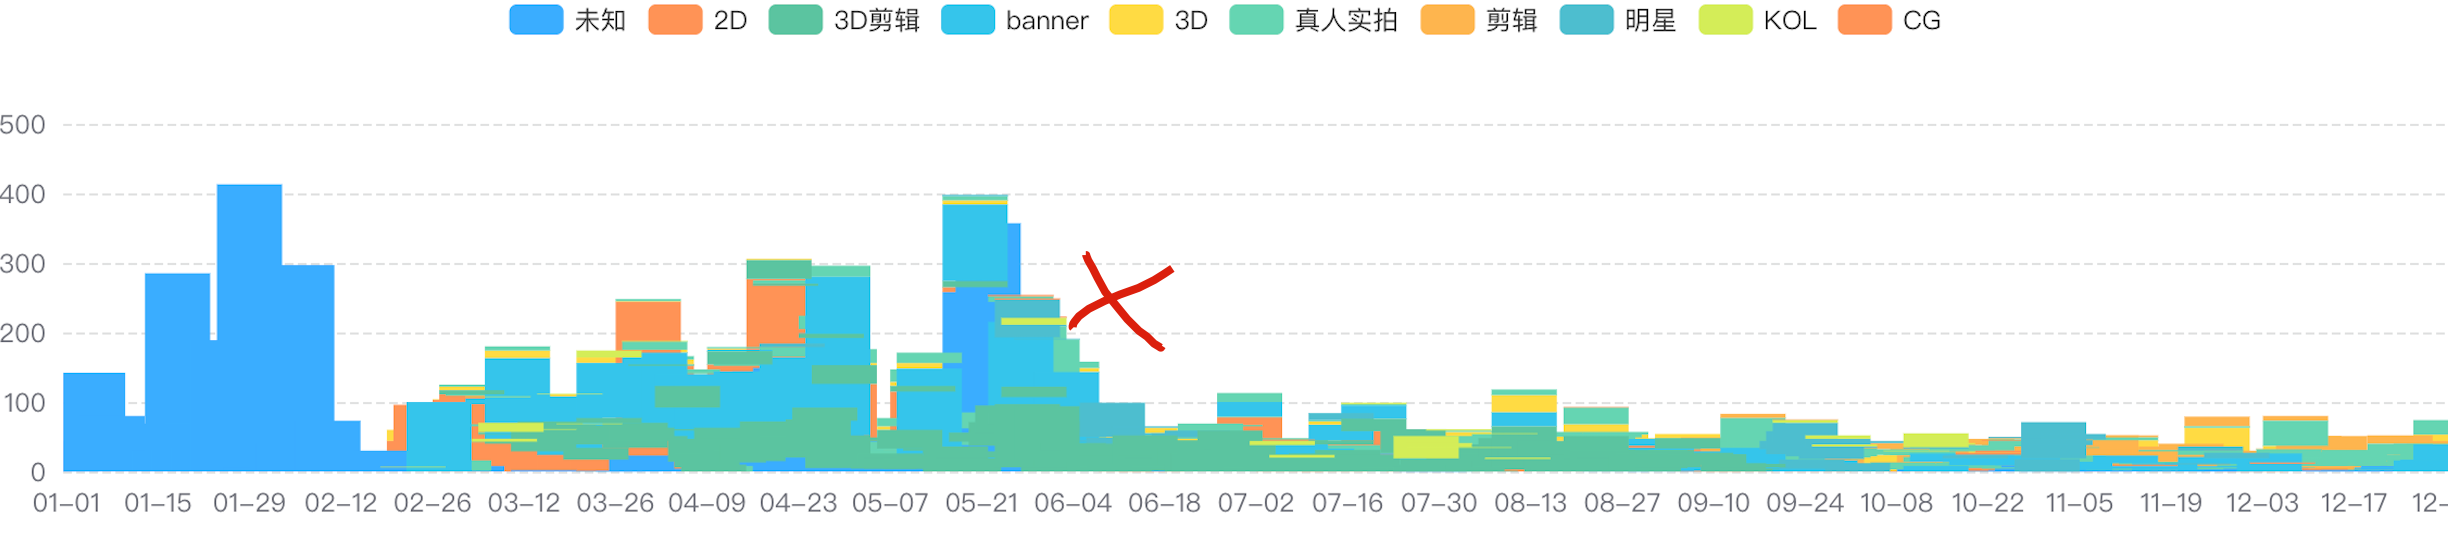
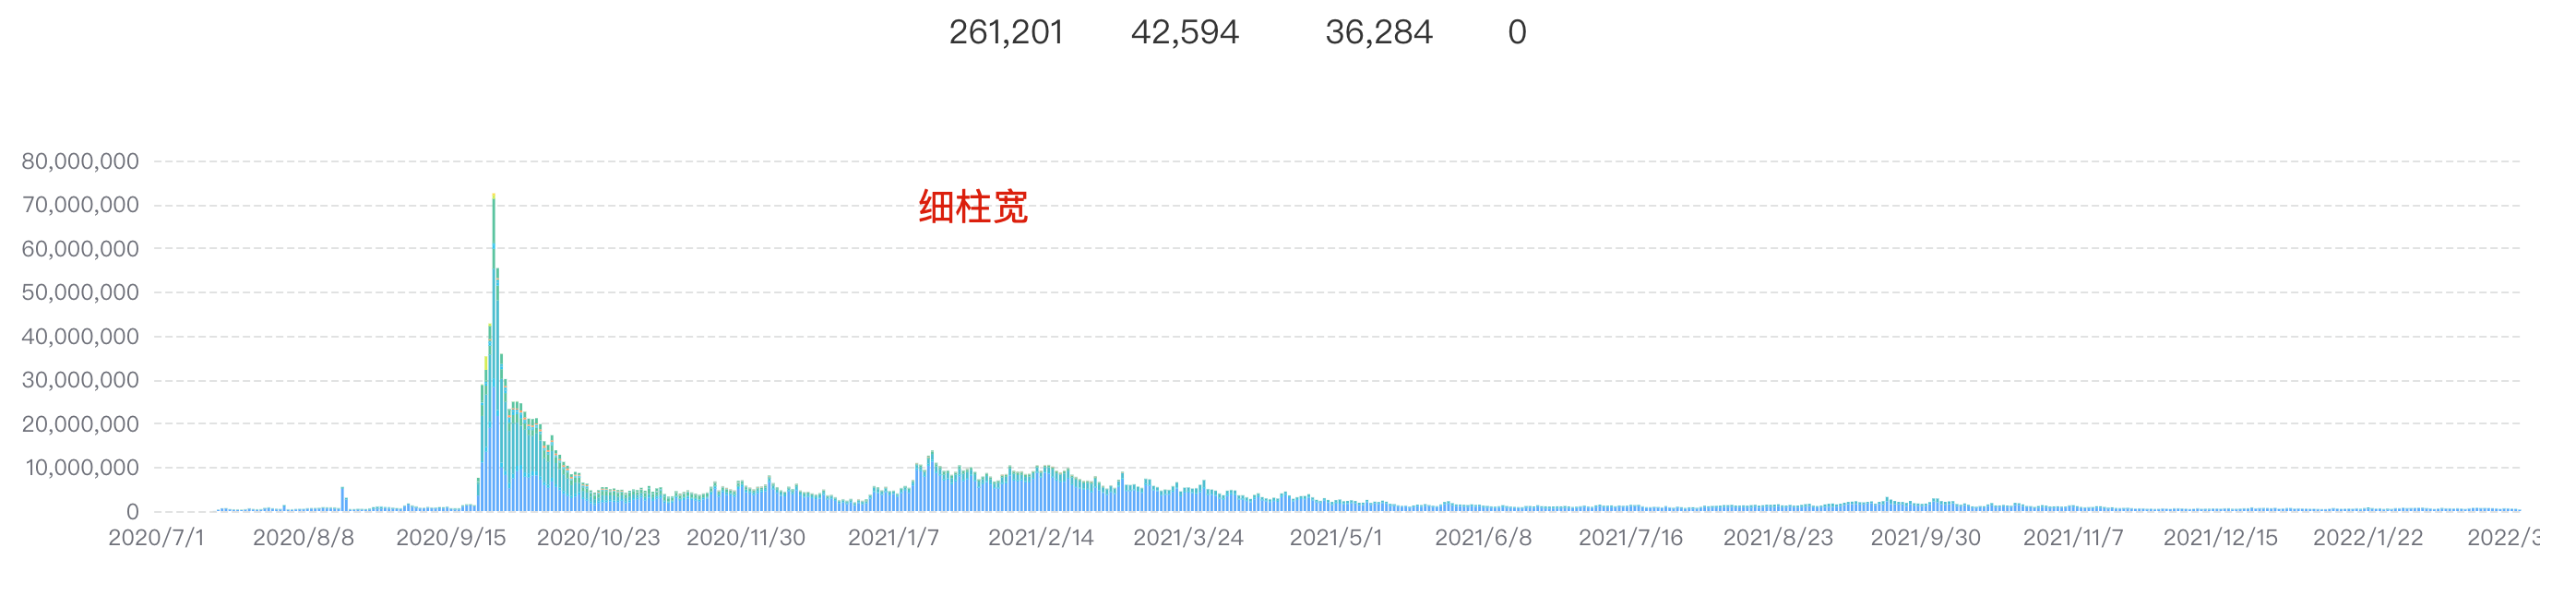
- 细柱
最大的柱宽度
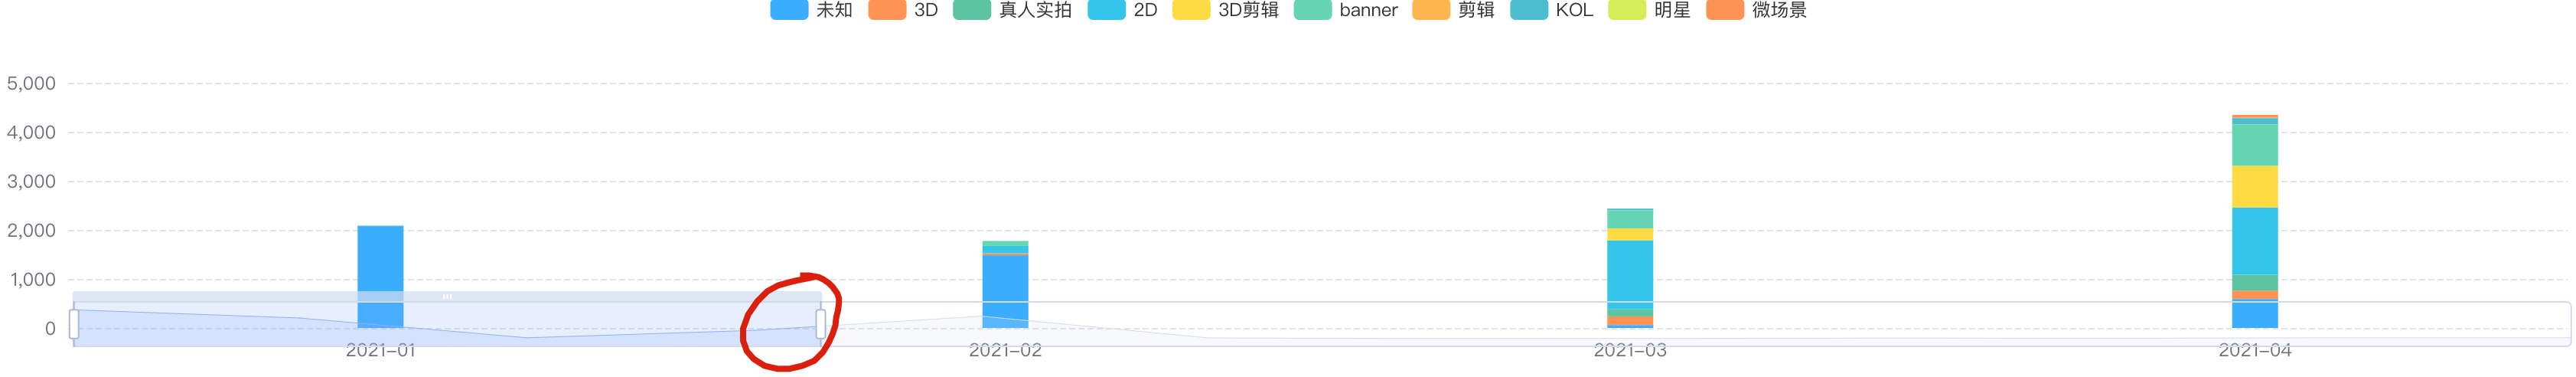
- 滚动
滚动缩放
demo
<template>
    <section class="overview-chart-box">
        <div class="title">
            {{options.title}}
        </div>
        <slot name="overview-slot"></slot>
        <ve-chart
            class="chart"
            ref="chart"
            v-show="showChart"
            :settings="chartSettings"
            :extend="chartExtend"
            :colors="chartColors"
            :data="chartData"
            :data-empty="dataEmpty"
            :loading="loading"
            height="240px">
        </ve-chart>
        <!-- <ve-chart
            class="chart"
            ref="chart"
            v-show="showChart"
            :settings="chartSettings"
            :extend="chartExtend"
            :data-zoom="dataZoom"
            :colors="chartColors"
            :data="chartData"
            :data-empty="dataEmpty"
            :loading="loading"
            height="240px">
        </ve-chart> -->
        <div v-show="!showChart" class="flex-center" style="height: 240px;">暂无数据</div>
    </section>
</template>

<script>
import dayjs from 'dayjs';
import Utils from '@/utils';
// import { stackTooltipFormatter } from '@/utils/table';

const colors = [
    '#3AADFF',
    '#FF9356',
    '#5BC4A0',
    '#35C5EB',
    '#FFDB43',
    '#65D5B2',
    '#FEB54E',
    '#4DBECF',
    '#D4ED58',
    '#FF9356',
];

export default {
    name: 'OverviewChart',
    props: {
        options: Object,
        loading: {
            type: Boolean,
            default: false,
        },
        currentType: {
            type: String,
            default: '',
        },
    },
    computed: {
        dataEmpty () {
            return this.chartData.rows.length === 0;
        },
        showChart () {
            return !(this.options.settings.type === 'pie' && this.options.data.rows.every(i => i[this.options.labelKeys[1]] === 0));
        },
       // 滚动缩放
        dataZoom () {
            return [
                {
                    type: 'slider',
                    start: 0,
                    // end: 12,
                    end: 30,
                },
            ];
        },
        chartExtend () {
            const type = this.options.settings.type;
            return {
                ...Utils.chartExtend(type),
                grid: {
                    bottom: 0,
                },
                legend: {
                    show: this.options.settings.type !== 'pie',
                },
                tooltip: {
                    formatter: (arr, i) => {
                        const keys = [...this.options.sortKeys?.filter(key => key !== 'title')].reverse();
                        let result = ``;
                        for (const [index, key] of keys.entries()) {
                            const obj = arr.find(obj => obj.seriesName === key);
                            const { seriesName, name, marker, value } = obj;
                            if(index === 0) {
                                result += `${name}<br/>`;
                            }
                            if (value) {
                                result += `${seriesName}:<span title="${seriesName}">${marker}${value}</span><br/>`
                            }
                        }
                        return result;
                    },
                },
                series: (v) => {
                    Array.from(v).forEach((e, idx) => {
                        if (e.type === 'bar') {
                            // 最大的柱宽度
                            e.barMaxWidth = 30;
                            e.stack = 'value';
                        }
                    });
                    return v;
                },
            };
        },
        chartData () {
            const rows = this.options.isDay ? this.options.data?.rows?.map(i => ({...i, title: dayjs(i.title).format('MM-DD')})) : this.options.data?.rows;
            return {
                rows: rows || [],
                columns: [...(this.options.labelKeys || [])],
            };
        },
        chartSettings () {
            const labels = this.options.labelMap;
            if (this.options.detailList) {
                this.options.labelKeys.forEach(key => {
                    this.options.detailList.forEach(detail => {
                        labels[`${key}${detail.value}`] = labels[key];
                    });
                });
            }
            const config = {
                labelMap: labels,
                ...(this.options.settings || {}),
                stack: {
                    label: this.options.labelKeys
                },
            };
            return config;
        },
    },
    watch: {
        options (v) {
            this.$nextTick(_ => {
                this.$refs.chart.echarts.resize();
                // const that = this;
                // window.setTimeout(() => {
                //     that.$refs.chart.echarts.resize();
                // }, 1000);
            });
        },
    },
    data () {
        return {
            chartColors: colors,
        };
    },
    methods: {
        //
    },
    mounted () {
        //
    },
};
</script>

<style lang="scss" scoped>
.overview-chart-box {
    box-sizing: border-box;
    min-width: 1106px;
    background: #fff;
    position: relative;
    margin-bottom: 20px;
    .title {
        height: 20px;
        font-size: 14px;
        font-weight: 500;
        color: #606266;
        line-height: 20px;
        margin-left: 20px;
        margin-top: 20px;
    }
    .charts {
        padding: 0 20px;
    }
}

</style>
refs
https://zizorg.github.io/v-charts/#/histogram
©xgqfrms 2012-2020
www.cnblogs.com/xgqfrms 发布文章使用:只允许注册用户才可以访问!
原创文章,版权所有©️xgqfrms, 禁止转载 🈲️,侵权必究⚠️!
本文首发于博客园,作者:xgqfrms,原文链接:https://www.cnblogs.com/xgqfrms/p/15956255.html
未经授权禁止转载,违者必究!

