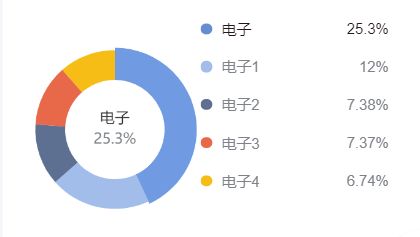
ECharts 饼状图,圆心文字提示,默认显示第一个;点击外部数据高亮放大echarts饼图,点击饼状图,关联外部数据
描述得乱七八糟的,其实就是外面有个列表,类似于图列,但是他特别复杂我就把图里给写在外面了
差不多长这样需求是这样的,点击饼状图,外面的列表高亮;点击外面的列表,饼状图高亮

来吧,上代码 eChart是图标,ul是列表
<div ref="chart" ></div>
<ul class="List">
    <li v-for="(item,index) in list" :key="index" @click="tabCon(index)" :class="index == active ? 'cur' : ''">
       <span>{{item?.name}} </span> <span>{{item?.value}}</span>
   </li>
</ul>
data() {
return {
chartInstance: null,
active:0,
list:[
{
name:"电子",
value:"20.51%"
},
{
name:"电子2",
value:"14.72%"
},
{
name:"电子3",
value:"11.16%"
},
{
name:"电子4",
value:"6.63%"
},
{
name:"电子5",
value:"3.04%"
},
]
}
},
mounted(){
//数据渲染之后,默认高亮第一个数据
setTimeout(() => {
this.tabCon()
}, 3000);
},
methods: {
//点击列表数据,高亮扇形区域,圆心数据提示
tabCon(index = 0) {
this.active = index
// // 如果还需要进一步取消高亮效果(例如,移除鼠标悬停时的样式)
this.chartInstance.dispatchAction({
type: 'downplay',
seriesIndex: 0
});
// 高亮指定扇区
this.chartInstance.dispatchAction({
type: 'highlight',
seriesIndex: 0,
dataIndex: index
});
},
initEchart(){
this.chartInstance = echarts.init(this.$refs.chart);
let arr = [] //数据渲染
this.list.forEach((item, index) => {
let param = {
name: item?.name,
value: item.value
}
arr.push(param)
})
var options = {
color: ['#f00', '#f0f', '#ff0', '#00f', '#0f0'],
series: [
{
type: 'pie',
center: ['50%', '50%'],
radius: ['45%', '72%'],
avoidLabelOverlap: false,
label: {
show: false,
position: 'center'
},
labelLine: {
show: false
},
emphasis: {
scaleSize: 2,
label: {
show: true,
fontSize: '12',
overflow : 'truncate',
// 圆心数据提示,每隔4个字换行 rich是自定义样式
formatter: function (val) { // 这是回调函数,参数是label中的文字
var charArr = val.name.split('');
var str = ''
for (let i = 0; i < charArr.length; i++) {
str += charArr[i];
if (i != 0 && i % 4 == 0) str += '\n'; //每隔4个字换行
}
// return str + val.data.value + '%'
return `{a|${str}}\n{c|${val.data.value}%}`;
},
rich: {
b: {
color: '#251717',
fontSize: 14,
fontWeight: "bold",
overflow : 'truncate',
},
c: {
fontSize: 12,
color: '#7F8389',
padding: [5, 0, 0, 0],
},
},
}
},
minAngle: 5, //最小的扇区角度(0 ~ 360),用于防止某个值过小导致扇区太小影响交互。
padAngle: 10,
data: arr
}
],
selectedMode: true
};
this.chartInstance.setOption(options);
this.chartInstance.on('click', (params) => {
//点击扇形区域 取消之前的数据显示和,高亮外面列表区域
if(params.dataIndex != this.active){
this.chartInstance.dispatchAction({
type: 'downplay',
seriesIndex: 0,
dataIndex: this.active
});
}
this.active = params.dataIndex;
});
},
}


