linux 常用命令
ls | xargs -n 9 rm -rf
pidstat iostat. https://www.cnblogs.com/ggjucheng/archive/2013/01/13/2858810.html perf top
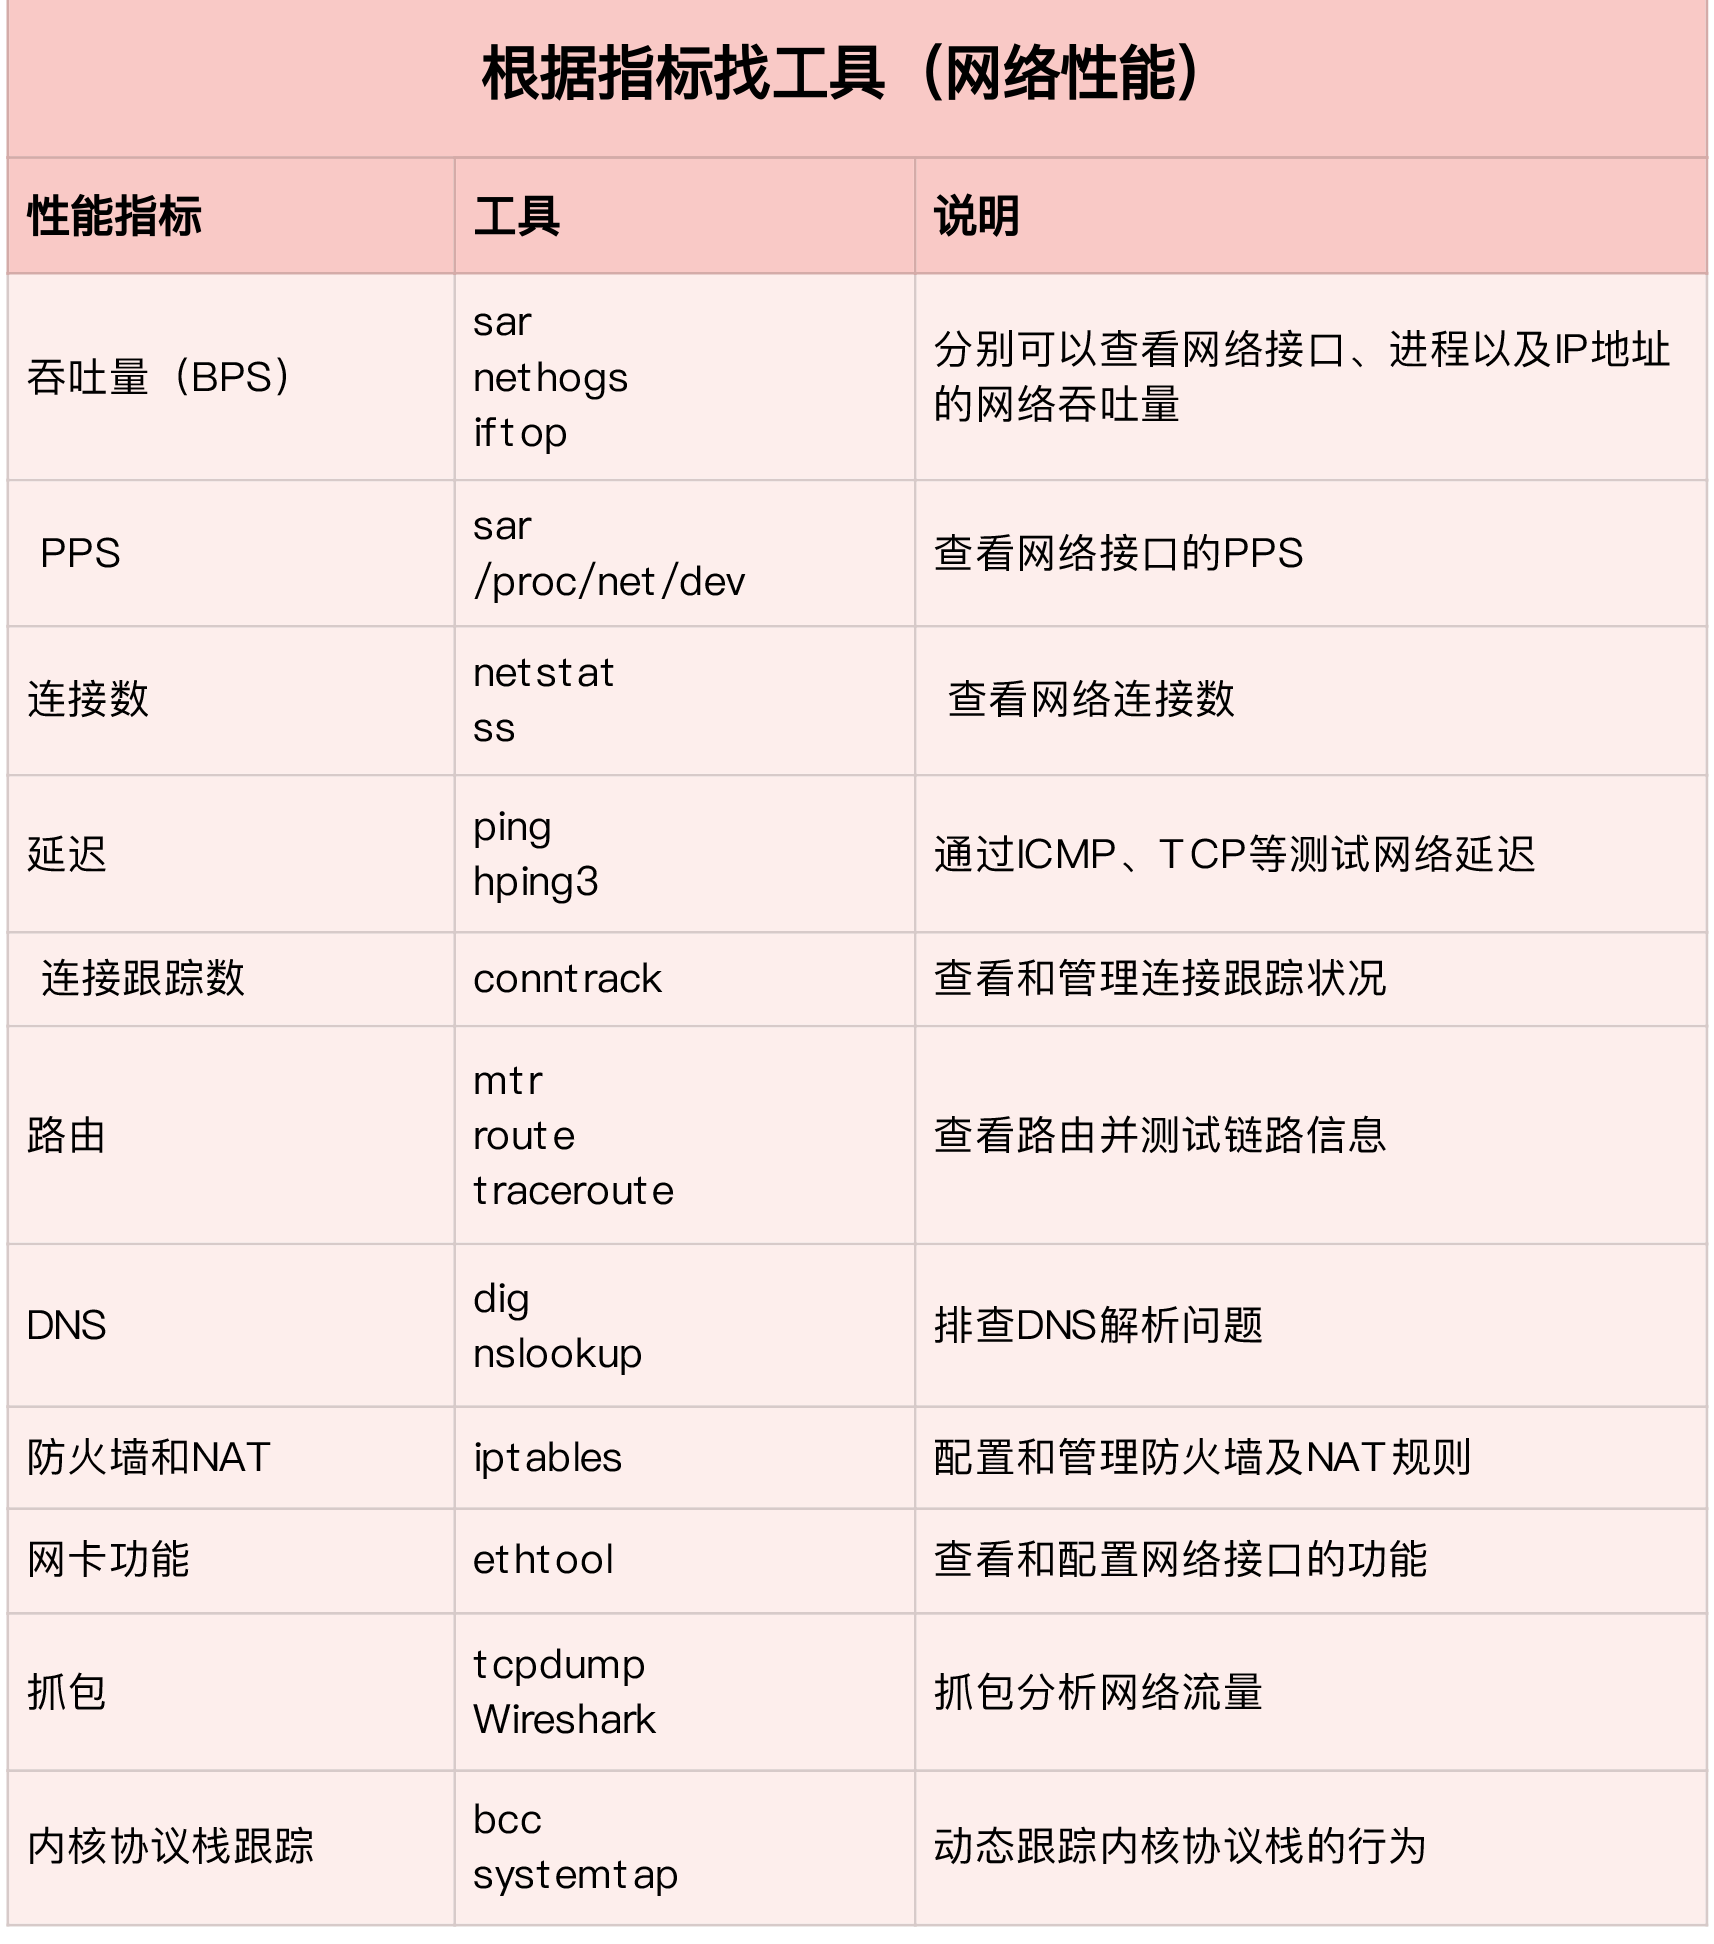
mtr 网络分析
perf top -g -p 31059
pstree
lsof https://www.cnblogs.com/sparkdev/p/10271351.html
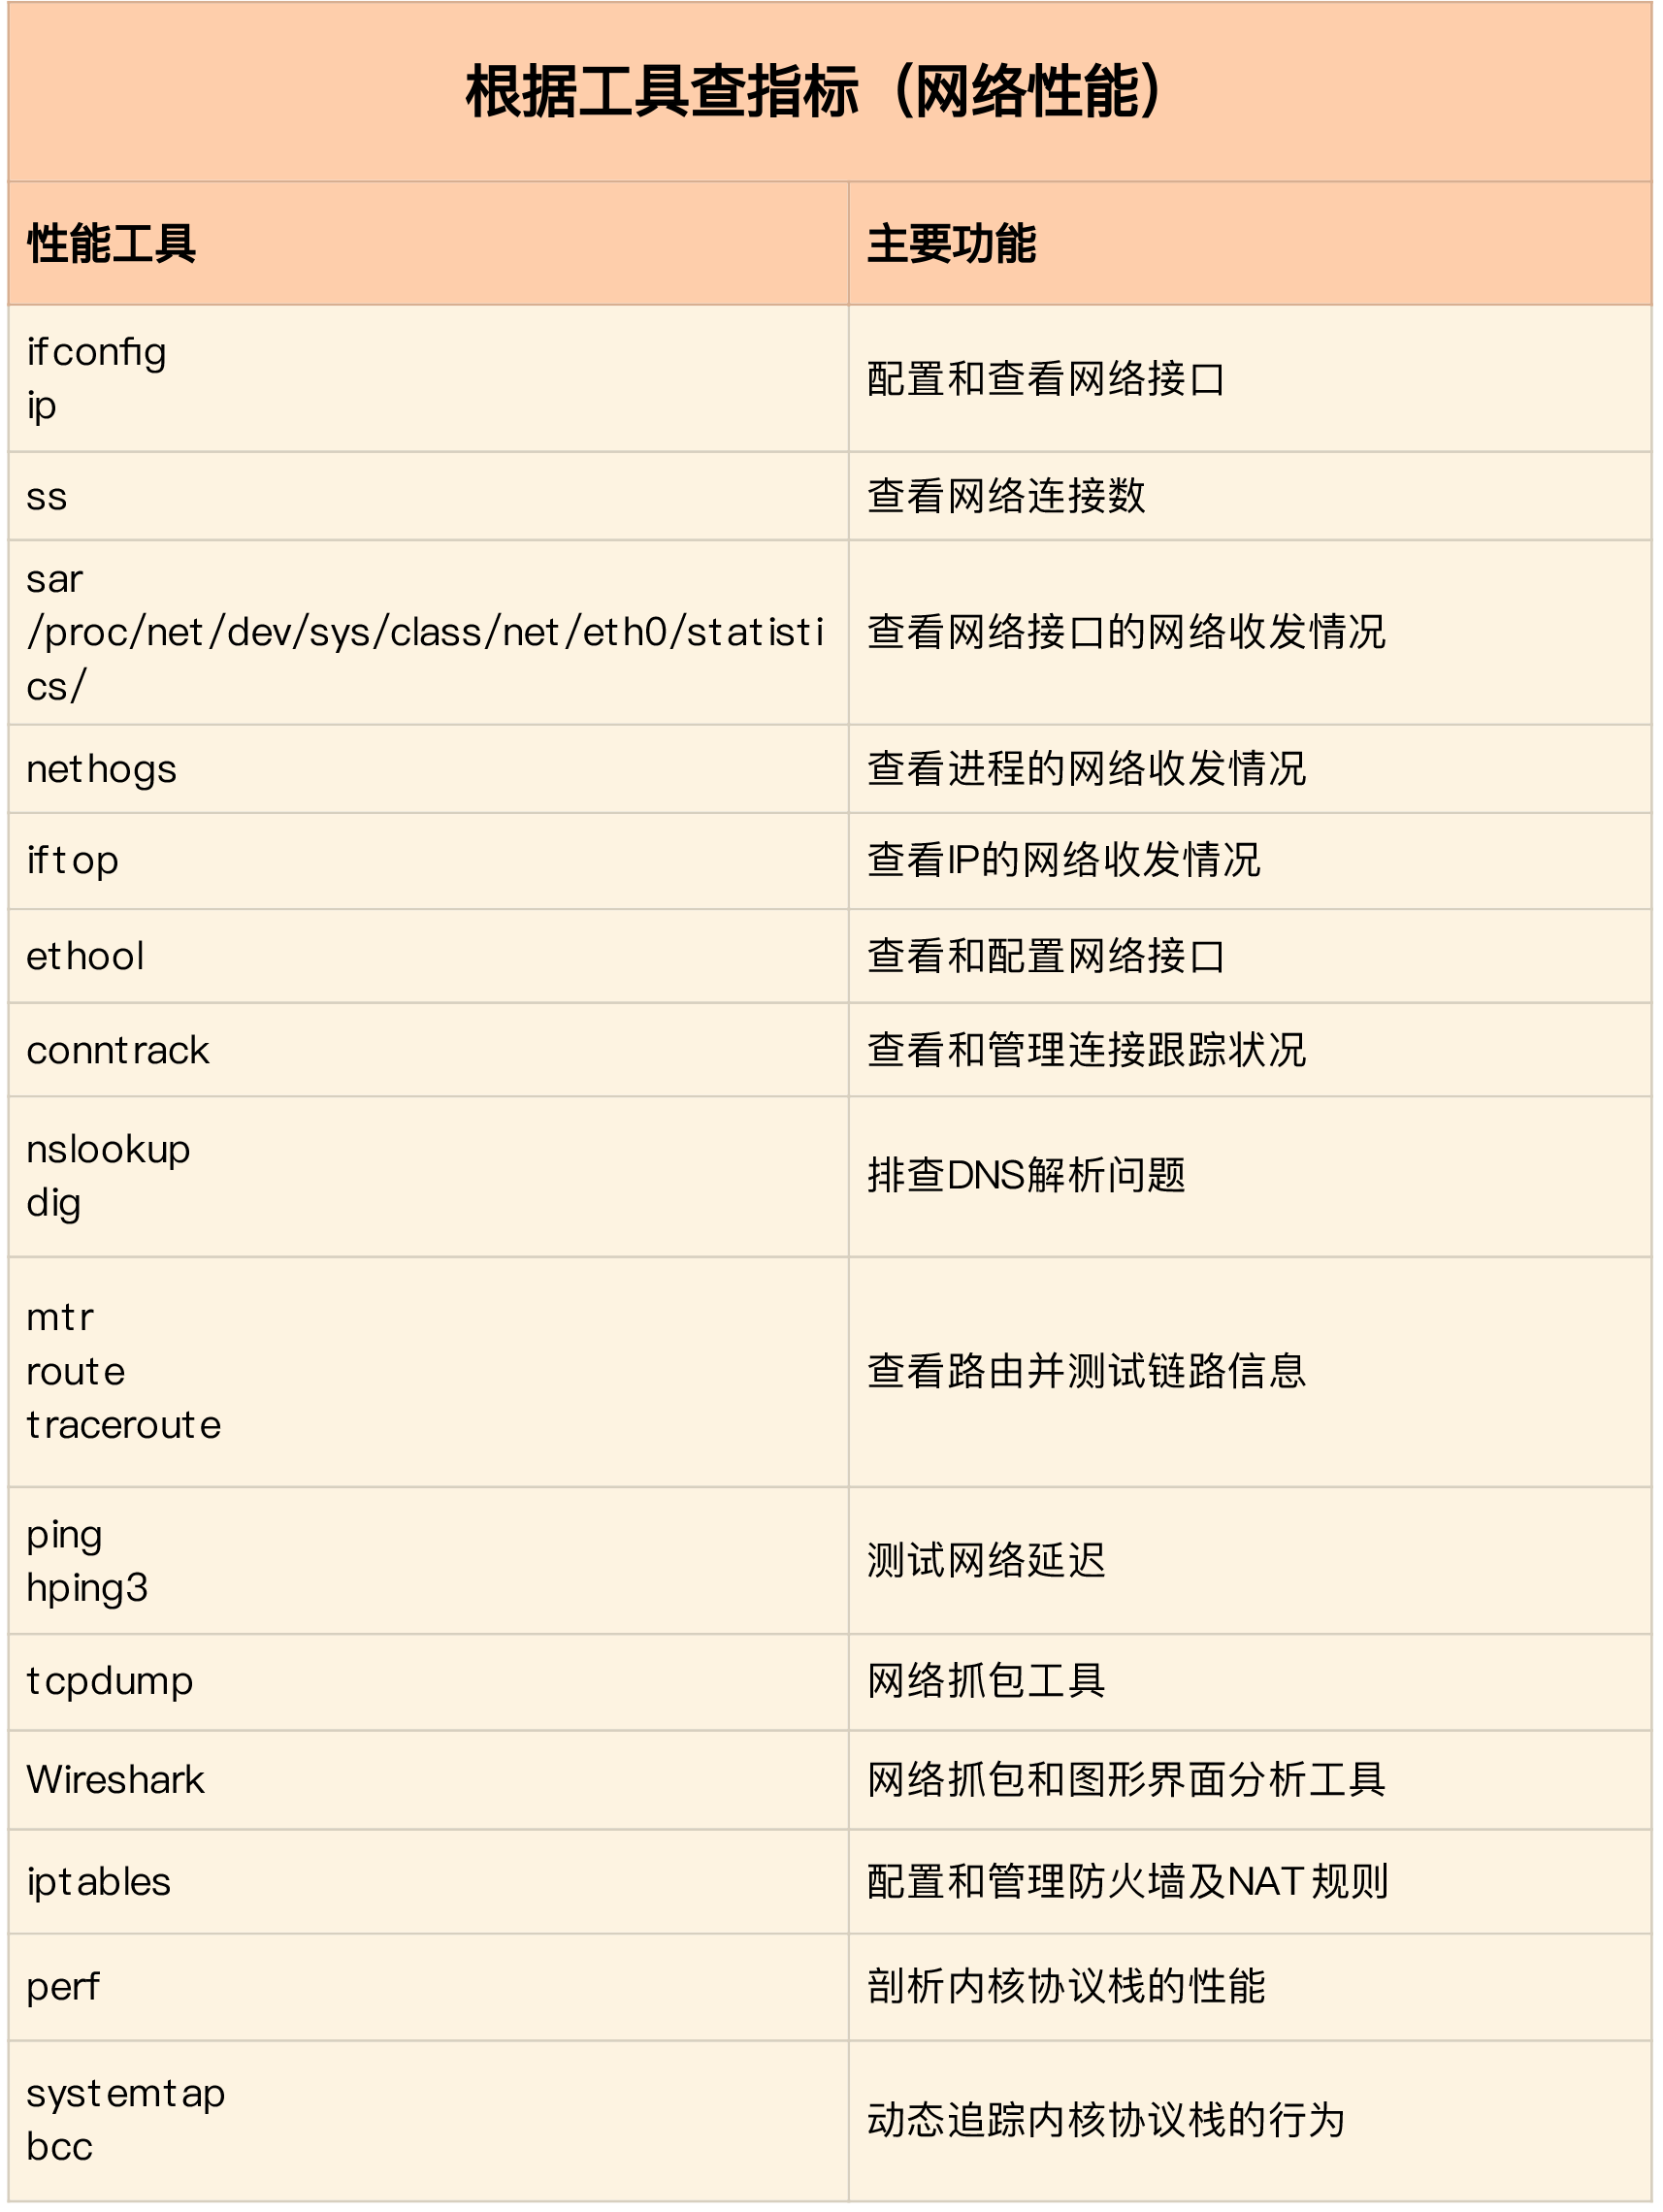
iftop 查看主机流量情况。https://www.cnblogs.com/chenqionghe/p/10680075.html
# 记录性能事件,等待大约15秒后按 Ctrl+C 退出
$ perf record -g
# 查看报告
$ perf report
execsnoop. # 短时应用
dstat https://linux.cn/article-3215-1.html
strace. https://colobu.com/2021/04/30/strace-commands-for-troubleshooting-and-debugging-linux/
sar 可以用来查看系统的网络收发情况. https://linuxtools-rst.readthedocs.io/zh_CN/latest/tool/sar.html
tcpdump -i eth0 -n tcp port 80
找网络相关的错误,可以有几种方式。
1. 找系统类的错误, dmesg | tail
2. 直接的网络错误 sar -n ETCP 1 或者 sar -n EDEV 1
3.查看网络状态, netstat -s 或者 watch -d netstat -s
4.网络状态的统计 ss -ant | awk '{++s[$1]} END {for(k in s) print k,s[k]}'
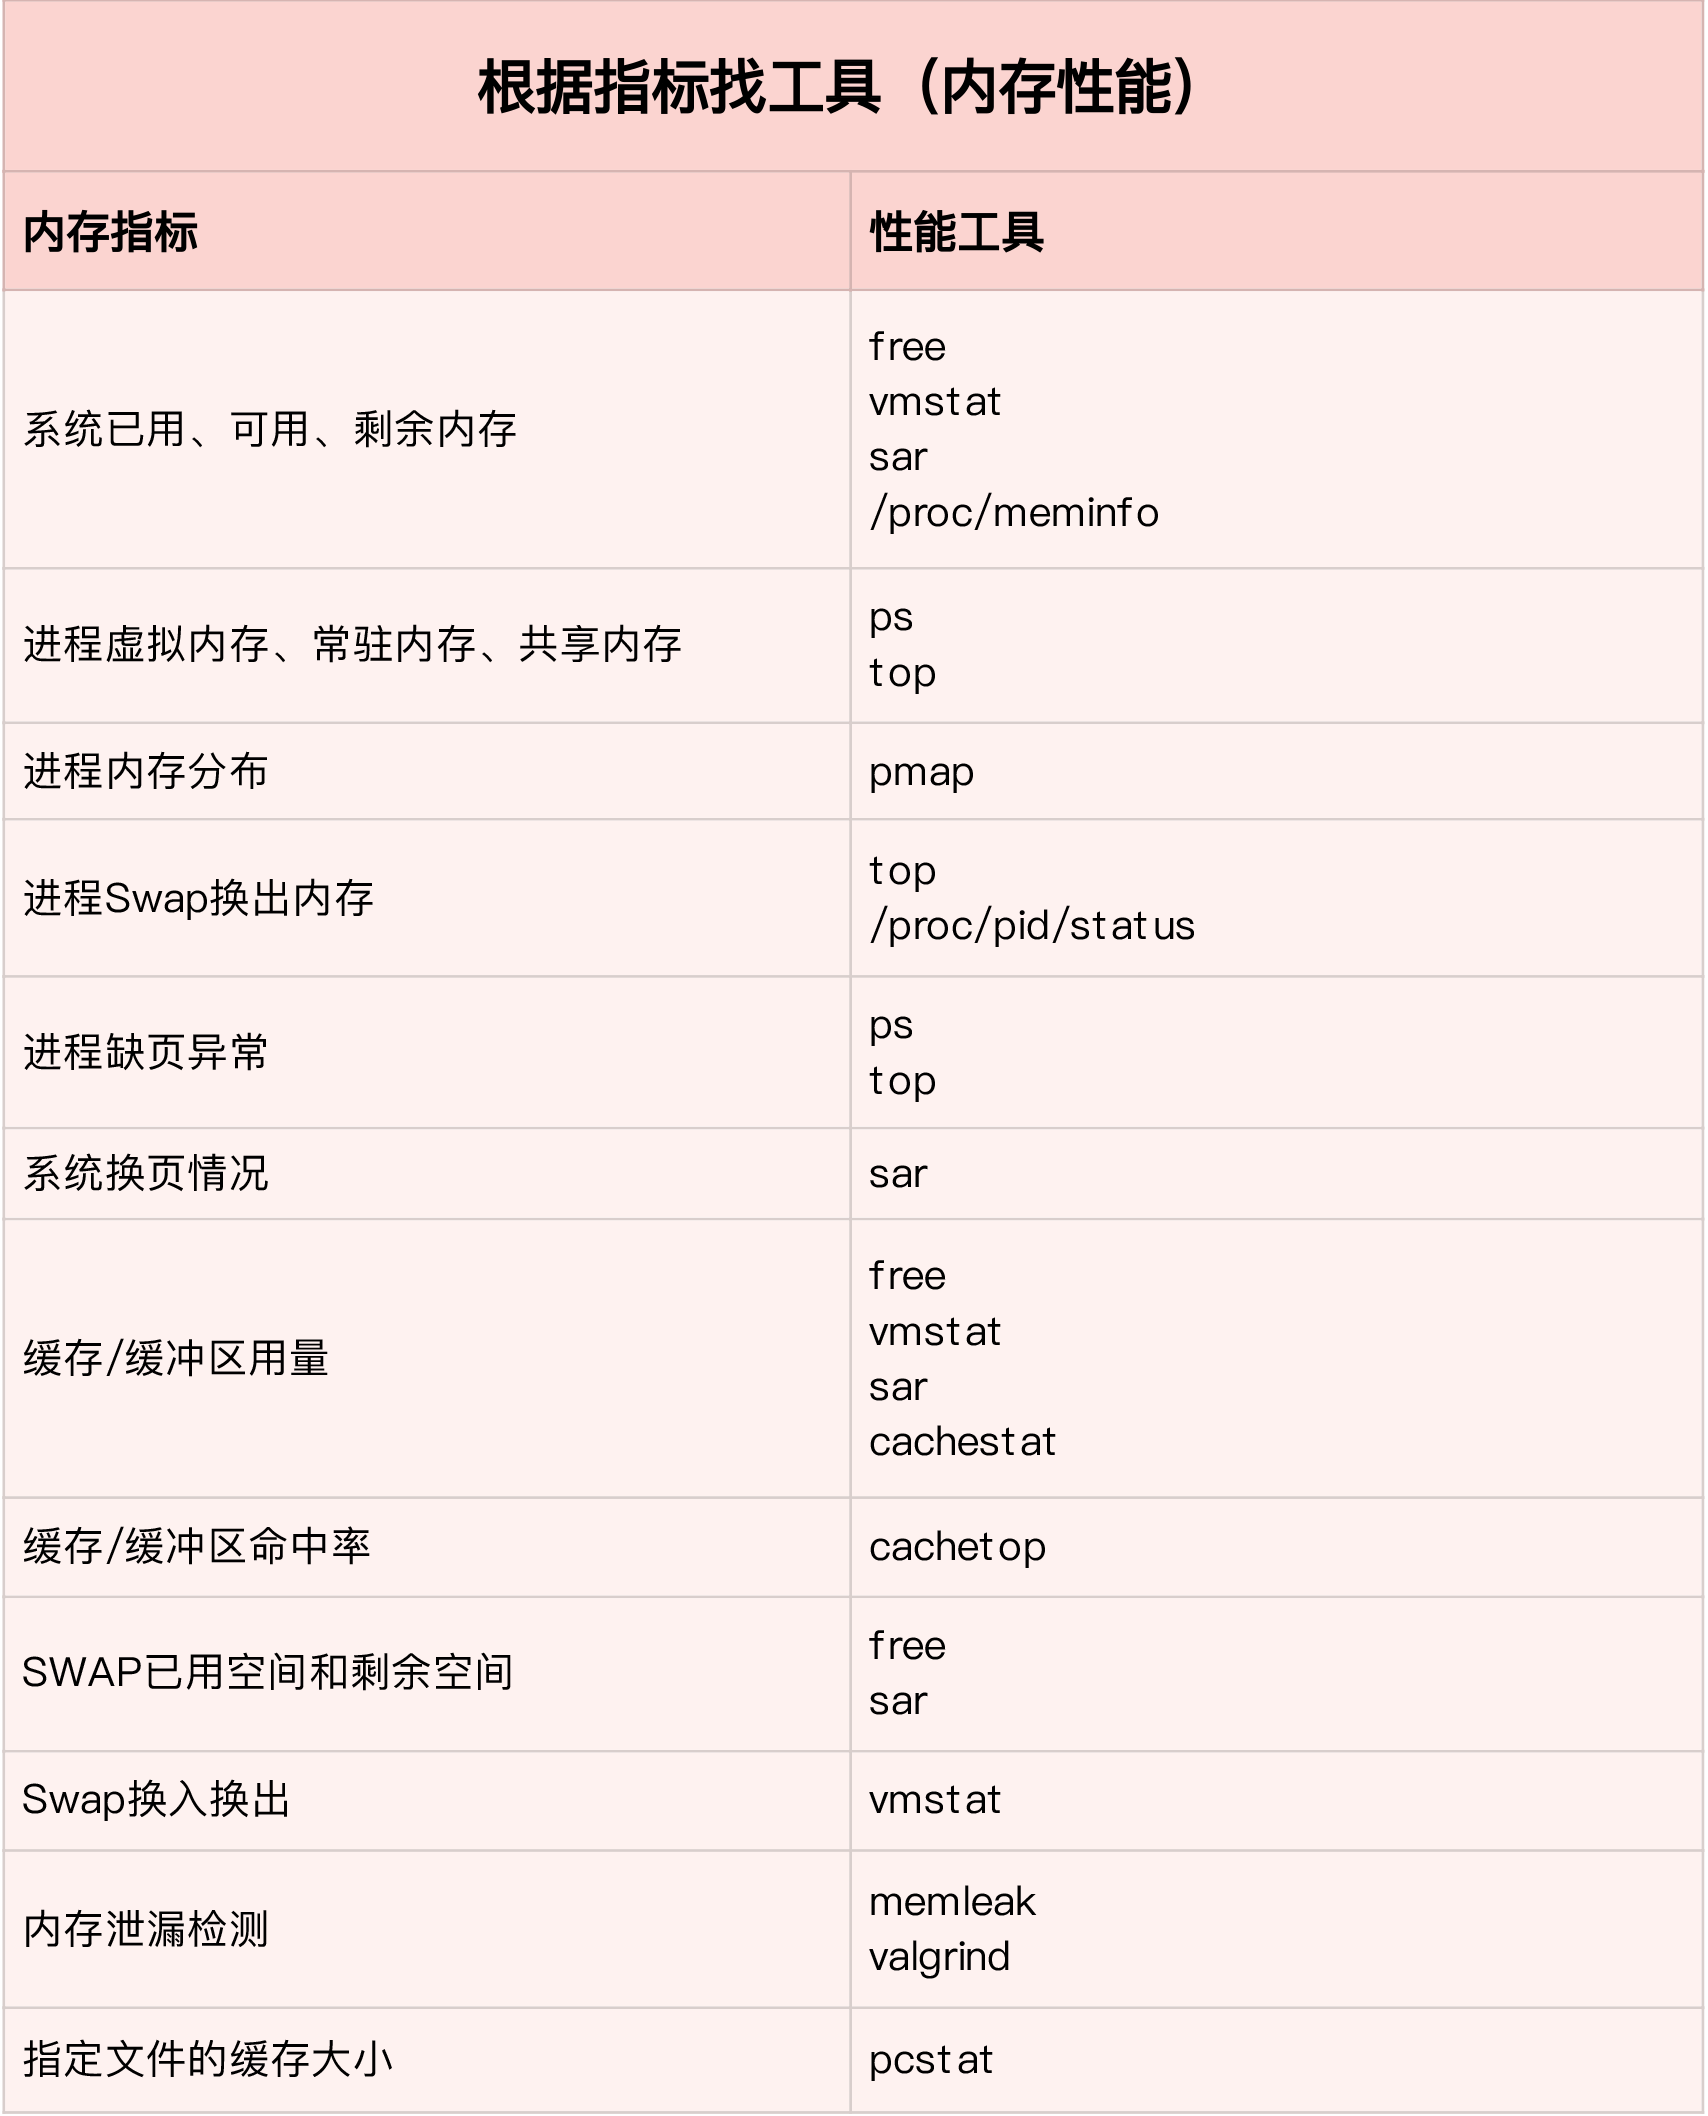
cachestat 提供了整个操作系统缓存的读写命中情况。
cachetop 提供了每个进程的缓存命中情况。
memleak 可以跟踪系统或指定进程的内存分配、释放请求,然后定期输出一个未释放内存和相应调用栈的汇总情况(默认 5 秒)
dmesg | grep -i "Out of memory". 查看oom日志
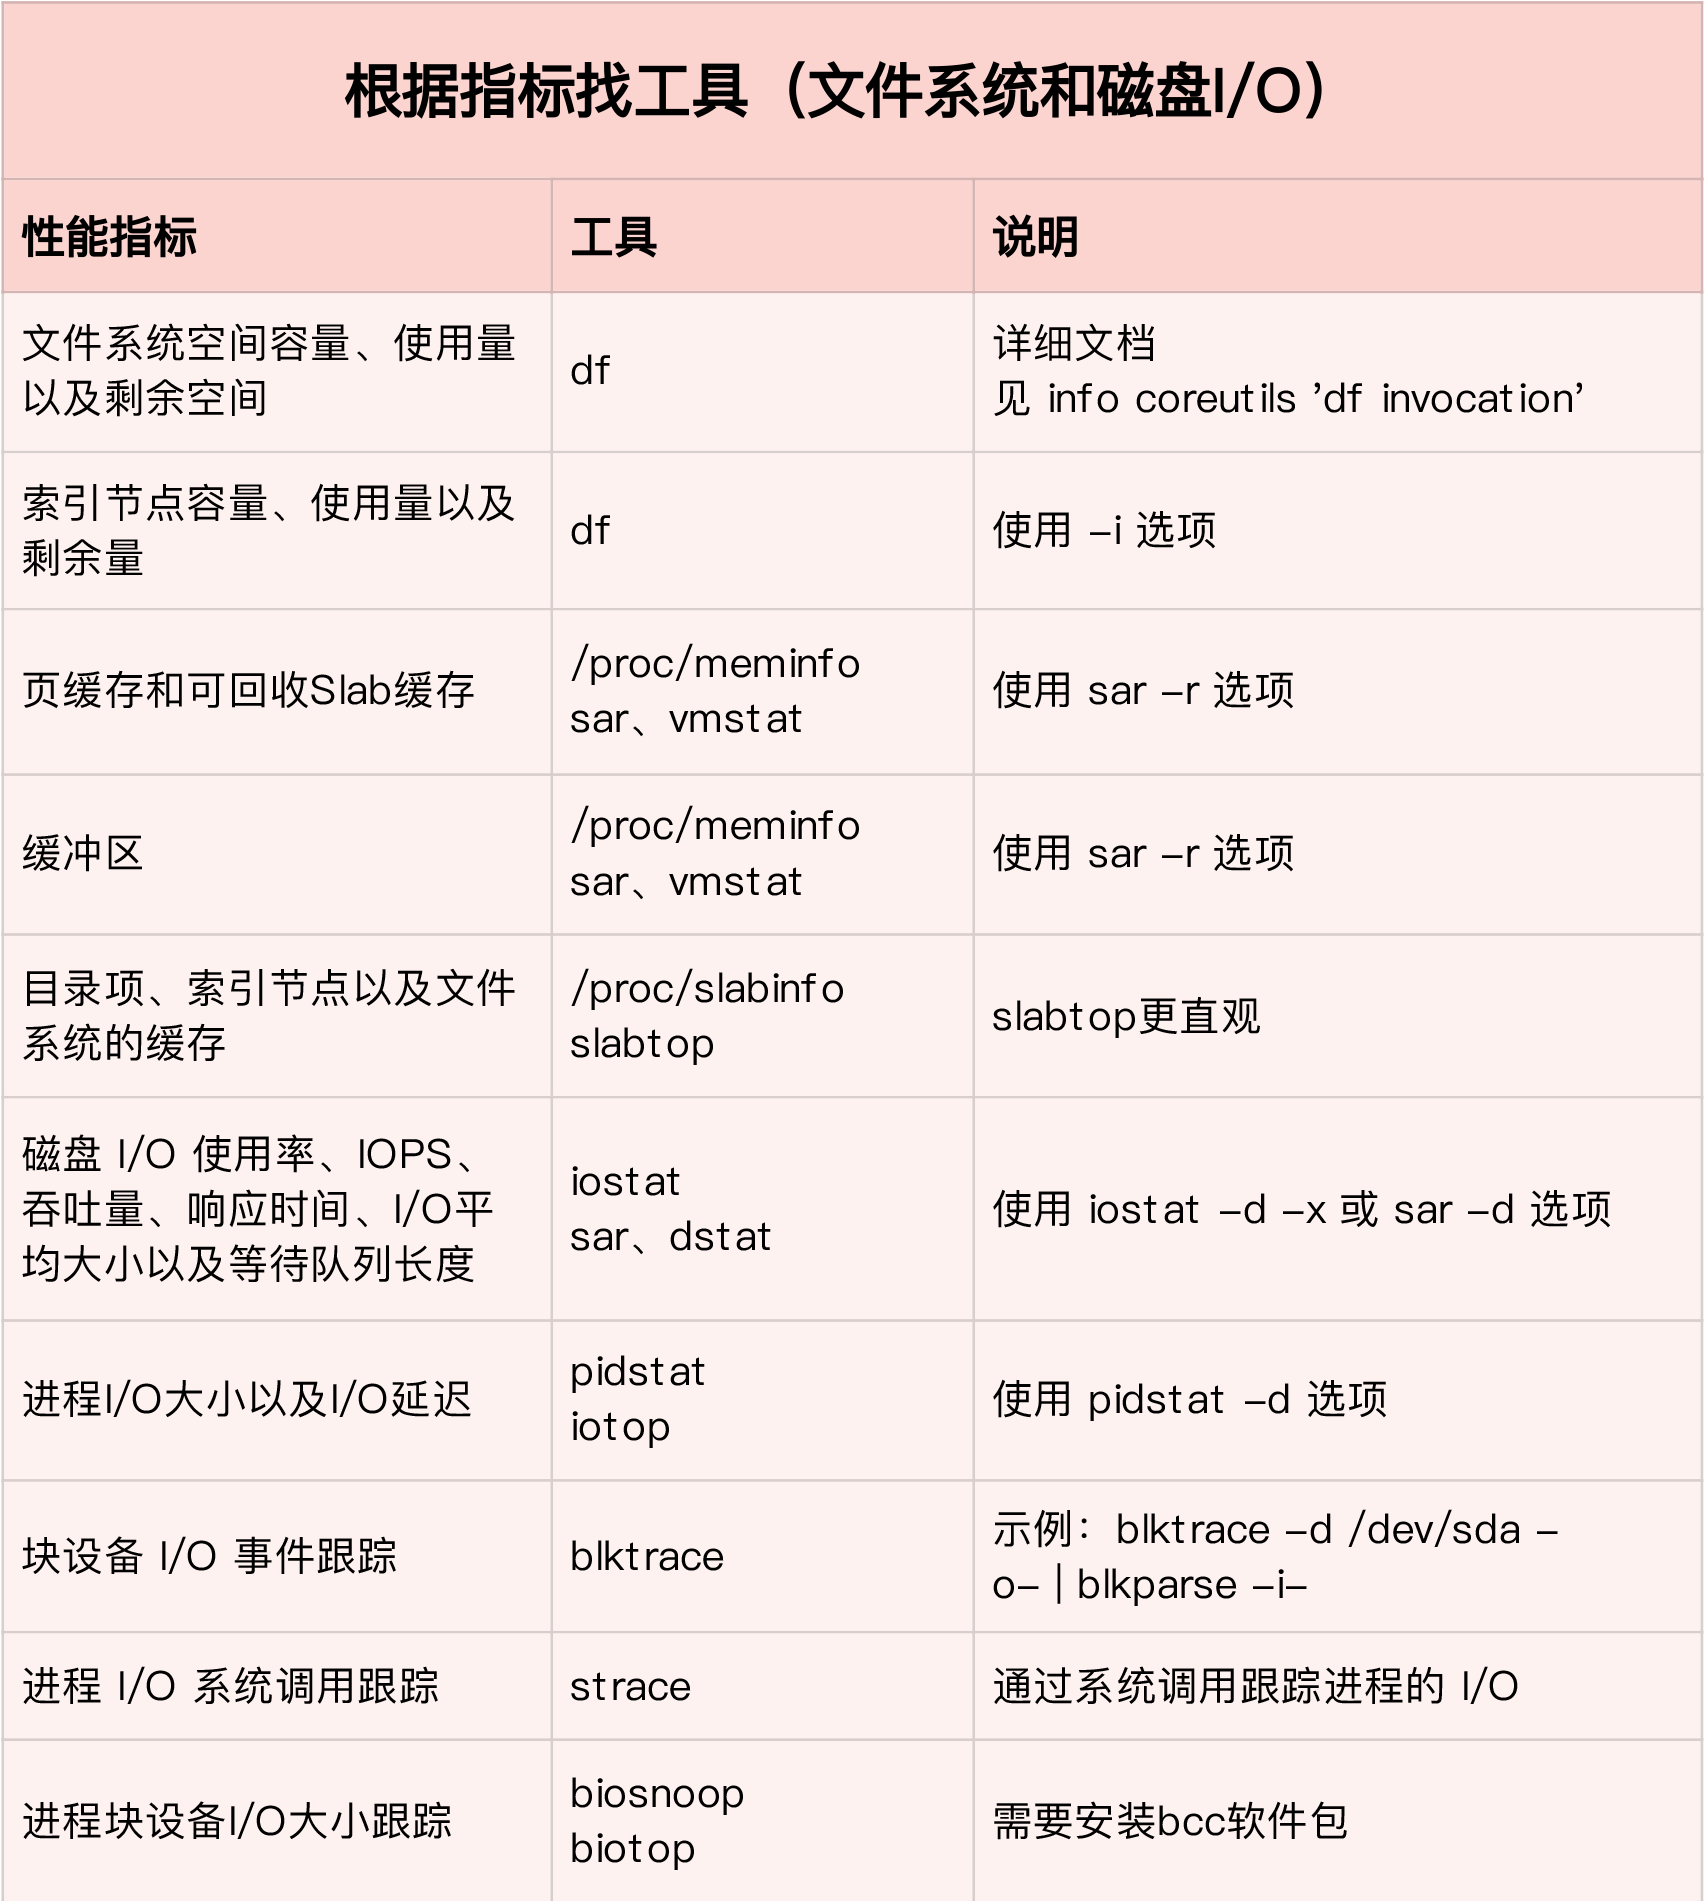
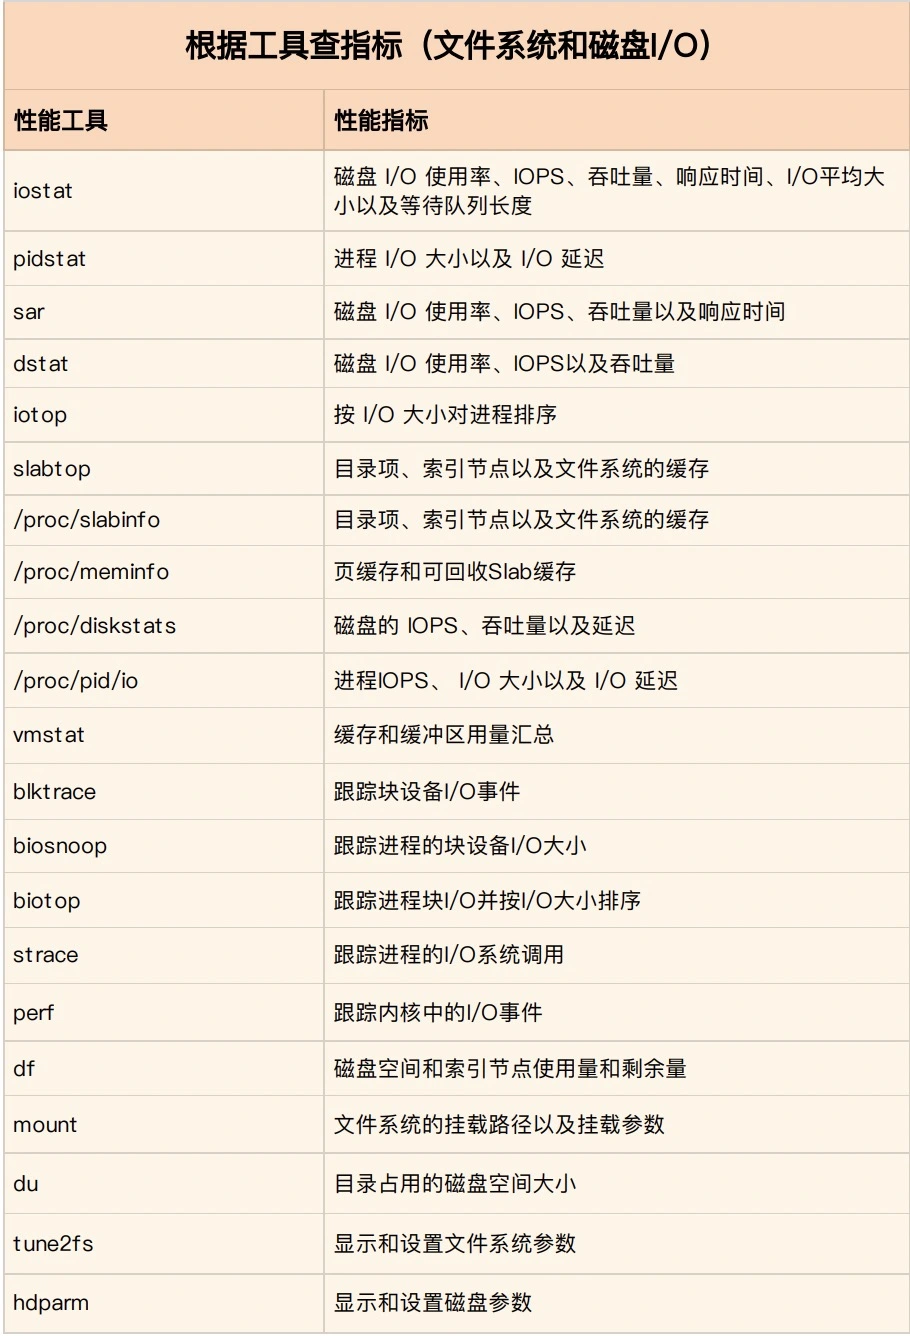
iotop。它是一个类似于 top 的工具,你可以按照 I/O 大小对进程排序,然后找到 I/O 较大的那些进程
Wireshark秘籍 https://zhuanlan.zhihu.com/p/137044525
火焰图 https://time.geekbang.org/column/article/86330. https://time.geekbang.org/column/article/87342
压测工具,wak ab
# somaxconn是系统级套接字监听队列上限$ sysctl net.core.somaxconn


 浙公网安备 33010602011771号