几个图表控件关于热力图显示的调研笔记
InteractiveDataDisplay.WPF
这是微软出的一个开源的曲线图控件,目前已经没有更新了,而且只支持.NET Framework,不支持.NET Core平台。
安装
Install-Package InteractiveDataDisplay.WPF
前台代码
<Window
    x:Class="HeatmapGraphDemo.MainWindow"
    xmlns="http://schemas.microsoft.com/winfx/2006/xaml/presentation"
    xmlns:x="http://schemas.microsoft.com/winfx/2006/xaml"
    xmlns:d="http://schemas.microsoft.com/expression/blend/2008"
    xmlns:d3="clr-namespace:InteractiveDataDisplay.WPF;assembly=InteractiveDataDisplay.WPF"
    xmlns:local="clr-namespace:HeatmapGraphDemo"
    xmlns:mc="http://schemas.openxmlformats.org/markup-compatibility/2006"
    Title="MainWindow"
    Width="800"
    Height="450"
    mc:Ignorable="d">

    <Grid>
        <Grid.RowDefinitions>
            <RowDefinition Height="*" />
            <RowDefinition Height="Auto" />
        </Grid.RowDefinitions>
        <d3:Chart>
            <d3:Chart.Title>
                <TextBlock Margin="0,5,0,5" FontSize="18">Heatmap sample</TextBlock>
            </d3:Chart.Title>
            <!--<d3:HeatmapGraph x:Name="heatmap" Palette="Yellow,Blue,Orange" />-->
            <d3:HeatmapGraph x:Name="heatmap" />
        </d3:Chart>

        <Button
            Grid.Row="1"
            Click="Button_Click"
            Content="加载" />
    </Grid>
</Window>
后台代码
using MiniExcelLibs;
using System.Diagnostics;
using System.Linq;
using System.Windows;

namespace HeatmapGraphDemo
{
    /// <summary>
    /// MainWindow.xaml 的交互逻辑
    /// </summary>
    public partial class MainWindow : Window
    {
        public MainWindow()
        {
            InitializeComponent();
        }

        private void Button_Click(object sender, RoutedEventArgs e)
        {
            var items = MiniExcel.Query<DataInfo>("test2.xlsx");
            items = items.OrderBy(s => s.Longitude).ThenBy(s => s.Latitude).ToList();
            var x = items.Select(s => s.Longitude).Distinct().ToArray();
            var y = items.Select(s => s.Latitude).Distinct().ToArray();
            var values = items.Select(s => s.AccessCycle).ToArray();
            Debug.Assert(x.Length * y.Length == values.Length);

            var f = new double[x.Length, y.Length];
            for (int i = 0; i < x.Length; i++)
            {
                for (int j = 0; j < y.Length; j++)
                {
                    f[i, j] = values[i * y.Length + j];
                }
            }

            heatmap.Plot(f, x, y);
        }
    }

    public class DataInfo
    {
        public double Longitude { get; set; }
        public double Latitude { get; set; }
        public double AccessCycle { get; set; }
    }
}
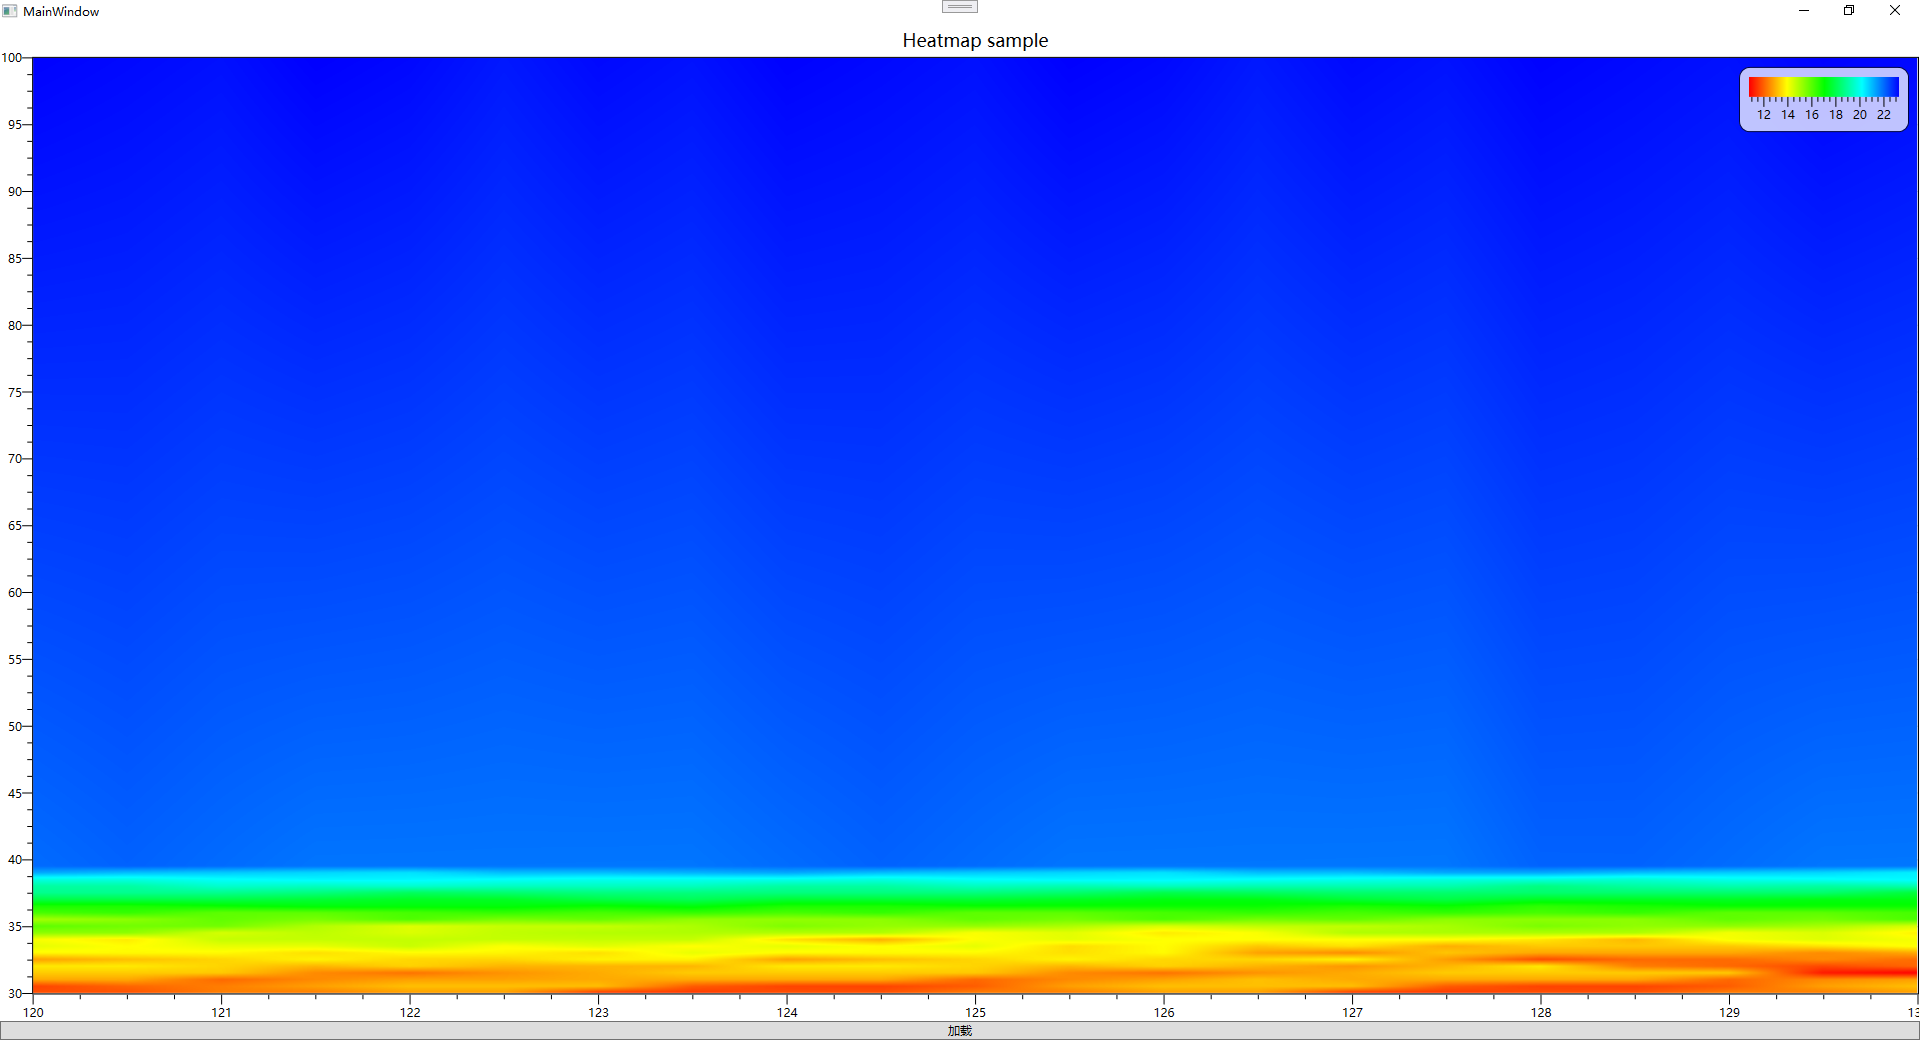
最终效果

试用总结
作为一个古老的控件,但是单单热力图这个功能,实现得相当靠谱。
生成热力图的时候,会同时要求提供X,Y,Z三个参数组。而且X,Y不要求均匀间隔,如果之间的间隔不均匀的时候,会自动进行插值。
生成的热力图最终图片有点像一张平滑处理过的图片。
LiveCharts2
也是一个开源的图表控件。LiveCharts2目前还在RC版本,没有正式发布。支持的平台很多,支持.NET FRAMEWORK和.NET CORE,除了支持WPF,也支持Avalonia这些平台,能够用来做跨平台的项目。
安装
因为还不是正式版,需要跟上具体的版本号安装。
Install-Package LiveChartsCore.SkiaSharpView.WPF -Version 2.0.0-rc4.5
前台界面
<Window
    x:Class="LiveChartDemo.MainWindow"
    xmlns="http://schemas.microsoft.com/winfx/2006/xaml/presentation"
    xmlns:x="http://schemas.microsoft.com/winfx/2006/xaml"
    xmlns:d="http://schemas.microsoft.com/expression/blend/2008"
    xmlns:local="clr-namespace:LiveChartDemo"
    xmlns:lvc="clr-namespace:LiveChartsCore.SkiaSharpView.WPF;assembly=LiveChartsCore.SkiaSharpView.WPF"
    xmlns:mc="http://schemas.openxmlformats.org/markup-compatibility/2006"
    Title="MainWindow"
    Width="800"
    Height="450"
    mc:Ignorable="d">

    <Grid>
        <!--<lvc:CartesianChart
            Series="{Binding Series}"
            XAxes="{Binding XAxes}"
            YAxes="{Binding YAxes}" />-->
        <lvc:CartesianChart Series="{Binding Series}" />
    </Grid>
</Window>
后台代码
using LiveChartsCore;
using LiveChartsCore.Defaults;
using LiveChartsCore.SkiaSharpView;
using MiniExcelLibs;
using SkiaSharp;

namespace LiveChartDemo
{
    public class MainWindowViewModel2
    {
        public ISeries[] Series { get; set; } = [
            new HeatSeries<WeightedPoint>
        {
            HeatMap = [
                SKColors.Blue.AsLvcColor(), // the first element is the "coldest"
                SKColors.Red.AsLvcColor() // the last element is the "hottest"
            ]
        }
        ];

        //public ICartesianAxis[] XAxes { get; set; } = [
        //    new Axis
        //{
        //    Labels = ["Charles", "Richard", "Ana", "Mari"]
        //}
        //];

        //public ICartesianAxis[] YAxes { get; set; } = [
        //    new Axis
        //{
        //    Labels = ["Jan", "Feb", "Mar", "Apr", "May", "Jun"]
        //}
        //];

        public MainWindowViewModel2()
        {
            var items = MiniExcel.Query<DataInfo>("test2.xlsx").ToList();

            var ser = Series.First();
            var list = new List<WeightedPoint>();
            foreach (var item in items)
            {
                list.Add(new WeightedPoint(item.Longitude, item.Latitude, item.AccessCycle));
            }
            ser.Values = list;
        }
    }

    public class DataInfo
    {
        public double Longitude { get; set; }
        public double Latitude { get; set; }
        public double AccessCycle { get; set; }
    }
}
试用总结
间隔均匀的热力图也没有啥问题。遇到间隔不均匀的数据,会出现中间的空白,不会像上一个控件一样,自动去补齐。

OxyPlot
也是开源的图表控件,目前也差不多是我们团队里面使用最多的图表控件。跟LiveChart2一样,支持.NET FRAMEWORK和.NET CORE,支持WPF和Avalonia这些平台,可以用来做跨平台开发项目。性能也不错。
安装
Install-Package OxyPlot.SkiaSharp.Wpf
前台代码
<Window
    x:Class="OxyPlotDemo.MainWindow"
    xmlns="http://schemas.microsoft.com/winfx/2006/xaml/presentation"
    xmlns:x="http://schemas.microsoft.com/winfx/2006/xaml"
    xmlns:d="http://schemas.microsoft.com/expression/blend/2008"
    xmlns:local="clr-namespace:OxyPlotDemo"
    xmlns:mc="http://schemas.openxmlformats.org/markup-compatibility/2006"
    xmlns:oxy="http://oxyplot.org/skiawpf"
    Title="MainWindow"
    Width="800"
    Height="450"
    mc:Ignorable="d">
    <Grid>
        <oxy:PlotView x:Name="plot" />
    </Grid>
</Window>
后台代码
using MiniExcelLibs;
using OxyPlot;
using OxyPlot.Axes;
using OxyPlot.Series;
using System.Diagnostics;
using System.Windows;

namespace OxyPlotDemo
{
    /// <summary>
    /// Interaction logic for MainWindow.xaml
    /// </summary>
    public partial class MainWindow : Window
    {
        public MainWindow()
        {
            InitializeComponent();

            plot.Model = GetPlotModel();
        }

        private PlotModel GetPlotModel()
        {
            var items = MiniExcel.Query<DataInfo>("test2.xlsx").ToList();
            items = items.OrderBy(s => s.Longitude).ThenBy(s => s.Latitude).ToList();
            var xvalues = items.Select(s => s.Longitude).Distinct().ToArray();
            var yvalues = items.Select(s => s.Latitude).Distinct().ToArray();
            var zvalues = items.Select(s => s.AccessCycle).ToArray();
            var min = zvalues.Min();
            var max = zvalues.Max();
            var len = max - min;
            Debug.Assert(xvalues.Length * yvalues.Length == zvalues.Length);

            var model = new PlotModel { Title = "Heatmap" };

            // Color axis (the X and Y axes are generated automatically)
            model.Axes.Add(new LinearColorAxis
            {
                Palette = OxyPalettes.Rainbow(100)
            });

            //// generate 2d normal distribution
            var data = new double[xvalues.Length, yvalues.Length];
            for (int x = 0; x < xvalues.Length; ++x)
            {
                for (int y = 0; y < yvalues.Length; ++y)
                {
                    data[y, x] = zvalues[y * xvalues.Length + x];
                }
            }

            var heatMapSeries = new HeatMapSeries
            {
                X0 = xvalues.Min(),
                X1 = xvalues.Max(),
                Y0 = yvalues.Min(),
                Y1 = yvalues.Max(),
                Interpolate = true,
                RenderMethod = HeatMapRenderMethod.Bitmap,
                Data = data
            };

            model.Series.Add(heatMapSeries);

            return model;
        }
    }

    public class DataInfo
    {
        public double Longitude { get; set; }
        public double Latitude { get; set; }
        public double AccessCycle { get; set; }
    }
}
试用总结
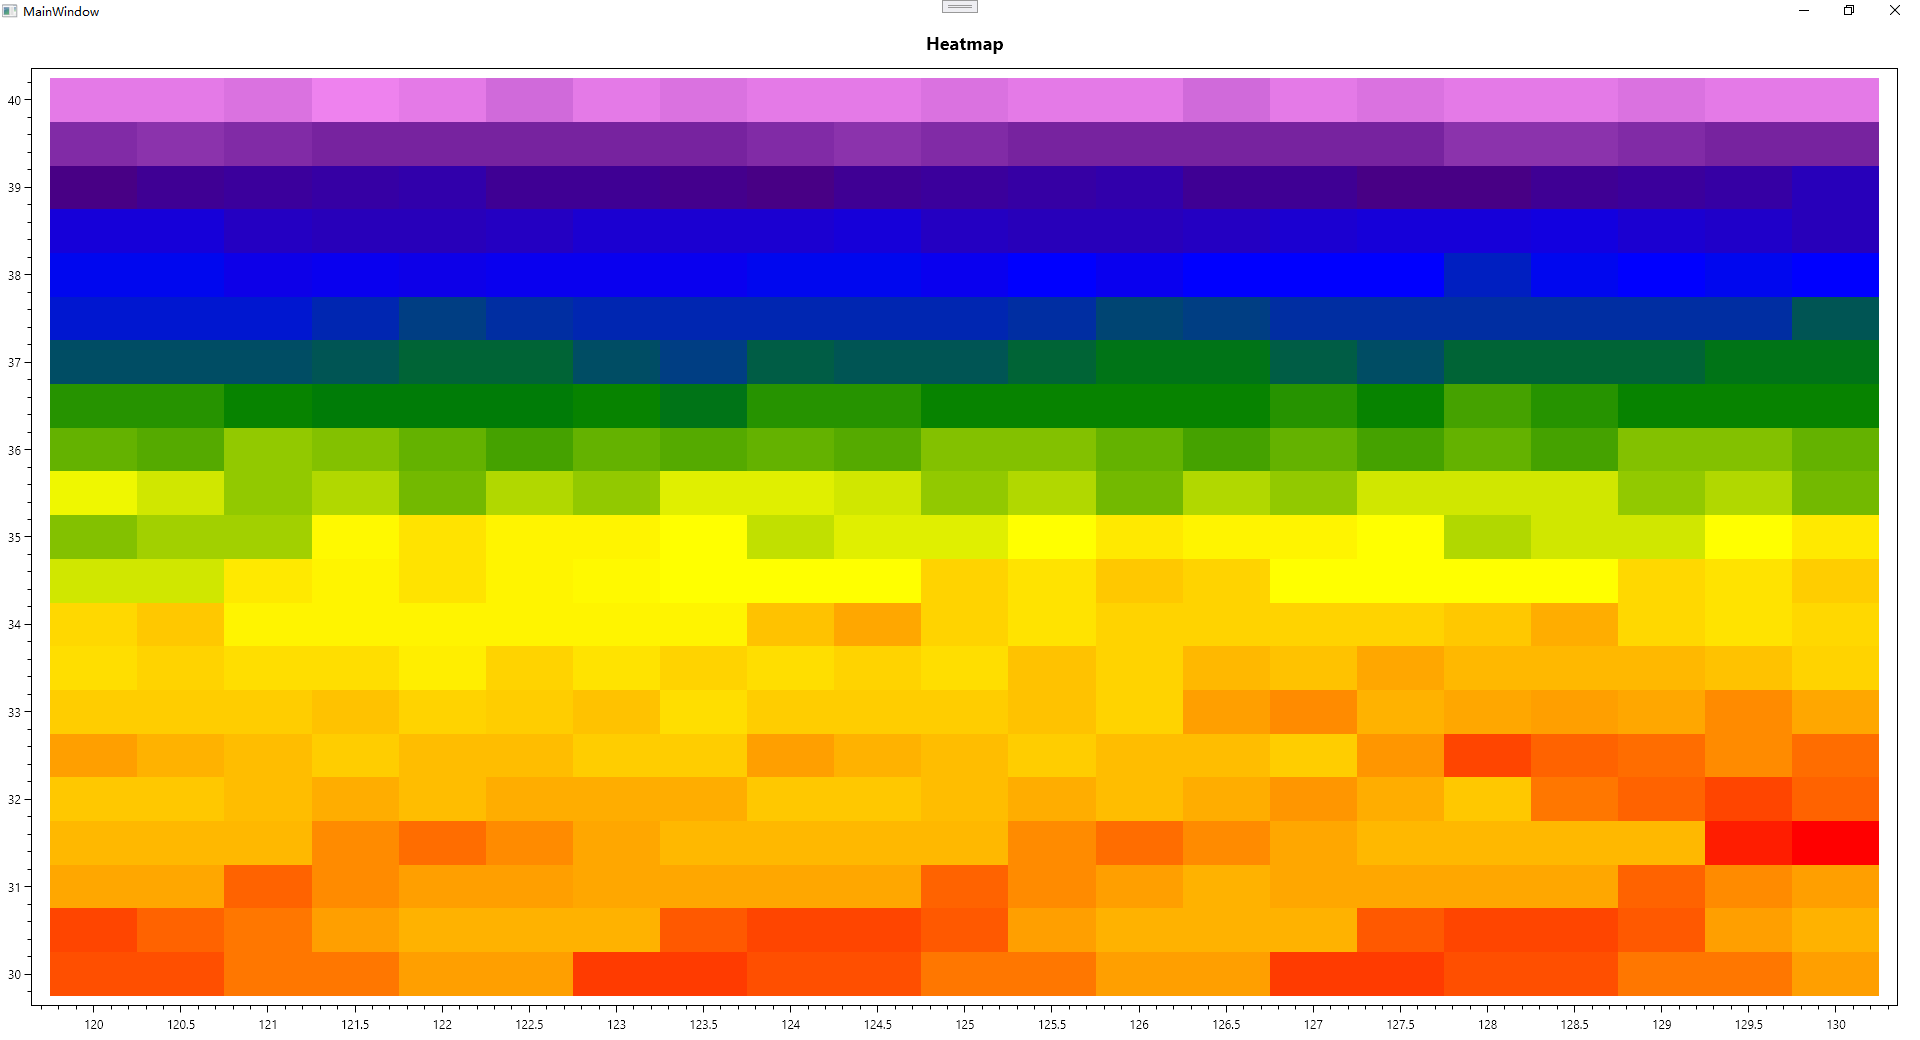
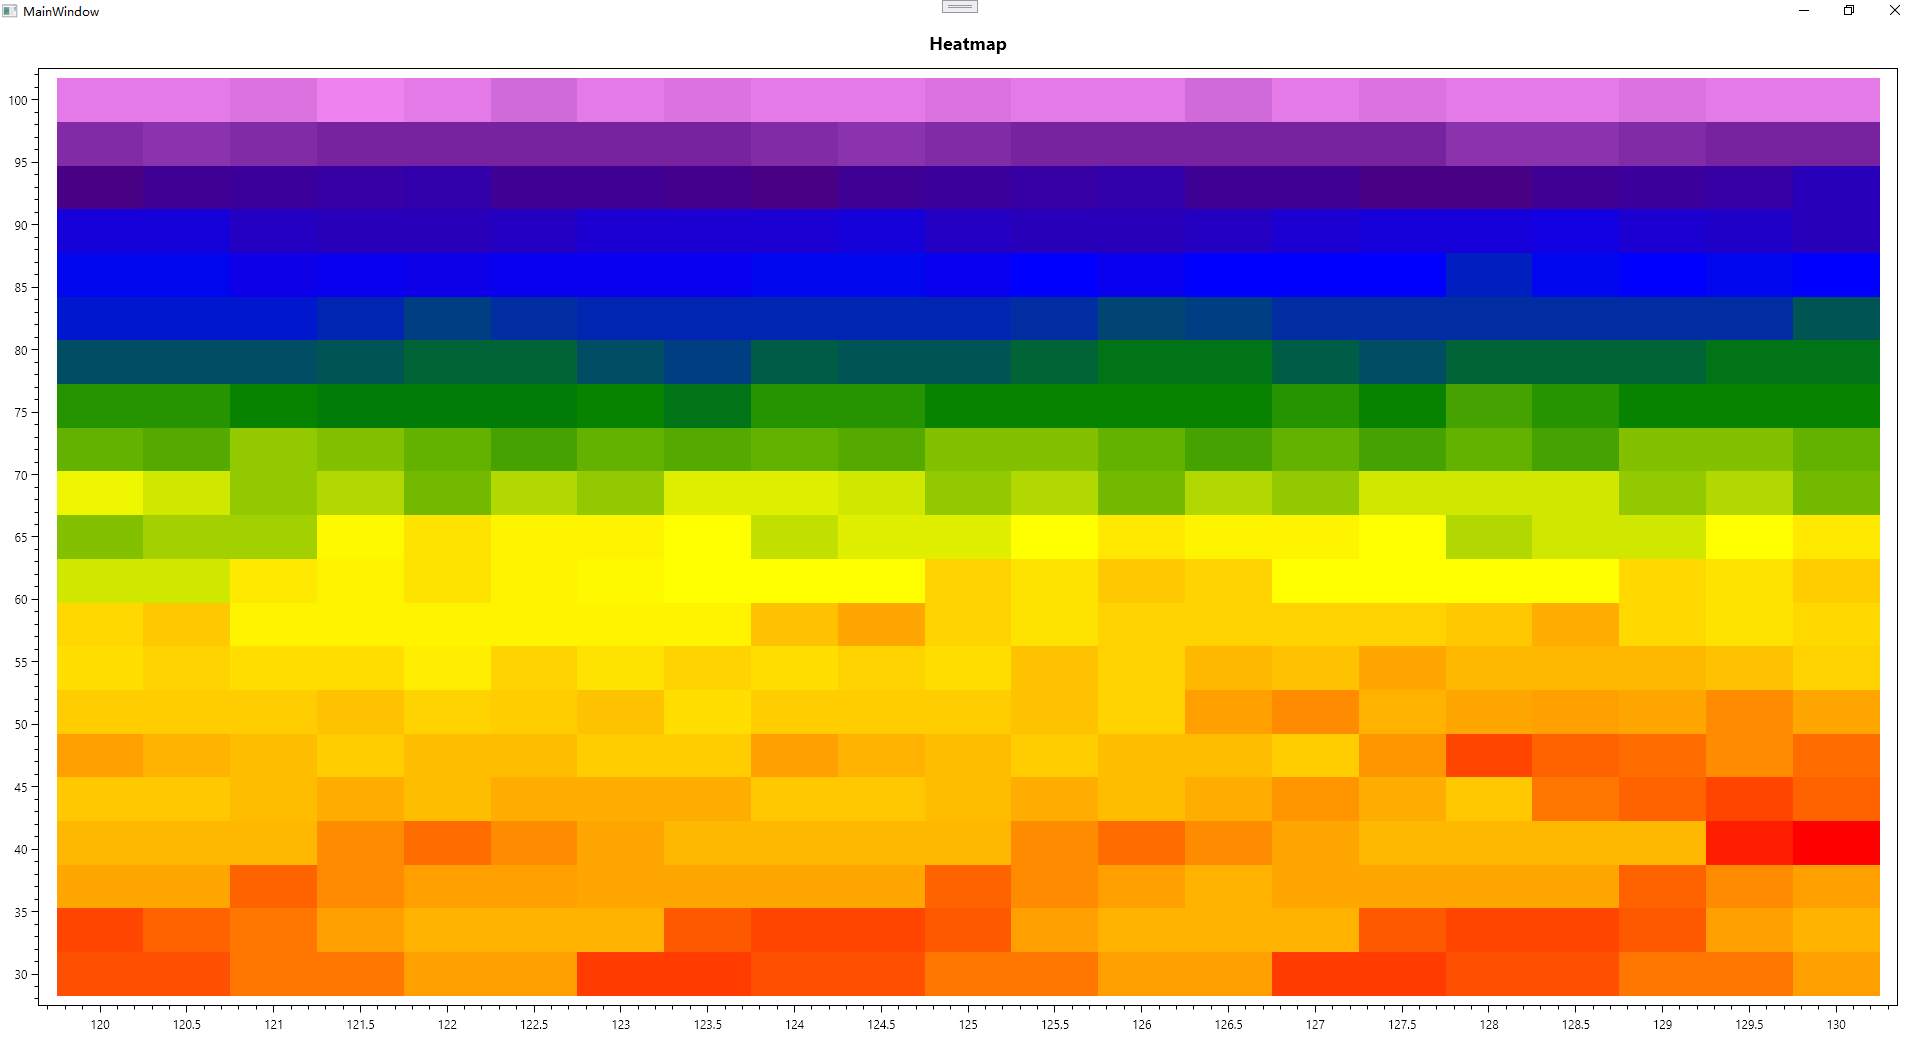
常规的热力图显示也没有问题。但是OxyPlot默认每个点之间的X和Y的间隔是均匀的。它的X轴和Y轴的区间是通过最大值和最小值去控制的,然后传进去的点,它会默认当作最大值和最小值之间均分的,所以如果点是不均匀的,最终显示的图会有期望的图有差异。
下面这张图是X和Y值间隔均匀的图像。应该是符合预期的。

下面是特意把最后一个点的Y轴从40改成100的情况,看起来跟40的貌似没啥区别,但这是不符合预期的。其实是应该像InteractiveDataDisplay.WPF显示的那样才对。

ScottPlot
这个控件貌似也有不少人使用,也听到不少人推荐。但我们团队用得不多,主要因为不熟,官方的示例和文档感觉有点偏简单,一些我们平常经常用的功能,或者开发过程中遇到的一些问题不好解决,然后本身可用的控件较多,所以这个控件就用得比较少。
安装
Install-Package ScottPlot.WPF
前台代码
<Window
    x:Class="ScottPlotDemo.MainWindow"
    xmlns="http://schemas.microsoft.com/winfx/2006/xaml/presentation"
    xmlns:x="http://schemas.microsoft.com/winfx/2006/xaml"
    xmlns:d="http://schemas.microsoft.com/expression/blend/2008"
    xmlns:local="clr-namespace:ScottPlotDemo"
    xmlns:mc="http://schemas.openxmlformats.org/markup-compatibility/2006"
    xmlns:wpf="clr-namespace:ScottPlot.WPF;assembly=ScottPlot.WPF"
    Title="MainWindow"
    Width="800"
    Height="450"
    mc:Ignorable="d">
    <Grid>
        <Grid.RowDefinitions>
            <RowDefinition Height="*" />
            <RowDefinition Height="Auto" />
        </Grid.RowDefinitions>
        <wpf:WpfPlot Name="plot" />

        <Button
            Grid.Row="1"
            Click="Button_Click"
            Content="加载" />
    </Grid>
</Window>
后台代码
using MiniExcelLibs;
using ScottPlot;
using System.Diagnostics;
using System.Windows;

namespace ScottPlotDemo
{
    /// <summary>
    /// Interaction logic for MainWindow.xaml
    /// </summary>
    public partial class MainWindow : Window
    {
        public MainWindow()
        {
            InitializeComponent();
        }

        private void Button_Click(object sender, RoutedEventArgs e)
        {
            var items = MiniExcel.Query<DataInfo>("test.xlsx").ToList();
            items = items.OrderBy(s => s.Longitude).ThenBy(s => s.Latitude).ToList();
            var x = items.Select(s => s.Longitude).Distinct().ToArray();
            var y = items.Select(s => s.Latitude).Distinct().ToArray();
            var values = items.Select(s => s.AccessCycle).ToArray();
            var min = values.Min();
            var max = values.Max();
            var len = max - min;
            Debug.Assert(x.Length * y.Length == values.Length);
            var f = new Coordinates3d[x.Length, y.Length];
            for (int i = 0; i < x.Length; i++)
            {
                for (int j = 0; j < y.Length; j++)
                {
                    var info = f[i, j];
                    var data = items[i * y.Length + j];
                    info.X = data.Longitude;
                    info.Y = data.Latitude;
                    info.Z = data.AccessCycle;
                }
            }

            //double[,] f2 = SampleData.MonaLisa();
            var map = plot.Plot.Add.Heatmap(f);
            map.Colormap = new ScottPlot.Colormaps.Turbo();
            plot.Plot.Add.ColorBar(map);

            plot.Plot.Axes.AutoScale();
            plot.Refresh();
        }
    }

    public class DataInfo
    {
        public double Longitude { get; set; }
        public double Latitude { get; set; }
        public double AccessCycle { get; set; }
    }
}
试用总结
热力图是画出来了,但是显示的图片完全一个颜色的,没有深浅的对比,尝试了不少方法,貌似都没折腾出来。
提供了蒙娜丽莎的测试数据,貌似可以显示出来,但是自己的数据显示就一个色的。
最后的总结
热力图,大部分的图表控件都是默认X和Y值间隔均匀的情况,并且大部分的图表控件,传点的时候,都是只传Z值的数值进去的。其实这也是热力图比较常规的使用方式。
不均匀的是不是显示成散点图会更合理一点?


【推荐】国内首个AI IDE,深度理解中文开发场景,立即下载体验Trae
【推荐】编程新体验,更懂你的AI,立即体验豆包MarsCode编程助手
【推荐】抖音旗下AI助手豆包,你的智能百科全书,全免费不限次数
【推荐】轻量又高性能的 SSH 工具 IShell:AI 加持,快人一步
· 阿里最新开源QwQ-32B,效果媲美deepseek-r1满血版,部署成本又又又降低了!
· 开源Multi-agent AI智能体框架aevatar.ai,欢迎大家贡献代码
· Manus重磅发布:全球首款通用AI代理技术深度解析与实战指南
· 被坑几百块钱后,我竟然真的恢复了删除的微信聊天记录!
· 没有Manus邀请码?试试免邀请码的MGX或者开源的OpenManus吧
2023-12-06 MAUI开发笔记(一)