
OxyPlot使用说明
锁定Y轴的缩放和移动
在Axis坐标轴上设置IsZoomEnabled和IsPanEnabled为false。
var rightAxis = new LinearAxis
{
    Position = AxisPosition.Right,
    Title = "Right Y Axis",
    Key = "Right Y Axis",
    Minimum = -0.02,
    Maximum = 1,
    IsZoomEnabled = false,
    IsPanEnabled = false,
};
自适应显示的时候上下留一点空隙
不设置的时候,数据会紧贴着上下边缘,有时候看起来不是很美观。
设置MinimumPadding和MaximumPadding,值的范围为0-1,0为不留空隙,1为100%。类似下面的0.05,相当于原来的长度为100,则上下多出5%作为空隙。
var leftAxis = new LinearAxis
{
    Position = AxisPosition.Left,
    Title = "Left Y Axis",
    Key = "Left Y Axis",
    MinimumPadding = 0.05,
    MaximumPadding = 0.05,
};
OxyPlot文本注释
要在OxyPlot中实现这样的功能,你可以通过添加数据点或注释(Annotations)来在图表上标记特定的事件。
// 假设 plotModel 是你的 PlotModel 实例
var plotModel = new PlotModel();

// 创建一个 LineSeries 来显示遥测数据
var telemetrySeries = new LineSeries { Title = "Telemetry Data" };
plotModel.Series.Add(telemetrySeries);

// 创建一个 ScatterSeries 用来显示命令数据点
var commandSeries = new ScatterSeries { MarkerType = MarkerType.Circle, MarkerSize = 5, Color = OxyColors.Red };
plotModel.Series.Add(commandSeries);

// 假设这是你的遥测数据更新函数
void UpdateTelemetryData(double time, double value)
{
    telemetrySeries.Points.Add(new DataPoint(time, value));
}

// 当命令发生时调用此函数
void OnCommandReceived(double time, string commandInfo)
{
    // 添加一个数据点来表示命令发生的时刻
    commandSeries.Points.Add(new ScatterPoint(time, 0));

    // 添加一个文本注释
    var annotation = new TextAnnotation
    {
        Text = commandInfo,
        Position = new DataPoint(time, 0),
        HorizontalAlignment = HorizontalAlignment.Center,
        VerticalAlignment = VerticalAlignment.Bottom
    };
    plotModel.Annotations.Add(annotation);
}
Oxyplot双Y轴坐标系
左右各一个Y轴坐标轴,不同的曲线或散点等绑定不同的坐标轴。
下面的例子,曲线绑定左侧的Y轴,散点绑定右侧的Y轴。
需要注意的是,左右两侧的坐标轴都需要设置Key,并且需要取不同的名字。
曲线上采用YAxisKey = leftAxis.Key的方式进行绑定。
public class MainViewModel
{
    public PlotModel Model { get; private set; }

    public MainViewModel()
    {
        var plotModel = new PlotModel { Title = "Dual Y-Axis Chart" };

        // 准备一些数据
        double[] xData = { 1, 2, 3, 4, 5 };
        double[] yDataLeft = { 1, 4, 9, 16, 25 };
        double[] yDataRight = { 0.1, 0.4, 0.9, 1.6, 2.5 };

        // 创建左侧Y轴
        var leftAxis = new LinearAxis
        {
            Position = AxisPosition.Left,
            Title = "Left Y Axis",
            Key = "Left Y Axis"
        };
        plotModel.Axes.Add(leftAxis);

        // 创建右侧Y轴
        var rightAxis = new LinearAxis
        {
            Position = AxisPosition.Right,
            Title = "Right Y Axis",
            Key = "Right Y Axis",
            Minimum = -0.02,
            Maximum = 1
        };
        plotModel.Axes.Add(rightAxis);

        // 创建左侧的曲线图 Series
        var lineSeriesLeft = new LineSeries
        {
            Title = "Curve Left",
            MarkerType = MarkerType.None,
            Color = OxyColors.Blue,
            YAxisKey = leftAxis.Key
        };
        for (int i = 0; i < xData.Length; i++)
        {
            lineSeriesLeft.Points.Add(new DataPoint(xData[i], 10000 + yDataLeft[i]));
        }
        plotModel.Series.Add(lineSeriesLeft);

        // 创建右侧的曲线图 Series
        var scatterSeries = new ScatterSeries
        {
            Title = "Scatter",
            MarkerType = MarkerType.Circle,
            MarkerSize = 5,
            MarkerFill = OxyColors.Red,
            YAxisKey = rightAxis.Key
        };
        for (int i = 0; i < xData.Length; i++)
        {
            scatterSeries.Points.Add(new ScatterPoint(xData[i], 0));
        }
        plotModel.Series.Add(scatterSeries);

        //var lineSeriesRight = new LineSeries
        //{
        //    Title = "Curve Right",
        //    MarkerType = MarkerType.Diamond,
        //    Color = OxyColors.Red,
        //    YAxisKey = rightAxis.Key
        //};
        //for (int i = 0; i < xData.Length; i++)
        //{
        //    //lineSeriesRight.Points.Add(new DataPoint(xData[i], yDataRight[i]));
        //    lineSeriesRight.Points.Add(new DataPoint(xData[i], 0));
        //}
        //plotModel.Series.Add(lineSeriesRight);

        // 创建 X 轴
        var xAxis = new LinearAxis
        {
            Position = AxisPosition.Bottom,
            Title = "X Axis"
        };
        plotModel.Axes.Add(xAxis);

        Model = plotModel;
    }
}
Oxyplot同时显示曲线图和散点图
using OxyPlot;
using OxyPlot.Series;
using OxyPlot.Axes;

// 创建一个新的 PlotModel 实例
var plotModel = new PlotModel { Title = "Curve and Scatter Plot" };

// 准备一些数据
double[] xData = { 1, 2, 3, 4, 5 };
double[] yDataCurve = { 1, 4, 9, 16, 25 };
double[] yDataScatter = { 1.1, 4.2, 9.1, 16.3, 25.2 };

// 创建曲线图 Series
var lineSeries = new LineSeries
{
    Title = "Curve",
    MarkerType = MarkerType.None,
    Color = OxyColors.Blue
};
for (int i = 0; i < xData.Length; i++)
{
    lineSeries.Points.Add(new DataPoint(xData[i], yDataCurve[i]));
}
plotModel.Series.Add(lineSeries);

// 创建散点图 Series
var scatterSeries = new ScatterSeries
{
    Title = "Scatter",
    MarkerType = MarkerType.Circle,
    MarkerSize = 5,
    MarkerFill = OxyColors.Red
};
for (int i = 0; i < xData.Length; i++)
{
    scatterSeries.Points.Add(new ScatterPoint(xData[i], yDataScatter[i]));
}
plotModel.Series.Add(scatterSeries);

// 设置轴
plotModel.Axes.Add(new LinearAxis { Position = AxisPosition.Bottom, Title = "X Axis" });
plotModel.Axes.Add(new LinearAxis { Position = AxisPosition.Left, Title = "Y Axis" });

// 显示图形
var plotView = new OxyPlot.WindowsForms.PlotView();
plotView.Model = plotModel;
// 如果是在 WinForms 中使用,可以将 plotView 添加到 Form 中
// this.Controls.Add(plotView);
OxyPlot饼图
var modelP1 = new PlotModel { Title = "Pie Sample1" };

dynamic seriesP1 = new PieSeries { StrokeThickness = 2.0, InsideLabelPosition = 0.8, AngleSpan = 360, StartAngle = 0 };

seriesP1.Slices.Add(new PieSlice("Africa", 1030) { IsExploded = false, Fill = OxyColors.PaleVioletRed });
seriesP1.Slices.Add(new PieSlice("Americas", 929) { IsExploded = true });
seriesP1.Slices.Add(new PieSlice("Asia", 4157) { IsExploded = true });
seriesP1.Slices.Add(new PieSlice("Europe", 739) { IsExploded = true });
seriesP1.Slices.Add(new PieSlice("Oceania", 35) { IsExploded = true });

modelP1.Series.Add(seriesP1);

Model = modelP1;
OxyPlot.SkiaSharp.Wpf的使用
安装:
Install-Package OxyPlot.SkiaSharp.Wpf
命名空间引用:
xmlns:oxy="http://oxyplot.org/skiawpf"
XAML代码:
<oxy:PlotView
    Grid.Row="1"
    Grid.Column="1"
    Model="{Binding Model}" />
后台代码:
Model = new PlotModel { Title = "曲线图1", DefaultFont = "微软雅黑" };
其中DefaultFont用来指定默认字体,用来解决中文乱码的问题。
OxyPlot柱形图
var model = new PlotModel { };

var barSeries = new BarSeries
{
    ItemsSource = dict2.Select(s => new BarItem() { Value = s.Value }),
    LabelPlacement = LabelPlacement.Inside,
};
model.Series.Add(barSeries);

model.Axes.Add(new CategoryAxis
{
    Position = AxisPosition.Left,
    ItemsSource = dict2.Select(s => s.Key.ToString())
});
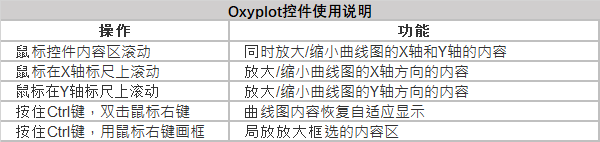
常用操作说明


【推荐】国内首个AI IDE,深度理解中文开发场景,立即下载体验Trae
【推荐】编程新体验,更懂你的AI,立即体验豆包MarsCode编程助手
【推荐】抖音旗下AI助手豆包,你的智能百科全书,全免费不限次数
【推荐】轻量又高性能的 SSH 工具 IShell:AI 加持,快人一步
· DeepSeek 开源周回顾「GitHub 热点速览」
· 物流快递公司核心技术能力-地址解析分单基础技术分享
· .NET 10首个预览版发布:重大改进与新特性概览!
· AI与.NET技术实操系列(二):开始使用ML.NET
· .NET10 - 预览版1新功能体验(一)
2018-08-07 关于软件版本号更新