条形图
条形图 barplot
定义
用宽度相同的条形来表示各类别频数多少的图形。
- 水平条形图:类别在纵轴
- 垂直条形图(柱形图):类别在横轴
根据绘制变量的多少,条形图分为:
- (一个类别变量)简单条形图(柱状图 and 水平条形图)、帕累托图(简单的变形)
- (两个类别变量)复式条形图(并列条形图 and 堆叠条形图)、脊形图(堆叠的变形)
- (多个类别变量)马赛克图
实操:
先把基础代码带上:
import matplotlib.pyplot as plt
import numpy as np
import pandas as pd
plt.rcParams["font.sans-serif"] = "SimHei"
plt.rcParams["axes.unicode_minus"] = False   # 设置中文、负号正常显示
语法解释:
plt.bar(left, height, width=0.8, bottom=None, hold=None, data=None, **kwargs)
- left : 标量序列,每条条形图左边的左边坐标
- height :标量序列,条形图的高度
- width : 标量或数组类,可选
条形的宽度,默认0.8 - bottom : 标量或数组类,可选
条形图的y坐标,默认:None - color : 标量或数组类,可选
条形的颜色 - edgecolor : 标量或数组类,可选
条形图边缘的颜色 - linewidth :标量或数组类,可选
条形边缘线的宽度,默认None - tick_label : 字符串或数组类,可选
条形标记,默认None - xerr : 标量或数组类,可选
如果不是None,将用于在条形图上生成errorbar(s).默认None - yerr : 标量或数组类,可选
如果不是None,将用于在条形图上生成errorbar(s),默认None - ecolor : 标量或数组类,可选
指定errorbar(s)的颜色,默认None - align : {'center', 'edge'}, 可选
如果是“edge”,则对齐条的左侧边(垂直条)和底部边(水平条)。如果是“center”,则将“left”参数解释为各杆中心的坐标。为了对齐右边的对齐 条,传递一个负的“width”。 - orientation : 条形图的方向,{'vertical', 'horizontal'}, 可选
……
一.最最简单的barplot——堪称原始版
plt.bar(left = 0, height = 6.9)
plt.title("我是个孤独的大胖纸条形图", fontsize = 18, color = "b")
plt.show()

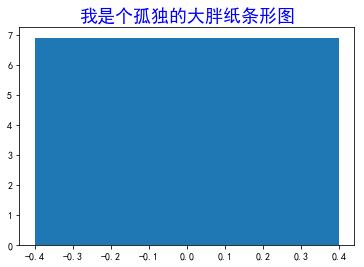
只有一个条形,条形的默认宽度为0.8。这是一个竖起来的大胖纸(●'◡'●)
下面看水平的条形图函数:专用版plt.barh()
barh(bottom, width, height=0.8, left=None, hold=None, **kwargs)
plt.barh(bottom = 1, width = 6)    #bottom相当于left,width相当于height
plt.title("我是个横躺的大胖妹条形图", fontsize = 18, color = "#EF3C7B")
plt.show()

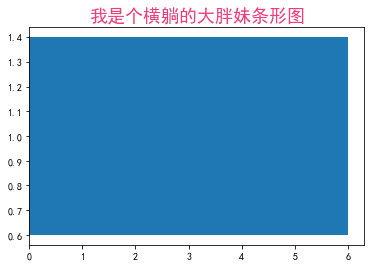
这是一个横躺着的大胖妹(●'◡'●),一个条的宽度为0.8,default大胖妹
二.来看看普通常见的条形图——简单条形图
2.1.垂直条形图
plt.figure(figsize = (7,7))   #设置图形尺寸
plt.bar(left=(0,1),       #设置条形图左边的x坐标
        height=(10,23),   #设置条形图高度
        width = 0.3,       #设置条形图宽度,每根条形粗细可一致or不一致
        color = ("b","#DF004F"), #设置每条条形图的颜色
        edgecolor = ("r", "k"),    #设置条形边框的线条颜色
        linewidth = (3,4),         #设置条形边框的宽度
        tick_label = ("男","女"),   #设置每条条形的类别名称
        align = "center"            #设置tick_label在条形的边上 或者 条形居中位置
       )
plt.xlabel("性别", fontsize = 15)   #横坐标轴名称
plt.ylabel("人数", fontsize = 15)   #纵坐标轴名称
plt.xlim(-1,2)       #设置横坐标轴范围
plt.ylim(0,25)        #设置纵坐标轴的范围
plt.title("男女人数",fontsize = "xx-large",color = "#CD0074")  #标题设置
plt.text(-0.1,10.5,"10",fontsize = 19)
plt.text(0.9,23.5,"23",fontsize = 19)
plt.show()

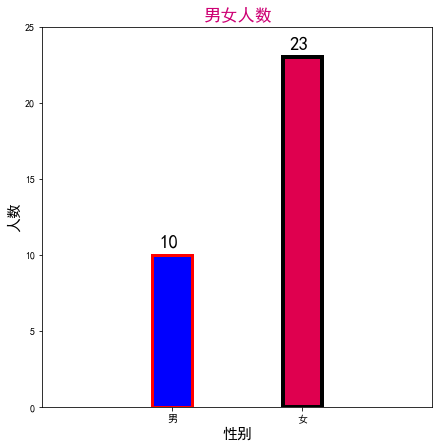
颜色不怎么好看,重在展示了里面的参数设置,以后想怎么来怎么来!!!
** 拓:plt.text**(今天遇上了就想研究一下,赶时间的飘过即可)
plt.text(x, y, s, fontdict=None, withdash=False, **kwargs)
- 作用: 往坐标轴里添加文本
- x : 第一个参数是x轴坐标
- y : 第二个参数是y轴坐标
- s : 第三个参数是要显式的内容
- alpha : 设置字体的透明度
- family : 设置字体
- size : 设置字体的大小
- style : 设置字体的风格
- wight : 字体的粗细
- bbox : 给字体添加框,alpha 设置框体的透明度, facecolor 设置框体的颜色
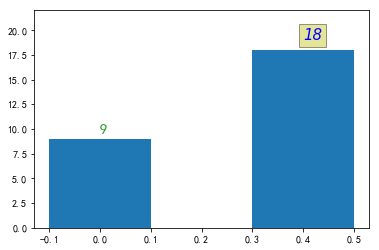
plt.bar(left = (0,0.4), height = (9,18), width = 0.2 )
plt.text(0, 9.5, "9", size = 15, alpha = 0.8, color = "G")
plt.text(0.4, 19, "18", size = 15, family = "5fantasy", color = "b", style = "italic", weight = "light",\
         bbox = dict(facecolor = "y", alpha = 0.4))
plt.ylim(0,22)
plt.show()
F:\Anaconda\lib\site-packages\matplotlib\font_manager.py:1297: UserWarning: findfont: Font family ['5fantasy'] not found. Falling back to DejaVu Sans
  (prop.get_family(), self.defaultFamily[fontext]))

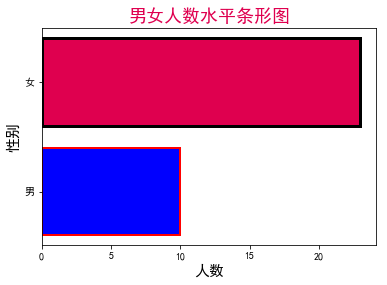
2.2.水平条形图
plt.barh(bottom = (1,2),
        width = (10,23),
        color = ("b","#DF004F"),
        edgecolor = ("r", "k"),
        linewidth = (2,3),
        tick_label = ("男","女"),
        align = "center",
        )
plt.title("男女人数水平条形图", fontsize = 18, color = '#DF004F')
plt.xlabel("人数", fontsize = 15)
plt.ylabel("性别", fontsize = 15)
plt.show()

三.下面来看看复式条形图——并列and堆叠条形图
3.1.并列条形图
y1 = [14, 29, 20, 25]
y2 = [28, 10, 25, 18]
plt.bar(left = (1, 2, 3, 4), height = y1, width = 0.3, color = "#DF004F", label = "y1")
plt.bar(left = (1.3, 2.3, 3.3, 4.3), height = y2, width = 0.3, color = "b", label = "y2")
plt.legend(loc = "best")
plt.show()

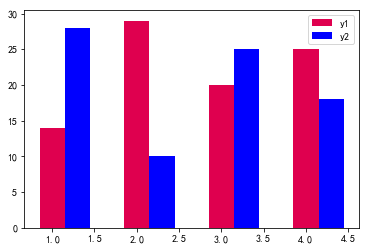
注意left、width,不然各种重叠,啊哈哈(●'◡'●)
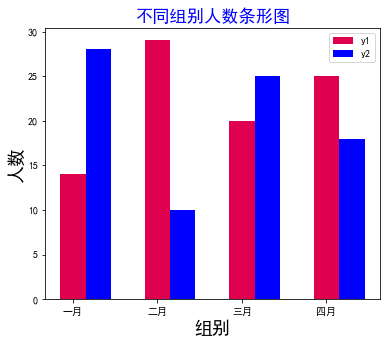
接下面来美化一下
y1 = [14, 29, 20, 25]
y2 = [28, 10, 25, 18]
plt.figure(figsize = (6,5))
plt.bar(left = (1, 2, 3, 4), height = y1, width = 0.3, color = "#DF004F", label = "y1" )
plt.bar(left = (1.3, 2.3, 3.3, 4.3), height = y2, width = 0.3, color = "b", label = "y2")
plt.legend(loc = "best")
plt.xlabel("组别", fontsize = 18)
plt.ylabel("人数", fontsize = 18)
plt.xticks(range(1,5),("一月","二月","三月","四月"))  #给横坐标添加类别标签
plt.title("不同组别人数条形图", fontsize = "xx-large", color = "b")
plt.show()

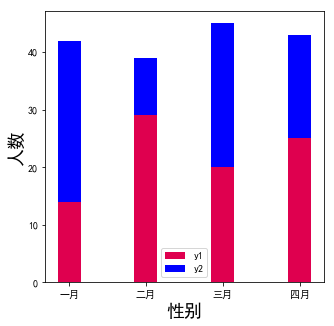
3.2.堆叠条形图
plt.figure(figsize = (5,5))
y1 = [14, 29, 20, 25]
y2 = [28, 10, 25, 18]
plt.bar(left = (1, 2, 3, 4), height = y1, width = 0.3, color = "#DF004F", label = "y1" )
plt.bar(left = (1, 2, 3, 4), height = y2, width = 0.3, bottom = y1, color = "b", label = "y2")#与并列不同的是,left、width都要一样,多加一个bottom
plt.legend(loc = "best")
plt.xlabel("性别", fontsize = 18)
plt.ylabel("人数", fontsize = 18)
plt.xticks(range(1,5),("一月","二月","三月","四月"))
plt.show()

- plt.bar()水平画法还没搞定,
- 帕累托图(简单的变形)、脊形图(堆叠的变形)、马赛克图还没完成
欢迎指错。 Thanks!


