泰坦尼克号生存预测
持续优化中~~~
研究背景:
泰坦尼克号的沉没是历史上最臭名昭著的沉船之一。1912年4月15日,泰坦尼克号在处女航时与冰山相撞沉没,2224名乘客和船员中有1502人遇难。这一耸人听闻的悲剧震惊了国际社会,并导致更好的船舶安全法规。船难造成如此巨大的人员伤亡的原因之一是船上没有足够的救生艇供乘客和船员使用。虽然在沉船事件中幸存下来是有运气因素的,但有些人比其他人更有可能存活下来。比如妇女、儿童和上层阶级。
在Kaggle提供的数据集里,我们通过891个样本,关于乘客的个人信息,来预测哪一类人更有可能存活下来。
目录:
一.提出问题
二.理解数据
三.数据预处理
四.特征工程
五.模型构建与评估
六.总结
一.提出问题:
根据已知信息(891名乘客的姓名、性别、年龄、船舱等级、票价等信息及最终的生存情况,预测新的418名乘客生存情况。

问题分析:
已知的乘客信息中,存在定量特征和定性特征,以及乘客最后的生存情况,现在要根据以上信息,去预测新的418名乘客的生存情况。这属于监督学习的分类问题(二分类)。有监督机器学习领域中包含可用于分类的方法包括:逻辑回归、KNN、决策树、随机森林、支持向量机、神经网络、梯度提升树等。
二.理解数据:
先初步了解一下变量个数、数据类型、分布情况、缺失情况等,并做出一些猜想。
#调入基本模块
import numpy as np
import pandas as pd
import re

#导入作图模块
import matplotlib.pyplot as plt
%matplotlib inline
plt.rcParams["font.sans-serif"]=["SimHei"] #正常显示中文标签
plt.rcParams["axes.unicode_minus"]=False   #正常显示负号
import seaborn as sns

#设置作图风格
sns.set_style("darkgrid")

import warnings
warnings.filterwarnings
<function warnings.filterwarnings>
OK,先浏览训练集数据:
#读入数据
train = pd.read_csv(r"G:\Kaggle\Titanic\train.csv")
test = pd.read_csv(r"G:\Kaggle\Titanic\test.csv")

#后面output制表需要,将PassengerId独立出来
ID = test["PassengerId"]

#看一下训练集前6行
train.head(6)
| PassengerId | Survived | Pclass | Name | Sex | Age | SibSp | Parch | Ticket | Fare | Cabin | Embarked | |
|---|---|---|---|---|---|---|---|---|---|---|---|---|
| 0 | 1 | 0 | 3 | Braund, Mr. Owen Harris | male | 22.0 | 1 | 0 | A/5 21171 | 7.2500 | NaN | S |
| 1 | 2 | 1 | 1 | Cumings, Mrs. John Bradley (Florence Briggs Th... | female | 38.0 | 1 | 0 | PC 17599 | 71.2833 | C85 | C |
| 2 | 3 | 1 | 3 | Heikkinen, Miss. Laina | female | 26.0 | 0 | 0 | STON/O2. 3101282 | 7.9250 | NaN | S |
| 3 | 4 | 1 | 1 | Futrelle, Mrs. Jacques Heath (Lily May Peel) | female | 35.0 | 1 | 0 | 113803 | 53.1000 | C123 | S |
| 4 | 5 | 0 | 3 | Allen, Mr. William Henry | male | 35.0 | 0 | 0 | 373450 | 8.0500 | NaN | S |
| 5 | 6 | 0 | 3 | Moran, Mr. James | male | NaN | 0 | 0 | 330877 | 8.4583 | NaN | Q |
训练集字段:乘客ID、是否生存、舱位等级、姓名、性别、年龄、堂兄弟和堂兄妹总人数、父母和孩子的总人数、船票编码、票价、客舱、上船口岸。
接下来看测试集数据:
test.sample(6)
| PassengerId | Pclass | Name | Sex | Age | SibSp | Parch | Ticket | Fare | Cabin | Embarked | |
|---|---|---|---|---|---|---|---|---|---|---|---|
| 182 | 1074 | 1 | Marvin, Mrs. Daniel Warner (Mary Graham Carmic... | female | 18.0 | 1 | 0 | 113773 | 53.1000 | D30 | S |
| 290 | 1182 | 1 | Rheims, Mr. George Alexander Lucien | male | NaN | 0 | 0 | PC 17607 | 39.6000 | NaN | S |
| 124 | 1016 | 3 | Kennedy, Mr. John | male | NaN | 0 | 0 | 368783 | 7.7500 | NaN | Q |
| 350 | 1242 | 1 | Greenfield, Mrs. Leo David (Blanche Strouse) | female | 45.0 | 0 | 1 | PC 17759 | 63.3583 | D10 D12 | C |
| 251 | 1143 | 3 | Abrahamsson, Mr. Abraham August Johannes | male | 20.0 | 0 | 0 | SOTON/O2 3101284 | 7.9250 | NaN | S |
| 407 | 1299 | 1 | Widener, Mr. George Dunton | male | 50.0 | 1 | 1 | 113503 | 211.5000 | C80 | C |
与训练集相比,测试集少了目标变量Survived(又叫因变量or标签),其余字段都是一样的。
2.1数据质量分析
2.1.1 缺失值分析
train.info()
print("==" * 50)
test.info()
<class 'pandas.core.frame.DataFrame'>
RangeIndex: 891 entries, 0 to 890
Data columns (total 12 columns):
PassengerId    891 non-null int64
Survived       891 non-null int64
Pclass         891 non-null int64
Name           891 non-null object
Sex            891 non-null object
Age            714 non-null float64
SibSp          891 non-null int64
Parch          891 non-null int64
Ticket         891 non-null object
Fare           891 non-null float64
Cabin          204 non-null object
Embarked       889 non-null object
dtypes: float64(2), int64(5), object(5)
memory usage: 83.6+ KB
====================================================================================================
<class 'pandas.core.frame.DataFrame'>
RangeIndex: 418 entries, 0 to 417
Data columns (total 11 columns):
PassengerId    418 non-null int64
Pclass         418 non-null int64
Name           418 non-null object
Sex            418 non-null object
Age            332 non-null float64
SibSp          418 non-null int64
Parch          418 non-null int64
Ticket         418 non-null object
Fare           417 non-null float64
Cabin          91 non-null object
Embarked       418 non-null object
dtypes: float64(2), int64(4), object(5)
memory usage: 36.0+ KB
- train总共有891名乘客信息、12个字段,Age、Cabin、Embarked均有缺失。
- test总共有418名乘客信息、11个字段,Age、Fare、Cabin均有缺失。
- 现在数据集中有字符串、浮点型、整型数据。
- 根据个人理解,重新划分数据类型:
定类型:PassengerId、Survived、Name、Sex、Ticket、Cabin、Embarked
定距型:Age、Sibsp、Parch、Fare
定序型:Pclass
后面要用Sklearn来建模,因为模型有要求用数值型数据,所以后续将转换数据类型。
print("训练集:")
print("年龄缺失个数:",train.Age.isnull().sum())
print("船舱编码缺失个数:",train.Cabin.isnull().sum())
print("上船地点缺失个数:",train.Embarked.isnull().sum())
print("测试集:")
print("年龄缺失个数:",test.Age.isnull().sum())
print("船票价格缺失个数:",test.Fare.isnull().sum())
print("船舱编码缺失个数:",test.Cabin.isnull().sum())
训练集:
年龄缺失个数: 177
船舱编码缺失个数: 687
上船地点缺失个数: 2
测试集:
年龄缺失个数: 86
船票价格缺失个数: 1
船舱编码缺失个数: 327
整个数据集样本量相对较少,船舱编码缺失较多,年龄也有相当一部分存在缺失情况,票价、上船地点分别缺失1个、2个。
- 对于较多缺失值的特征考虑是否删除(删除带有缺失值的样本或者特征)或构造新变量帮助建模。
- 对于缺失较少的特征,可考虑用众数、平均值、中位数来填补,或者更好的填补方法。
针对本次建模,因数据量较少,不便删除带缺失值的样本,考虑能否构建新变量来建模。
删除对建模没有帮助的PassengerId
train = train.drop("PassengerId", axis=1)
test = test.drop("PassengerId", axis=1)
2.1.1 异常值分析
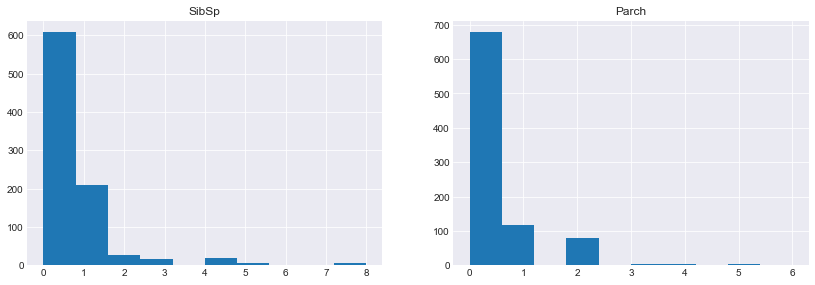
现仅对定距型数据(Age、SibSp、Parch、Fare)进行异常值分析,看是否有个别值偏离整体分布。
train.describe()
| Survived | Pclass | Age | SibSp | Parch | Fare | |
|---|---|---|---|---|---|---|
| count | 891.000000 | 891.000000 | 714.000000 | 891.000000 | 891.000000 | 891.000000 |
| mean | 0.383838 | 2.308642 | 29.699118 | 0.523008 | 0.381594 | 32.204208 |
| std | 0.486592 | 0.836071 | 14.526497 | 1.102743 | 0.806057 | 49.693429 |
| min | 0.000000 | 1.000000 | 0.420000 | 0.000000 | 0.000000 | 0.000000 |
| 25% | 0.000000 | 2.000000 | 20.125000 | 0.000000 | 0.000000 | 7.910400 |
| 50% | 0.000000 | 3.000000 | 28.000000 | 0.000000 | 0.000000 | 14.454200 |
| 75% | 1.000000 | 3.000000 | 38.000000 | 1.000000 | 0.000000 | 31.000000 |
| max | 1.000000 | 3.000000 | 80.000000 | 8.000000 | 6.000000 | 512.329200 |
fig1 = plt.figure(figsize = (13,5))
ax1 = fig1.add_subplot(1,2,1)
age = train.Age.dropna(axis=0)   #移除缺失值,才可以作图
ax1.boxplot(age,showmeans=True)
ax1.set_title("Age")
ax2 = fig1.add_subplot(1,2,2)
ax2.boxplot(train.Fare,showmeans=True)
ax2.set_title("Fare")
<matplotlib.text.Text at 0x2599db89e8>

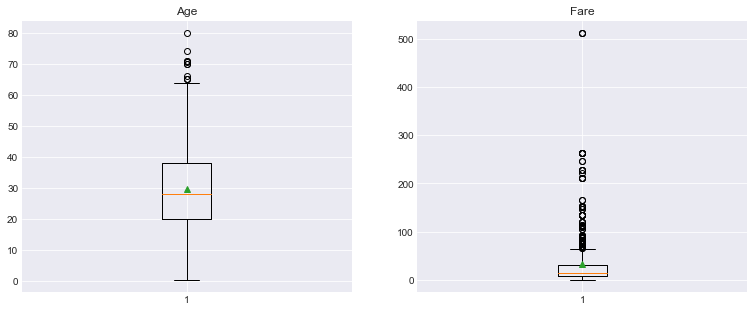
fig2 = plt.figure(figsize = (14,4.5))
ax1 = fig2.add_subplot(1,2,1)
ax1.hist(train.SibSp)
ax1.set_title("SibSp")
ax2 = fig2.add_subplot(1,2,2)
ax2.hist(train.Parch)
ax2.set_title("Parch")
<matplotlib.text.Text at 0x2599fb17b8>

- 年龄:最小值为0.42,中位数、平均值在29附近,75%的乘客在38岁以下,整体相对年轻;但是有部分乘客年龄偏大,超过64岁。数据分布较分散,后期要将年龄分组。
- 船票价格:最小值为0,平均数为32,中位数为14,即50%的乘客分布在14岁及以下,75%的乘客集中在31岁及以下。很明显看到它的箱线图中存在大量偏大的异常值,箱体被压得很扁,说明船票的价格分布很散,后期也要将数据分组建模。
- 堂兄弟和堂兄妹总人数:每名乘客平均有0.5名同代的兄弟姐妹陪伴,50%的人没有同代人一起登船,3/4分位数时,人数才达到1,最大值为8。分布较散。
- 父母和孩子的总人数:每名乘客平均有0.38名的父母或孩子一起登船,75%的乘客都没有他们的陪同。
针对SibSp、Parch这两个特征,后面考虑将这两个变量相加构成新特征,看它对乘客生存的影响是否明显,帮助我们的建模。
2.2 数据特征分析
2.2.1 分布分析
上面已知数值型数据的分布情况,接下来看定类型数据的分布情况:
train.describe(include=['O'])
| Name | Sex | Ticket | Cabin | Embarked | |
|---|---|---|---|---|---|
| count | 891 | 891 | 891 | 204 | 889 |
| unique | 891 | 2 | 681 | 147 | 3 |
| top | Williams, Mr. Charles Eugene | male | 1601 | C23 C25 C27 | S |
| freq | 1 | 577 | 7 | 4 | 644 |
训练集中:
(1)每个人的名字都是无重复的
(2)男性共计577人,男乘客较女乘客多
(3)Ticket有681个不同的值
(4)Cabin的数据缺失较多,891人中有记录的仅为204人
(5)上船口岸有三个,存在缺失值;644人在S港口上船,占比较大
2.2.2 相关性分析
现已知目标变量为Survived,其余特征都作为建模可供考虑的因素。下面我们要探究一下现有的每一个变量对乘客生存的影响程度,有用的留下,没用的删除,也看能不能发掘出新的信息帮助构建模型。可做出以下猜想:
(1)Pclass、Fare反映一个人的身份、财力情况,在危难关头,社会等级高的乘客的生存率比等级低的乘客的生存率高。
(2)在灾难发生时,人类社会的尊老爱幼、女性优先必会起作用。故老幼、女性生存率更高。
(3)有多个亲人同行的话,人多力量大,生存率可能更高些。
(4)名字、Ticket看不出能反映什么,可能会删掉。
(5)Id在记录数据中有用,在分析中没什么用,删掉。
(6)对于缺失的数据,需要根据不同情况进行处理。
(7)字符型都要转换成数值型数据。
下面对数据进行转换处理,再进行上诉的验证。
三.数据预处理
首先合并train和test,为了后续写代码能同时处理两个数据集:
entire_data = [train,test]
下面将根据现在数据的类型,分数值型和字符串来讨论、研究,同时完成缺失值进行处理、根据每个变量与生存率之间的关系进行选择,必要时将删除变量或者创造出新的变量来帮助模型的构建。最终所有的数据类型都将处理为数值型。
train.head(2)
| Survived | Pclass | Name | Sex | Age | SibSp | Parch | Ticket | Fare | Cabin | Embarked | |
|---|---|---|---|---|---|---|---|---|---|---|---|
| 0 | 0 | 3 | Braund, Mr. Owen Harris | male | 22.0 | 1 | 0 | A/5 21171 | 7.2500 | NaN | S |
| 1 | 1 | 1 | Cumings, Mrs. John Bradley (Florence Briggs Th... | female | 38.0 | 1 | 0 | PC 17599 | 71.2833 | C85 | C |
test.head(2)
| Pclass | Name | Sex | Age | SibSp | Parch | Ticket | Fare | Cabin | Embarked | |
|---|---|---|---|---|---|---|---|---|---|---|
| 0 | 3 | Kelly, Mr. James | male | 34.5 | 0 | 0 | 330911 | 7.83 | NaN | Q |
| 1 | 3 | Wilkes, Mrs. James (Ellen Needs) | female | 47.0 | 1 | 0 | 363272 | 7.00 | NaN | S |
3.1缺失值处理:
已知缺失值
训练集:
年龄缺失个数: 177
船舱编码缺失个数: 687
上船地点缺失个数: 2
测试集:
年龄缺失个数: 86
船票价格缺失个数: 1
船舱编码缺失个数: 327
3.1.1Cabin
船舱编码缺失较严重,我们考虑构造新变量,是否有船舱编码为新特征,看它对乘客的生存是否存在影响:
train["has_cabin"] = train.Cabin.map(lambda x:1 if type(x)==str else 0)
sns.barplot(x="has_cabin",y="Survived",data=train)
<matplotlib.axes._subplots.AxesSubplot at 0x259991cda0>

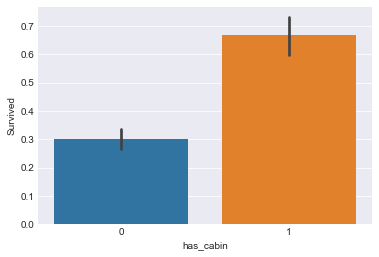
在该样本中,对于构造的新变量has_cabin,有船舱编码的乘客生存率接近70%,而没有船舱编码乘客的生存率仅为30%,所以将该新变量作为建模的特征。对于原来的Cabin变量我们删除掉,也要将测试集 中的Cabin变量转换成新变量。
test["has_cabin"] = test.Cabin.map(lambda x :1 if type(x)==str else 0)
for data in entire_data:
    del data["Cabin"]
3.1.2 Embarked
train[["Embarked","Survived"]].groupby("Embarked",as_index=False).count().sort_values("Survived",ascending=False)
| Embarked | Survived | |
|---|---|---|
| 2 | S | 644 |
| 0 | C | 168 |
| 1 | Q | 77 |
train[["Embarked","Survived"]].groupby("Embarked",as_index=False).mean().sort_values("Survived",ascending=False)
| Embarked | Survived | |
|---|---|---|
| 0 | C | 0.553571 |
| 1 | Q | 0.389610 |
| 2 | S | 0.336957 |
大部分人在S地点上船,接着是C、Q。不同的上船地点的生存率是不一样的,C> Q> S。
仅训练集中缺失两个值,用众数代替
train.Embarked.mode()
0    S
dtype: object
train["Embarked"].fillna("S",inplace=True)
3.1.3 Fare
测试集中有两个Fare缺失值,先观察一下训练集中的数据:
train.Fare.describe()
count    891.000000
mean      32.204208
std       49.693429
min        0.000000
25%        7.910400
50%       14.454200
75%       31.000000
max      512.329200
Name: Fare, dtype: float64
sns.violinplot(y="Fare",data=train)
<matplotlib.axes._subplots.AxesSubplot at 0x2599ec52b0>

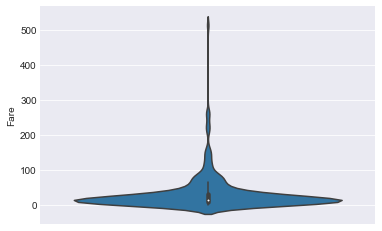
由上面做的图已知Fare分布较散,异常值较多,我们用中位数而不用平均数来填补缺失值。
test.Fare.fillna(train.Fare.median(),inplace=True)
3.1.4 Age
训练集、测试集中都有一定的缺失
train.Age.describe()
count    714.000000
mean      29.699118
std       14.526497
min        0.420000
25%       20.125000
50%       28.000000
75%       38.000000
max       80.000000
Name: Age, dtype: float64
sns.violinplot(y="Age",data=train)
<matplotlib.axes._subplots.AxesSubplot at 0x259a087cc0>

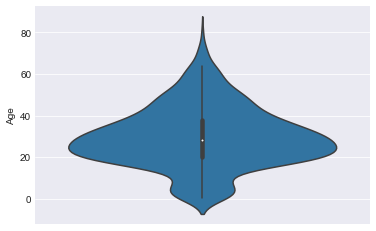
平均值和中位数较接近。我们用平均值跟标准差来填补缺失值。
for data in entire_data:
    Age_avg = data.Age.mean()
    Age_std = data["Age"].std()
    missing_number = data["Age"].isnull().sum()
    data["Age"][np.isnan(data["Age"])] = np.random.randint(Age_avg - Age_std, Age_avg + Age_std, missing_number)
    data["Age"] = data["Age"].astype(int)
F:\Anaconda\lib\site-packages\ipykernel_launcher.py:5: SettingWithCopyWarning:
A value is trying to be set on a copy of a slice from a DataFrame

See the caveats in the documentation: http://pandas.pydata.org/pandas-docs/stable/indexing.html#indexing-view-versus-copy
  """
缺失值处理完毕。
3.2相关性分析
train.head()
| Survived | Pclass | Name | Sex | Age | SibSp | Parch | Ticket | Fare | Embarked | has_cabin | |
|---|---|---|---|---|---|---|---|---|---|---|---|
| 0 | 0 | 3 | Braund, Mr. Owen Harris | male | 22 | 1 | 0 | A/5 21171 | 7.2500 | S | 0 |
| 1 | 1 | 1 | Cumings, Mrs. John Bradley (Florence Briggs Th... | female | 38 | 1 | 0 | PC 17599 | 71.2833 | C | 1 |
| 2 | 1 | 3 | Heikkinen, Miss. Laina | female | 26 | 0 | 0 | STON/O2. 3101282 | 7.9250 | S | 0 |
| 3 | 1 | 1 | Futrelle, Mrs. Jacques Heath (Lily May Peel) | female | 35 | 1 | 0 | 113803 | 53.1000 | S | 1 |
| 4 | 0 | 3 | Allen, Mr. William Henry | male | 35 | 0 | 0 | 373450 | 8.0500 | S | 0 |
船舱分三等,某种程度上代表了乘客的身份、社会地位,下面探究一下Pclass的作用:
train[["Pclass","Survived"]].groupby("Pclass",as_index=False).mean().sort_values(by="Survived",ascending=False)
| Pclass | Survived | |
|---|---|---|
| 0 | 1 | 0.629630 |
| 1 | 2 | 0.472826 |
| 2 | 3 | 0.242363 |
sns.barplot(x="Pclass",y="Survived",data=train)
<matplotlib.axes._subplots.AxesSubplot at 0x259a112550>

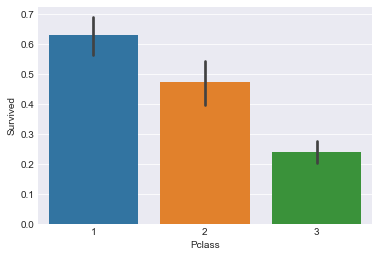
超过60%的一等舱的乘客存活了下来,而仅24%的三等舱乘客存活了下来。由图更直观看出Pclass=1的优势所在。可见,Pclass对生存预测存在影响,故暂时保留该特征。
3.2.2 SibSp、Parch与生存之间的关系
train.head()
| Survived | Pclass | Name | Sex | Age | SibSp | Parch | Ticket | Fare | Embarked | has_cabin | |
|---|---|---|---|---|---|---|---|---|---|---|---|
| 0 | 0 | 3 | Braund, Mr. Owen Harris | male | 22 | 1 | 0 | A/5 21171 | 7.2500 | S | 0 |
| 1 | 1 | 1 | Cumings, Mrs. John Bradley (Florence Briggs Th... | female | 38 | 1 | 0 | PC 17599 | 71.2833 | C | 1 |
| 2 | 1 | 3 | Heikkinen, Miss. Laina | female | 26 | 0 | 0 | STON/O2. 3101282 | 7.9250 | S | 0 |
| 3 | 1 | 1 | Futrelle, Mrs. Jacques Heath (Lily May Peel) | female | 35 | 1 | 0 | 113803 | 53.1000 | S | 1 |
| 4 | 0 | 3 | Allen, Mr. William Henry | male | 35 | 0 | 0 | 373450 | 8.0500 | S | 0 |
train[["SibSp","Survived"]].groupby("SibSp",as_index=False).mean().sort_values(by="Survived",ascending=False)
| SibSp | Survived | |
|---|---|---|
| 1 | 1 | 0.535885 |
| 2 | 2 | 0.464286 |
| 0 | 0 | 0.345395 |
| 3 | 3 | 0.250000 |
| 4 | 4 | 0.166667 |
| 5 | 5 | 0.000000 |
| 6 | 8 | 0.000000 |
SibSp为3、4、5、8人时,生存率都较小,甚至为0,有影响但不明显。
train[["Parch","Survived"]].groupby("Parch",as_index=False).mean().sort_values(by="Survived",ascending=False)
| Parch | Survived | |
|---|---|---|
| 3 | 3 | 0.600000 |
| 1 | 1 | 0.550847 |
| 2 | 2 | 0.500000 |
| 0 | 0 | 0.343658 |
| 5 | 5 | 0.200000 |
| 4 | 4 | 0.000000 |
| 6 | 6 | 0.000000 |
看到Parch为4、5、6的生存率也较小,影响不是很明显。跟上面的SibSp情况类似,现将两变量人数合起来看对生存率的影响如何:
for data in entire_data:
    data["Family"] = data["SibSp"] + data["Parch"] + 1
train[["Family","Survived"]].groupby("Family",as_index=False).mean().sort_values(by="Survived",ascending=False)
| Family | Survived | |
|---|---|---|
| 3 | 4 | 0.724138 |
| 2 | 3 | 0.578431 |
| 1 | 2 | 0.552795 |
| 6 | 7 | 0.333333 |
| 0 | 1 | 0.303538 |
| 4 | 5 | 0.200000 |
| 5 | 6 | 0.136364 |
| 7 | 8 | 0.000000 |
| 8 | 11 | 0.000000 |
sns.countplot(x="Family",hue="Survived",data=train)
<matplotlib.axes._subplots.AxesSubplot at 0x259974a2e8>

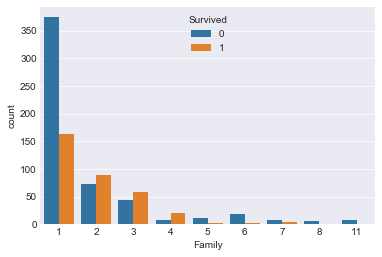
单独一人以及家庭规模>=5人时,死亡率高于生存率。于是,按家庭规模分成小、中、大家庭:
for data in entire_data:
    data["Family_size"] = 0    #创建新的一列
    data.loc[data["Family"] == 1,"Family_size"] = 1                              #小家庭(独自一人)
    data.loc[(data["Family"] > 1) & (data["Family"] <= 4),"Family_size"] = 2  #中家庭(2-4)
    data.loc[data["Family"] > 4,"Family_size"] = 3                                #大家庭(5-11)
    data["Family_size"] = data["Family_size"].astype(int)
同时,我们也可考虑家庭成员的陪伴对生存率是否有影响,来看是否需要构建一个新的特征:
for data in entire_data:
    data["Alone"] = data["Family"].map(lambda x : 1 if x==1 else 0)
train[["Alone","Survived"]].groupby("Alone",as_index=False).mean().sort_values("Survived",ascending=False)
| Alone | Survived | |
|---|---|---|
| 0 | 0 | 0.505650 |
| 1 | 1 | 0.303538 |
sns.barplot(x="Alone",y="Survived",data=train)
<matplotlib.axes._subplots.AxesSubplot at 0x2599825278>

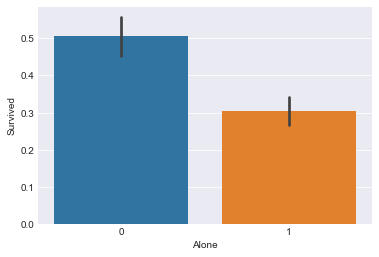
有家庭成员一起在船上,生存率比独自一人在船的生存率高。所以引入该新特征,而将原来的SibSp、Parch、Family都删除掉。
for data in entire_data:
    data.drop(["SibSp","Parch","Family"],axis=1,inplace=True)
我们加入Pclass来考虑此问题:
sns.factorplot(x="Pclass",y="Survived",hue="Alone",data=train)
<seaborn.axisgrid.FacetGrid at 0x259a1c04e0>

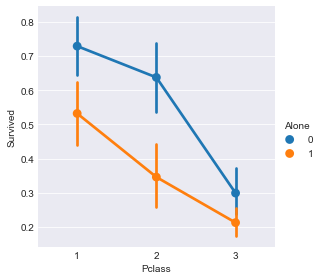
在考虑乘客是否独自一人对生存率影响的同时,乘客所属船舱等级也一直在影响生存率。考虑Pclass是有必要的。
3.2.3 Age与生存之间的关系
sns.violinplot(y="Age",x="Survived",data=train)
<matplotlib.axes._subplots.AxesSubplot at 0x2599ae06d8>

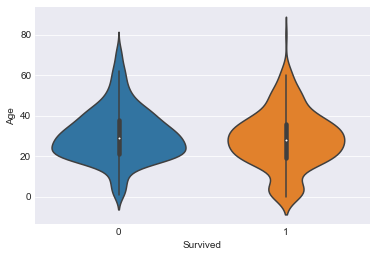
已知年龄分布较散,而且乘客主要是二三十岁的群体,中位数是28,百分之五十的人集中在20-38岁。60岁以上的人比较少。
我们看一下train中的数据,先把年龄等宽划分成5组,看各个年龄组的生存如何:
train["Age_group"] = pd.cut(train.Age,5)
train[["Age_group","Survived"]].groupby("Age_group",as_index=False).mean().sort_values("Survived",ascending=False)
| Age_group | Survived | |
|---|---|---|
| 0 | (-0.08, 16.0] | 0.547170 |
| 3 | (48.0, 64.0] | 0.434783 |
| 2 | (32.0, 48.0] | 0.359375 |
| 1 | (16.0, 32.0] | 0.358575 |
| 4 | (64.0, 80.0] | 0.090909 |
sns.barplot(x="Age_group",y="Survived",data=train)
<matplotlib.axes._subplots.AxesSubplot at 0x259a2a2e48>

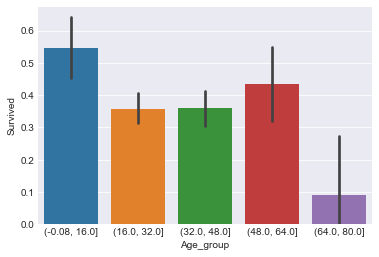
数据分组后,较原先离散的数据看起来更集中,对我们建模效果更有提升作用。可以看到,不同年龄段,生存率不同。0-16岁之间生存率最高,64-80岁的老年人的生存率最低。说明年龄是影响生存的一个重要因素。
del train["Age_group"]
下面将训练集跟测试集的年龄都划分成5组,重新构建特征,删除原有的Age特征来处理数据。
#仍是采用5组:
for data in entire_data:
    data["Age_group"] = pd.cut(data.Age, 5)
#现在我们以新的标识符来记录每人的分组:
for data in entire_data:
    data.loc[data["Age"]  <= 16,"Age"] = 0
    data.loc[(data["Age"] > 16) & (data["Age"] <= 32), "Age"] = 1
    data.loc[(data["Age"] > 32) & (data["Age"] <= 48), "Age"] = 2
    data.loc[(data["Age"] > 48) & (data["Age"] <= 64), "Age"] = 3
    data.loc[data["Age"]  > 64, "Age"] = 4
for data in entire_data:
    data.drop("Age_group",axis=1,inplace=True)
3.2.4 Fare与生存之间的关系
train.Fare.describe()
count    891.000000
mean      32.204208
std       49.693429
min        0.000000
25%        7.910400
50%       14.454200
75%       31.000000
max      512.329200
Name: Fare, dtype: float64
部分票价数据偏大,但数量较少,数据整体分布较分散。最小值是0,最大值约为512。中位数是14.45,平均值是32.20。50%的票价集中在8-31之间。
#对比生死乘客的票价
sns.violinplot(y="Fare",x="Survived",data=train)
<matplotlib.axes._subplots.AxesSubplot at 0x259a2c02b0>


可看到成功生存的乘客票价的中位数是比死亡乘客票价中位数大。票价较低的群体死亡率更高,粗略判断票价对生存有影响作用。
跟年龄一样,做分组处理,下面以具体数字去看不同Fare对生存率的影响:
#找出分段点
train["Fare_group"] = pd.qcut(train["Fare"],4) #分段
train[["Fare_group","Survived"]].groupby("Fare_group",as_index=False).mean()
| Fare_group | Survived | |
|---|---|---|
| 0 | (-0.001, 7.91] | 0.197309 |
| 1 | (7.91, 14.454] | 0.303571 |
| 2 | (14.454, 31.0] | 0.454955 |
| 3 | (31.0, 512.329] | 0.581081 |
随着票价的升高,乘客的生存率也是逐渐升高。所以将Fare作为一个考虑特征。
del train["Fare_group"]
for data in entire_data:
    data.loc[data["Fare"]  <= 7.91, "Fare"]                               = 0
    data.loc[(data["Fare"] >  7.91)   & (data["Fare"] <= 14.454), "Fare"] = 1
    data.loc[(data["Fare"] >  14.454) & (data["Fare"] <= 31.0),   "Fare"] = 2
    data.loc[data["Fare"]  >  31.0, "Fare"]                               = 3
    data["Fare"] = data["Fare"].astype(int)
3.2.5 名字与生存之间的关系
外国人的名字长度、头衔也能反映一个人的身份地位,于是我们来探究一下这两个因素对生存率的影响:
(1)名字长度
for data in entire_data:
    data["The_length_of_name"] = data["Name"].map(lambda x:len(re.split(" ",x)))
train[["The_length_of_name","Survived"]].groupby("The_length_of_name",as_index=False).mean().sort_values("Survived",ascending=False)
| The_length_of_name | Survived | |
|---|---|---|
| 6 | 9 | 1.000000 |
| 7 | 14 | 1.000000 |
| 4 | 7 | 0.842105 |
| 3 | 6 | 0.773585 |
| 5 | 8 | 0.555556 |
| 2 | 5 | 0.427083 |
| 1 | 4 | 0.340206 |
| 0 | 3 | 0.291803 |
sns.barplot(x="The_length_of_name",y="Survived",data=train)
<matplotlib.axes._subplots.AxesSubplot at 0x259a354da0>

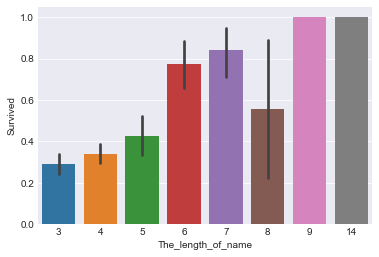
名字长一点的生存率相对名字短的要高一点。考虑此新变量。
train.head(3)
| Survived | Pclass | Name | Sex | Age | Ticket | Fare | Embarked | has_cabin | Family_size | Alone | The_length_of_name | |
|---|---|---|---|---|---|---|---|---|---|---|---|---|
| 0 | 0 | 3 | Braund, Mr. Owen Harris | male | 1 | A/5 21171 | 0 | S | 0 | 2 | 0 | 4 |
| 1 | 1 | 1 | Cumings, Mrs. John Bradley (Florence Briggs Th... | female | 2 | PC 17599 | 3 | C | 1 | 2 | 0 | 7 |
| 2 | 1 | 3 | Heikkinen, Miss. Laina | female | 1 | STON/O2. 3101282 | 1 | S | 0 | 1 | 1 | 3 |
(2)头衔
#查看一下名字的样式
train.Name.head(7)
0                              Braund, Mr. Owen Harris
1    Cumings, Mrs. John Bradley (Florence Briggs Th...
2                               Heikkinen, Miss. Laina
3         Futrelle, Mrs. Jacques Heath (Lily May Peel)
4                             Allen, Mr. William Henry
5                                     Moran, Mr. James
6                              McCarthy, Mr. Timothy J
Name: Name, dtype: object
#将title取出当新的一列
for data in entire_data:
    data["Title"] = data["Name"].str.extract("([A-Za-z]+)\.",expand=False)
train.sample(4)
| Survived | Pclass | Name | Sex | Age | Ticket | Fare | Embarked | has_cabin | Family_size | Alone | The_length_of_name | Title | |
|---|---|---|---|---|---|---|---|---|---|---|---|---|---|
| 557 | 0 | 1 | Robbins, Mr. Victor | male | 1 | PC 17757 | 3 | C | 0 | 1 | 1 | 3 | Mr |
| 670 | 1 | 2 | Brown, Mrs. Thomas William Solomon (Elizabeth ... | female | 2 | 29750 | 3 | S | 0 | 2 | 0 | 8 | Mrs |
| 108 | 0 | 3 | Rekic, Mr. Tido | male | 2 | 349249 | 0 | S | 0 | 1 | 1 | 3 | Mr |
| 652 | 0 | 3 | Kalvik, Mr. Johannes Halvorsen | male | 1 | 8475 | 1 | S | 0 | 1 | 1 | 4 | Mr |
#title跟Sex有联系,联合起来分析
pd.crosstab(train.Title,train.Sex)
| Sex | female | male |
|---|---|---|
| Title | ||
| Capt | 0 | 1 |
| Col | 0 | 2 |
| Countess | 1 | 0 |
| Don | 0 | 1 |
| Dr | 1 | 6 |
| Jonkheer | 0 | 1 |
| Lady | 1 | 0 |
| Major | 0 | 2 |
| Master | 0 | 40 |
| Miss | 182 | 0 |
| Mlle | 2 | 0 |
| Mme | 1 | 0 |
| Mr | 0 | 517 |
| Mrs | 125 | 0 |
| Ms | 1 | 0 |
| Rev | 0 | 6 |
| Sir | 0 | 1 |
#Title较多集中于Master、Miss、Mr、Mrs,对于其他比较少的进行归类:
for data in entire_data:
    data['Title'] = data['Title'].replace(['Lady', 'Countess','Capt', 'Col','Don', 'Dr', 'Major', 'Rev', 'Sir', 'Jonkheer', 'Dona'], 'Rare')
    data['Title'] = data['Title'].replace('Mlle', 'Miss')
    data['Title'] = data['Title'].replace('Ms', 'Miss')
    data['Title'] = data['Title'].replace('Mme', 'Mrs')
#探索title与生存的关系
train[["Title","Survived"]].groupby("Title",as_index=False).mean().sort_values("Survived",ascending=False)
| Title | Survived | |
|---|---|---|
| 3 | Mrs | 0.793651 |
| 1 | Miss | 0.702703 |
| 0 | Master | 0.575000 |
| 4 | Rare | 0.347826 |
| 2 | Mr | 0.156673 |
sns.barplot(x="Title",y="Survived",data=train)
<matplotlib.axes._subplots.AxesSubplot at 0x259a341940>

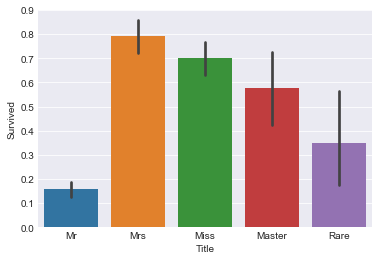
带女性title的乘客的生存率均超过70%,而title为Mr的男性乘客,生存率不到16%。可看出在当时灾难面前,女士的优势是较大的。考虑此新特征。
#将各头衔转换为数值型数据
for data in entire_data:
    data["Title"] = data["Title"].map({"Mr":1,"Mrs":2,"Miss":3,"Master":4,"Rare":5})
    data["Title"] = data["Title"].fillna(0)
#删除原先的Name特征
for data in entire_data:
    del data["Name"]
#查看一下现在的数据
train.head(3)
| Survived | Pclass | Sex | Age | Ticket | Fare | Embarked | has_cabin | Family_size | Alone | The_length_of_name | Title | |
|---|---|---|---|---|---|---|---|---|---|---|---|---|
| 0 | 0 | 3 | male | 1 | A/5 21171 | 0 | S | 0 | 2 | 0 | 4 | 1 |
| 1 | 1 | 1 | female | 2 | PC 17599 | 3 | C | 1 | 2 | 0 | 7 | 2 |
| 2 | 1 | 3 | female | 1 | STON/O2. 3101282 | 1 | S | 0 | 1 | 1 | 3 | 3 |
3.2.6 Sex与生存率之间的关系
在分析title时,我们已知道性别对生存的影响存在,下面我们专门就Sex来研究一下:
train[["Sex","Survived"]].groupby("Sex",as_index=False).mean().sort_values("Survived",ascending=False)
| Sex | Survived | |
|---|---|---|
| 0 | female | 0.742038 |
| 1 | male | 0.188908 |
sns.countplot(x="Sex",hue="Survived",data=train)
<matplotlib.axes._subplots.AxesSubplot at 0x259a3fc908>

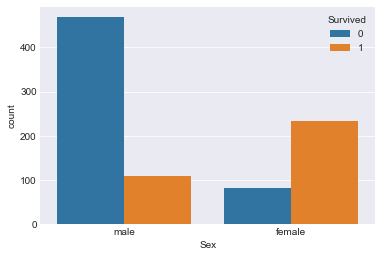
明显看到,女性的生存率远高于男性。加入性别因素。
现加入Pclass,探究各船舱女性的生存率:
train[["Pclass","Sex","Survived"]].groupby(["Pclass","Sex"],as_index=False).mean().sort_values(by="Survived",ascending=False)
| Pclass | Sex | Survived | |
|---|---|---|---|
| 0 | 1 | female | 0.968085 |
| 2 | 2 | female | 0.921053 |
| 4 | 3 | female | 0.500000 |
| 1 | 1 | male | 0.368852 |
| 3 | 2 | male | 0.157407 |
| 5 | 3 | male | 0.135447 |
sns.factorplot(x="Pclass",y="Survived",hue="Sex",data=train)
<seaborn.axisgrid.FacetGrid at 0x259b5bab00>

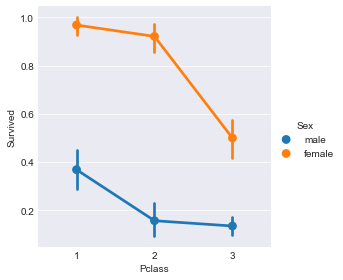
从图表直观得出,不论船舱级别,女性的生存率始终高于男性。而且随着Pclass等级越高,人的生存率越高。一等舱的女性生存率超过96%,二等舱生存率为92%,三等舱生存率50%,高出一等舱男性的生存率(37%)。也反映出考虑特征Pclass的必要性。
#将字符串类型转换成数值型,0表示男性,1表示女性。
for data in entire_data:
    data["Sex"] = data["Sex"].map({"male":0,"female":1})
train.head(4)
| Survived | Pclass | Sex | Age | Ticket | Fare | Embarked | has_cabin | Family_size | Alone | The_length_of_name | Title | |
|---|---|---|---|---|---|---|---|---|---|---|---|---|
| 0 | 0 | 3 | 0 | 1 | A/5 21171 | 0 | S | 0 | 2 | 0 | 4 | 1 |
| 1 | 1 | 1 | 1 | 2 | PC 17599 | 3 | C | 1 | 2 | 0 | 7 | 2 |
| 2 | 1 | 3 | 1 | 1 | STON/O2. 3101282 | 1 | S | 0 | 1 | 1 | 3 | 3 |
| 3 | 1 | 1 | 1 | 2 | 113803 | 3 | S | 1 | 2 | 0 | 7 | 2 |
3.2.7 Embarked与生存率之间的关系
train[["Embarked","Survived"]].groupby("Embarked",as_index=False).count().sort_values("Survived",ascending=False)
| Embarked | Survived | |
|---|---|---|
| 2 | S | 646 |
| 0 | C | 168 |
| 1 | Q | 77 |
train[["Embarked","Survived"]].groupby("Embarked",as_index=False).mean().sort_values("Survived",ascending=False)
| Embarked | Survived | |
|---|---|---|
| 0 | C | 0.553571 |
| 1 | Q | 0.389610 |
| 2 | S | 0.339009 |
sns.barplot(x="Embarked",y="Survived",data=train)
<matplotlib.axes._subplots.AxesSubplot at 0x259b6499b0>

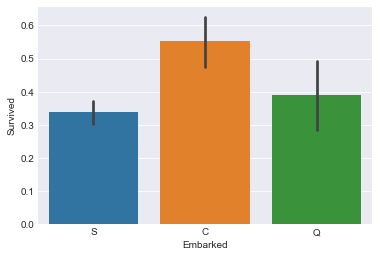
各口岸上船人数:S > C > Q。各口岸乘客生存率:C > Q > S,不同上岸地点对生存有影响,将Embarked作为建模特征。
下面探究一下加入Pclass因素的影响:
sns.factorplot(x="Pclass",y="Survived",hue="Embarked",data=train)
<seaborn.axisgrid.FacetGrid at 0x259b50b5c0>

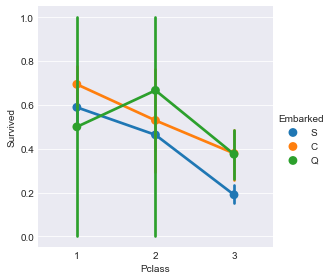
发现在Q口岸上船的乘客,船舱等级为2的乘客生存率 > 船舱等级为1的乘客生存率。与我们料想的不一致。而且在二等舱乘客中,Q口岸上船的生存率最高。
猜想是否是性别在其中影响:
train[["Sex","Survived","Embarked"]].groupby(["Sex","Embarked"],as_index=False).count().sort_values("Survived",ascending=False)
| Sex | Embarked | Survived | |
|---|---|---|---|
| 2 | 0 | S | 441 |
| 5 | 1 | S | 205 |
| 0 | 0 | C | 95 |
| 3 | 1 | C | 73 |
| 1 | 0 | Q | 41 |
| 4 | 1 | Q | 36 |
S口岸,登船人数644,女性乘客占比46%;C口岸,登船人数168,女性占比接近77%;Q口岸,登船人数77,女性占比接近88%。前面已知女性生存率明显高于男性生存率,所以上述问题可能由性别因素引起。
#将Embarked转换成数值型数据:
for data in entire_data:
    data["Embarked"] = data["Embarked"].map({"C":0,"Q":1,"S":2}).astype(int)
train.head(2)
| Survived | Pclass | Sex | Age | Ticket | Fare | Embarked | has_cabin | Family_size | Alone | The_length_of_name | Title | |
|---|---|---|---|---|---|---|---|---|---|---|---|---|
| 0 | 0 | 3 | 0 | 1 | A/5 21171 | 0 | 2 | 0 | 2 | 0 | 4 | 1 |
| 1 | 1 | 1 | 1 | 2 | PC 17599 | 3 | 0 | 1 | 2 | 0 | 7 | 2 |
3.2.8 Ticket与生存率之间的关系
train.Ticket.sample(10)
748     113773
330     367226
823     392096
812      28206
388     367655
638    3101295
878     349217
696     363592
105     349207
289     370373
Name: Ticket, dtype: object
该列无缺失值,但信息较为混乱,有681个不重复值,删掉不做考虑。
for data in entire_data:
    del data["Ticket"]
五.特征工程
数据处理完毕,现在看一下我们的特征:
train.tail(4)
| Survived | Pclass | Sex | Age | Fare | Embarked | has_cabin | Family_size | Alone | The_length_of_name | Title | |
|---|---|---|---|---|---|---|---|---|---|---|---|
| 887 | 1 | 1 | 1 | 1 | 2 | 2 | 1 | 1 | 1 | 4 | 3 |
| 888 | 0 | 3 | 1 | 2 | 2 | 2 | 0 | 2 | 0 | 5 | 3 |
| 889 | 1 | 1 | 0 | 1 | 2 | 0 | 1 | 1 | 1 | 4 | 1 |
| 890 | 0 | 3 | 0 | 1 | 0 | 1 | 0 | 1 | 1 | 3 | 1 |
test.head(4)
| Pclass | Sex | Age | Fare | Embarked | has_cabin | Family_size | Alone | The_length_of_name | Title | |
|---|---|---|---|---|---|---|---|---|---|---|
| 0 | 3 | 0 | 2 | 0 | 1 | 0 | 1 | 1 | 3 | 1 |
| 1 | 3 | 1 | 2 | 0 | 2 | 0 | 2 | 0 | 5 | 2 |
| 2 | 2 | 0 | 3 | 1 | 1 | 0 | 1 | 1 | 4 | 1 |
| 3 | 3 | 0 | 1 | 1 | 2 | 0 | 1 | 1 | 3 | 1 |
下面通过计算各个特征与标签的相关系数,来选择特征。
corr_df = train.corr()
corr_df
| Survived | Pclass | Sex | Age | Fare | Embarked | has_cabin | Family_size | Alone | The_length_of_name | Title | |
|---|---|---|---|---|---|---|---|---|---|---|---|
| Survived | 1.000000 | -0.338481 | 0.543351 | -0.072439 | 0.295875 | -0.167675 | 0.316912 | 0.108631 | -0.203367 | 0.278520 | 0.405921 |
| Pclass | -0.338481 | 1.000000 | -0.131900 | -0.300889 | -0.628459 | 0.162098 | -0.725541 | -0.043973 | 0.135207 | -0.222866 | -0.120491 |
| Sex | 0.543351 | -0.131900 | 1.000000 | -0.087563 | 0.248940 | -0.108262 | 0.140391 | 0.280570 | -0.303646 | 0.375797 | 0.564438 |
| Age | -0.072439 | -0.300889 | -0.087563 | 1.000000 | 0.050365 | -0.020742 | 0.219128 | -0.198207 | 0.149782 | 0.063940 | -0.198703 |
| Fare | 0.295875 | -0.628459 | 0.248940 | 0.050365 | 1.000000 | -0.112248 | 0.497108 | 0.559259 | -0.568942 | 0.320767 | 0.265495 |
| Embarked | -0.167675 | 0.162098 | -0.108262 | -0.020742 | -0.112248 | 1.000000 | -0.160196 | -0.004951 | 0.063532 | 0.032424 | -0.082845 |
| has_cabin | 0.316912 | -0.725541 | 0.140391 | 0.219128 | 0.497108 | -0.160196 | 1.000000 | 0.088993 | -0.158029 | 0.184484 | 0.104024 |
| Family_size | 0.108631 | -0.043973 | 0.280570 | -0.198207 | 0.559259 | -0.004951 | 0.088993 | 1.000000 | -0.923090 | 0.311132 | 0.328943 |
| Alone | -0.203367 | 0.135207 | -0.303646 | 0.149782 | -0.568942 | 0.063532 | -0.158029 | -0.923090 | 1.000000 | -0.369259 | -0.289292 |
| The_length_of_name | 0.278520 | -0.222866 | 0.375797 | 0.063940 | 0.320767 | 0.032424 | 0.184484 | 0.311132 | -0.369259 | 1.000000 | 0.124584 |
| Title | 0.405921 | -0.120491 | 0.564438 | -0.198703 | 0.265495 | -0.082845 | 0.104024 | 0.328943 | -0.289292 | 0.124584 | 1.000000 |
#查看各特征与Survived的线性相关系数
corr_df["Survived"].sort_values(ascending=False)
Survived              1.000000
Sex                   0.543351
Title                 0.405921
has_cabin             0.316912
Fare                  0.295875
The_length_of_name    0.278520
Family_size           0.108631
Age                  -0.072439
Embarked             -0.167675
Alone                -0.203367
Pclass               -0.338481
Name: Survived, dtype: float64
正线性相关前三为:Sex、Title、has_cabin;负线性相关前三:Pclass、Alone、Embarked。
#用热力图直观查看线性相关系数
plt.figure(figsize=(13,13))
plt.title("Pearson Correlation of Features")
sns.heatmap(corr_df,linewidths=0.1,square=True,linecolor="white",annot=True,cmap='YlGnBu',vmin=-1,vmax=1)
<matplotlib.axes._subplots.AxesSubplot at 0x259b78a8d0>

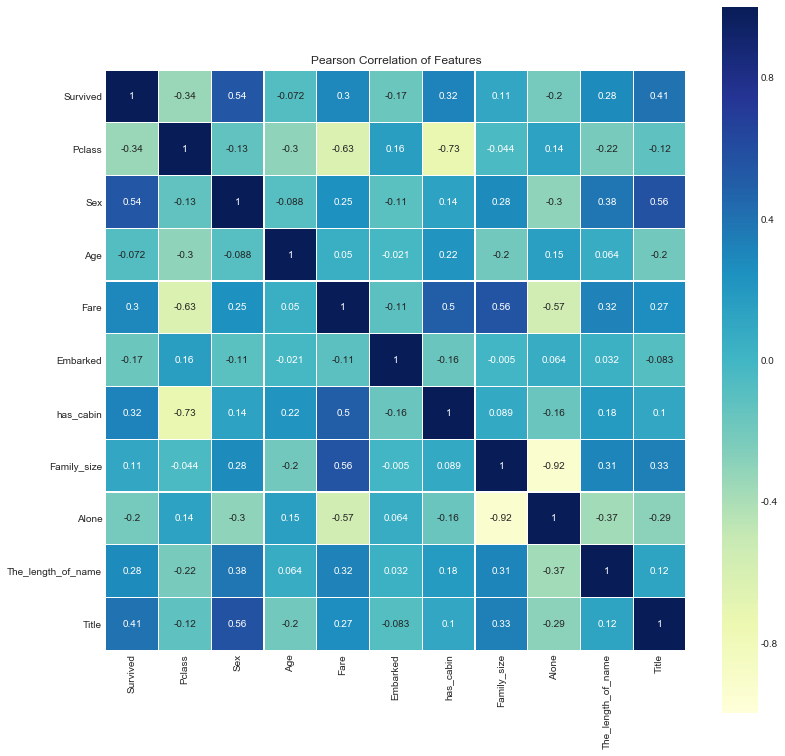
看到特征Family_size跟Alone存在很强的线性相关性,但是先保留,后面建模再调优。
四.模型构建与评估
#划分训练集、训练集数据
#一般情况下,会用train_test_split来按比例划分数据集,但是Kaggle已经划分好,我们只需做预测并提交答案即可
x_train = train.drop("Survived",axis=1)
y_train = train["Survived"]
x_test = test
5.1 Logistic回归
from sklearn.linear_model import LogisticRegression as LR
LR1 = LR()
LR1.fit(x_train,y_train)
LR1_pred = LR1.predict(x_test)
LR1_score = LR1.score(x_train,y_train)
LR1_score
0.81593714927048255
根据稳定性选择特征再用LR
from sklearn.linear_model import RandomizedLogisticRegression as RLR
RLR= RLR()
RLR.fit(x_train, y_train)
RLR.get_support()
print("有效特征为:%s" % ','.join(x_train.columns[RLR.get_support()]) )
x1_train = x_train[x_train.columns[RLR.get_support()]].as_matrix()
x1_test = x_test[x_train.columns[RLR.get_support()]].as_matrix()
from sklearn.linear_model import LogisticRegression as LR
LR2 = LR()
LR2.fit(x1_train,y_train)
LR2_pred = LR2.predict(x1_test)
LR2_score = LR2.score(x1_train,y_train)
LR2_score
F:\Anaconda\lib\site-packages\sklearn\utils\deprecation.py:57: DeprecationWarning: Class RandomizedLogisticRegression is deprecated; The class RandomizedLogisticRegression is deprecated in 0.19 and will be removed in 0.21.
  warnings.warn(msg, category=DeprecationWarning)


有效特征为:Pclass,Sex,Embarked,has_cabin,The_length_of_name,Title


0.78002244668911336
LR1_output = pd.DataFrame({"PassengerId" : ID,
                           "Survived"   : LR1_pred})
LR1_output.head(10)
LR2_output = pd.DataFrame({"PassengerId" : ID,
                           "Survived"   : LR2_pred})
LR1_output.to_csv(r"G:\Kaggle\Titanic\LR1_output.csv",index=False)
LR2_output.to_csv(r"G:\Kaggle\Titanic\LR1_output.csv",index=False)
5.2 KNN
from sklearn.neighbors import KNeighborsClassifier
KNN1 = KNeighborsClassifier()
KNN1.fit(x_train,y_train)
KNN1_pred = KNN1.predict(x_test)
#模型评估
KNN1_score = KNN1.score(x_train,y_train)
KNN1_score
0.84175084175084181
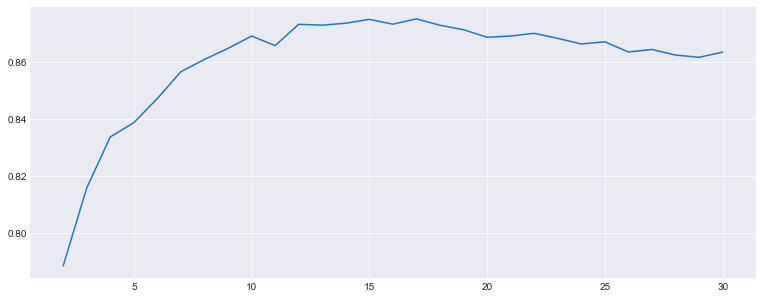
下面用交叉验证的方法来选择最优的k值,一般k值小于样本量的平方根,所以取k在2-30之间
from sklearn.model_selection import cross_val_score
k = range(2, 31)
k_scores = []
for i in k:
    knn = KNeighborsClassifier(i)
    scores = cross_val_score(knn, x_train, y_train, cv=10, scoring='roc_auc')
    k_scores.append(scores.mean())
plt.figure(figsize=(13,5))
plt.plot(k, k_scores)
print("最优k值:", k_scores.index(max(k_scores))+1)
print("最高得分:", max(k_scores))
最优k值: 16
最高得分: 0.875218982543

from sklearn.neighbors import KNeighborsClassifier
KNN2 = KNeighborsClassifier(n_neighbors=16)
KNN2.fit(x_train,y_train)
KNN2_pred = KNN2.predict(x_test)
KNN2_score = KNN2.score(x_train,y_train)
KNN2_score
0.83726150392817056
KNN1_output = pd.DataFrame({"PassengerId": ID,
                            "Survived"  : KNN1_pred})
KNN1_output.to_csv(r"G:\Kaggle\Titanic\KNN1_output.csv",index=False)

KNN2_output = pd.DataFrame({"PassengerId": ID,
                           "Survived"    : KNN2_pred})
KNN2_output.to_csv(r"G:\Kaggle\Titanic\KNN2_output.csv",index=False)
5.3 决策树
from sklearn.tree import DecisionTreeClassifier
DTC = DecisionTreeClassifier()
DTC.fit(x_train,y_train)
DTC_pred = DTC.predict(x_test)
DTC_score = DTC.score(x_train,y_train)
DTC_score
0.91245791245791241
DTC_output = pd.DataFrame({"PassengerId":ID,
                           "Survived":DTC_pred})
DTC_output.to_csv(r"G:\Kaggle\Titanic\DTC_output.csv",index=False)
5.4 随机森林
5.4.1不修改任何参数
from sklearn.ensemble import RandomForestClassifier
from sklearn import cross_validation,metrics
RF1 = RandomForestClassifier(random_state=666)
RF1.fit(x_train,y_train)
RF1_pred = RF1.predict(x_test)
RF1_score = RF1.score(x_train,y_train)
RF1_score
0.90796857463524128
RF1_output = pd.DataFrame({"PassengerId":ID,
                          "Survived":RF1_pred})
RF1_output.to_csv(r"G:\Kaggle\Titanic\RF1_output.csv",index=False)
5.4.2 考虑袋外数据
5.4.2.1 用oob_score考虑模型好坏,其他参数不修改,无预剪枝
RF2 = RandomForestClassifier(oob_score=True,random_state=100)
RF2.fit(x_train,y_train)
RF2_pred = RF2.predict(x_test)
RF2_score = RF2.score(x_train,y_train)
RF2_score
print(RF2.oob_score_)
0.79797979798


F:\Anaconda\lib\site-packages\sklearn\ensemble\forest.py:451: UserWarning: Some inputs do not have OOB scores. This probably means too few trees were used to compute any reliable oob estimates.
  warn("Some inputs do not have OOB scores. "
F:\Anaconda\lib\site-packages\sklearn\ensemble\forest.py:456: RuntimeWarning: invalid value encountered in true_divide
  predictions[k].sum(axis=1)[:, np.newaxis])
RF2_output = pd.DataFrame({"PassengerId":ID,
                          "Survived":RF2_pred})
RF2_output.to_csv(r"G:\Kaggle\Titanic\RF2_output.csv",index=False)
5.4.2.2 用网格搜查找出最佳参数
(1)寻找最优的弱学习器个数 n_estimatoras
from sklearn.grid_search import GridSearchCV
param_test1 = {"n_estimators" : list(range(10,500,10))}
gsearch1 = GridSearchCV(estimator = RandomForestClassifier(min_samples_split=200,
                                    min_samples_leaf=20,max_depth=8,random_state=100),
                        param_grid = param_test1, scoring="roc_auc",cv=5)
gsearch1.fit(x_train,y_train)
gsearch1.grid_scores_, gsearch1.best_params_, gsearch1.best_score_
([mean: 0.84599, std: 0.01003, params: {'n_estimators': 10},
  mean: 0.85054, std: 0.01363, params: {'n_estimators': 20},
  mean: 0.84815, std: 0.01363, params: {'n_estimators': 30},
  mean: 0.84699, std: 0.01253, params: {'n_estimators': 40},
  mean: 0.84824, std: 0.01017, params: {'n_estimators': 50},
  mean: 0.84881, std: 0.01161, params: {'n_estimators': 60},
  mean: 0.84939, std: 0.01103, params: {'n_estimators': 70},
  mean: 0.84906, std: 0.01034, params: {'n_estimators': 80},
  mean: 0.84872, std: 0.01156, params: {'n_estimators': 90},
  mean: 0.85005, std: 0.01148, params: {'n_estimators': 100},
  mean: 0.84974, std: 0.01238, params: {'n_estimators': 110},
  mean: 0.85134, std: 0.01287, params: {'n_estimators': 120},
  mean: 0.85098, std: 0.01245, params: {'n_estimators': 130},
  mean: 0.85115, std: 0.01210, params: {'n_estimators': 140},
  mean: 0.84987, std: 0.01227, params: {'n_estimators': 150},
  mean: 0.85048, std: 0.01196, params: {'n_estimators': 160},
  mean: 0.85160, std: 0.01224, params: {'n_estimators': 170},
  mean: 0.85141, std: 0.01281, params: {'n_estimators': 180},
  mean: 0.85193, std: 0.01275, params: {'n_estimators': 190},
  mean: 0.85195, std: 0.01255, params: {'n_estimators': 200},
  mean: 0.85147, std: 0.01263, params: {'n_estimators': 210},
  mean: 0.85134, std: 0.01211, params: {'n_estimators': 220},
  mean: 0.85102, std: 0.01280, params: {'n_estimators': 230},
  mean: 0.85155, std: 0.01287, params: {'n_estimators': 240},
  mean: 0.85165, std: 0.01280, params: {'n_estimators': 250},
  mean: 0.85133, std: 0.01325, params: {'n_estimators': 260},
  mean: 0.85184, std: 0.01334, params: {'n_estimators': 270},
  mean: 0.85176, std: 0.01379, params: {'n_estimators': 280},
  mean: 0.85170, std: 0.01349, params: {'n_estimators': 290},
  mean: 0.85194, std: 0.01351, params: {'n_estimators': 300},
  mean: 0.85186, std: 0.01311, params: {'n_estimators': 310},
  mean: 0.85245, std: 0.01317, params: {'n_estimators': 320},
  mean: 0.85221, std: 0.01262, params: {'n_estimators': 330},
  mean: 0.85229, std: 0.01270, params: {'n_estimators': 340},
  mean: 0.85277, std: 0.01305, params: {'n_estimators': 350},
  mean: 0.85320, std: 0.01315, params: {'n_estimators': 360},
  mean: 0.85386, std: 0.01288, params: {'n_estimators': 370},
  mean: 0.85378, std: 0.01298, params: {'n_estimators': 380},
  mean: 0.85355, std: 0.01297, params: {'n_estimators': 390},
  mean: 0.85348, std: 0.01341, params: {'n_estimators': 400},
  mean: 0.85364, std: 0.01343, params: {'n_estimators': 410},
  mean: 0.85382, std: 0.01322, params: {'n_estimators': 420},
  mean: 0.85369, std: 0.01334, params: {'n_estimators': 430},
  mean: 0.85366, std: 0.01345, params: {'n_estimators': 440},
  mean: 0.85345, std: 0.01345, params: {'n_estimators': 450},
  mean: 0.85350, std: 0.01338, params: {'n_estimators': 460},
  mean: 0.85349, std: 0.01315, params: {'n_estimators': 470},
  mean: 0.85325, std: 0.01337, params: {'n_estimators': 480},
  mean: 0.85352, std: 0.01332, params: {'n_estimators': 490}],
 {'n_estimators': 370},
 0.8538605541747014)
最优弱学习器个数为370,其得到模型的最佳平均得分为0.85。
param_test2 = {"max_depth":list(range(3,14,2)), "min_samples_split":list(range(50,201,20))}
gsearch2 = GridSearchCV(estimator = RandomForestClassifier(n_estimators=370,
                                    min_samples_leaf=20 ,oob_score=True, random_state=100),
                        param_grid = param_test2, scoring="roc_auc",iid=False, cv=5)
gsearch2.fit(x_train,y_train)
gsearch2.grid_scores_, gsearch2.best_params_, gsearch2.best_score_
([mean: 0.86692, std: 0.01674, params: {'max_depth': 3, 'min_samples_split': 50},
  mean: 0.86594, std: 0.01714, params: {'max_depth': 3, 'min_samples_split': 70},
  mean: 0.86525, std: 0.01644, params: {'max_depth': 3, 'min_samples_split': 90},
  mean: 0.86364, std: 0.01567, params: {'max_depth': 3, 'min_samples_split': 110},
  mean: 0.86198, std: 0.01428, params: {'max_depth': 3, 'min_samples_split': 130},
  mean: 0.86038, std: 0.01452, params: {'max_depth': 3, 'min_samples_split': 150},
  mean: 0.85942, std: 0.01342, params: {'max_depth': 3, 'min_samples_split': 170},
  mean: 0.85521, std: 0.01250, params: {'max_depth': 3, 'min_samples_split': 190},
  mean: 0.87059, std: 0.02054, params: {'max_depth': 5, 'min_samples_split': 50},
  mean: 0.86721, std: 0.01936, params: {'max_depth': 5, 'min_samples_split': 70},
  mean: 0.86455, std: 0.01897, params: {'max_depth': 5, 'min_samples_split': 90},
  mean: 0.86301, std: 0.01720, params: {'max_depth': 5, 'min_samples_split': 110},
  mean: 0.86215, std: 0.01560, params: {'max_depth': 5, 'min_samples_split': 130},
  mean: 0.86091, std: 0.01474, params: {'max_depth': 5, 'min_samples_split': 150},
  mean: 0.85990, std: 0.01474, params: {'max_depth': 5, 'min_samples_split': 170},
  mean: 0.85568, std: 0.01359, params: {'max_depth': 5, 'min_samples_split': 190},
  mean: 0.87140, std: 0.02205, params: {'max_depth': 7, 'min_samples_split': 50},
  mean: 0.86815, std: 0.02013, params: {'max_depth': 7, 'min_samples_split': 70},
  mean: 0.86486, std: 0.01871, params: {'max_depth': 7, 'min_samples_split': 90},
  mean: 0.86280, std: 0.01727, params: {'max_depth': 7, 'min_samples_split': 110},
  mean: 0.86236, std: 0.01578, params: {'max_depth': 7, 'min_samples_split': 130},
  mean: 0.86086, std: 0.01502, params: {'max_depth': 7, 'min_samples_split': 150},
  mean: 0.85990, std: 0.01469, params: {'max_depth': 7, 'min_samples_split': 170},
  mean: 0.85568, std: 0.01359, params: {'max_depth': 7, 'min_samples_split': 190},
  mean: 0.87119, std: 0.02267, params: {'max_depth': 9, 'min_samples_split': 50},
  mean: 0.86815, std: 0.02033, params: {'max_depth': 9, 'min_samples_split': 70},
  mean: 0.86489, std: 0.01870, params: {'max_depth': 9, 'min_samples_split': 90},
  mean: 0.86272, std: 0.01732, params: {'max_depth': 9, 'min_samples_split': 110},
  mean: 0.86236, std: 0.01578, params: {'max_depth': 9, 'min_samples_split': 130},
  mean: 0.86086, std: 0.01502, params: {'max_depth': 9, 'min_samples_split': 150},
  mean: 0.85990, std: 0.01469, params: {'max_depth': 9, 'min_samples_split': 170},
  mean: 0.85568, std: 0.01359, params: {'max_depth': 9, 'min_samples_split': 190},
  mean: 0.87119, std: 0.02267, params: {'max_depth': 11, 'min_samples_split': 50},
  mean: 0.86815, std: 0.02033, params: {'max_depth': 11, 'min_samples_split': 70},
  mean: 0.86489, std: 0.01870, params: {'max_depth': 11, 'min_samples_split': 90},
  mean: 0.86272, std: 0.01732, params: {'max_depth': 11, 'min_samples_split': 110},
  mean: 0.86236, std: 0.01578, params: {'max_depth': 11, 'min_samples_split': 130},
  mean: 0.86086, std: 0.01502, params: {'max_depth': 11, 'min_samples_split': 150},
  mean: 0.85990, std: 0.01469, params: {'max_depth': 11, 'min_samples_split': 170},
  mean: 0.85568, std: 0.01359, params: {'max_depth': 11, 'min_samples_split': 190},
  mean: 0.87119, std: 0.02267, params: {'max_depth': 13, 'min_samples_split': 50},
  mean: 0.86815, std: 0.02033, params: {'max_depth': 13, 'min_samples_split': 70},
  mean: 0.86489, std: 0.01870, params: {'max_depth': 13, 'min_samples_split': 90},
  mean: 0.86272, std: 0.01732, params: {'max_depth': 13, 'min_samples_split': 110},
  mean: 0.86236, std: 0.01578, params: {'max_depth': 13, 'min_samples_split': 130},
  mean: 0.86086, std: 0.01502, params: {'max_depth': 13, 'min_samples_split': 150},
  mean: 0.85990, std: 0.01469, params: {'max_depth': 13, 'min_samples_split': 170},
  mean: 0.85568, std: 0.01359, params: {'max_depth': 13, 'min_samples_split': 190}],
 {'max_depth': 7, 'min_samples_split': 50},
 0.8714038606340748)
得到最优的树的深度为7,最小样本划分数量为50。模型的得分由0.85变为0.87,有所提升。接下来重新设置这三个参数:
RF3 = RandomForestClassifier(n_estimators=370, max_depth=7, min_samples_split=50,
                             min_samples_leaf=20,random_state=100)
RF3.fit(x_train,y_train)
RF3_pred = RF3.predict(x_test)
print(RF3.score(x_train,y_train))
RF3_output = pd.DataFrame({"PassengerId":ID,
                          "Survived":RF3_pred})
RF3_output.to_csv(r"G:\Kaggle\Titanic\RF3_output.csv",index=False)
0.829405162738
六.总结
- Logistic得分0.82,KNN得分0.84(k=5),决策树得分0.91,随机森林无调参也是0.91,调参后0.83。
- 采用决策树建模时,得分最高,但要注意过拟合,可能在测试集中表现达不到此效果。
- 随机森林通过网格搜查不断调优,找出最佳参数,给数剪枝。最后得分0.82,不及决策树高,但是集成学习减小了过拟合的风险,有助于提高树的泛化能力。


