windowserver 安装prometheus+grafana
一、安装准备
1.下载prometheus和grafana,以及监控插件
prometheus官网地址:https://prometheus.io/download/
grafana官网地址:https://grafana.com/grafana/download
prometheus github地址: https://github.com/prometheus
windows系统监控exporter
windows_exporter 地址:https://github.com/prometheus-community/windows_exporter/tags
linux系统监控exporter
node_exporter 地址:https://github.com/prometheus/node_exporter/releases
mysql系统监控exporter
mysql_exporter 地址:https://github.com/prometheus/mysqld_exporter/releases/tag/v0.12.1
二、配置运行
1.配置运行prometheus
1.1打开prometheus.yml文件,把所需要监控的服务器或者数据库写入配置文件中

scrape_configs:
  # The job name is added as a label `job=<job_name>` to any timeseries scraped from this config.
  - job_name: 'windows'

    # metrics_path defaults to '/metrics'
    # scheme defaults to 'http'.
    static_configs:
    - targets: ['localhost:9182']

  - job_name: 'mysql'
    static_configs:
    - targets: ['localhost:3306']
1.2启动windows_exporter和mysql_exporter
1.3点击prometheus.exe运行promethus

默认访问地址为http://localhost:9090 出现如下界面即为prometheus安装成功、数据采集器验证成功 (PS: up为成功,down 为不成功。)

1.4访问http://127.0.0.1:9182/metrics就可以看到监控的数据信息,这样的数据显然很难进行数据分析,所以我们需要安装grafana进行进行图表化

2.grafana配置启动
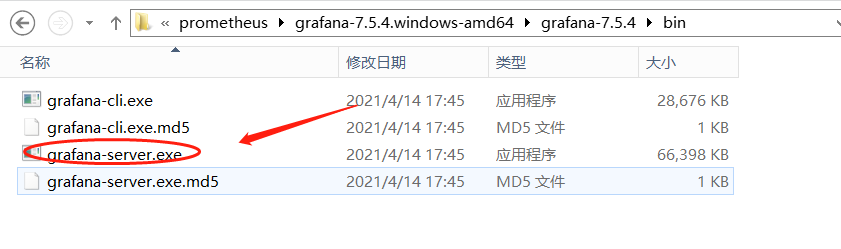
2.1点击grafana-server.exe运行grafana,默认访问地址为http://localhost:3000
2.2在grnfana添加数据源和Dashboards模


如果需要换其他的dashboards,可以去这个网站查找
dashboards网址:https://grafana.com/grafana/dashboards

