Python中matplotlib模块的简单使用
测试代码如下:
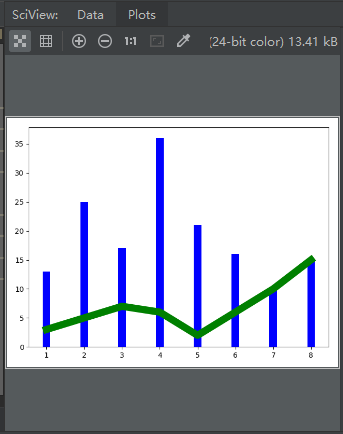
 1 # encoding:utf-8
 2 import numpy as np
 3 import matplotlib.pyplot as plt
 4 x = np.array([1,2,3,4,5,6,7,8])
 5 y = np.array([3,5,7,6,2,6,10,15])
 6 plt.plot(x,y,'r')# 折线 1 x 2 y 3 color
 7 plt.plot(x,y,'g',lw=10)# 4 line w
 8 # 折线 饼状 柱状
 9 x = np.array([1,2,3,4,5,6,7,8])
10 y = np.array([13,25,17,36,21,16,10,15])
11 plt.bar(x,y,0.2,alpha=1,color='b')# 5 color 4 透明度 3 0.9
12 plt.show()
运行结果如下: