Graphviz的使用指南
Graphviz的使用
一、简述
Graphviz 是一款由 AT&T Research 和 Lucent Bell 实验室开源的可视化图形工具,可以很方便的用来绘制结构化的图形网络,支持多种格式输出。Graphviz 输入是一个用 dot 语言编写的绘图脚本,通过对输入脚本的解析,分析出其中的点、边及子图,然后根据属性进行绘制。Graphviz layout 以简单的文本语言描述图形,并以实用的格式制作图表,如用于网页的 images 和 SVG ;用于放入在其它文件中或显示在交互式图形浏览器中的 PDF 和 Postscript 。
二、安装
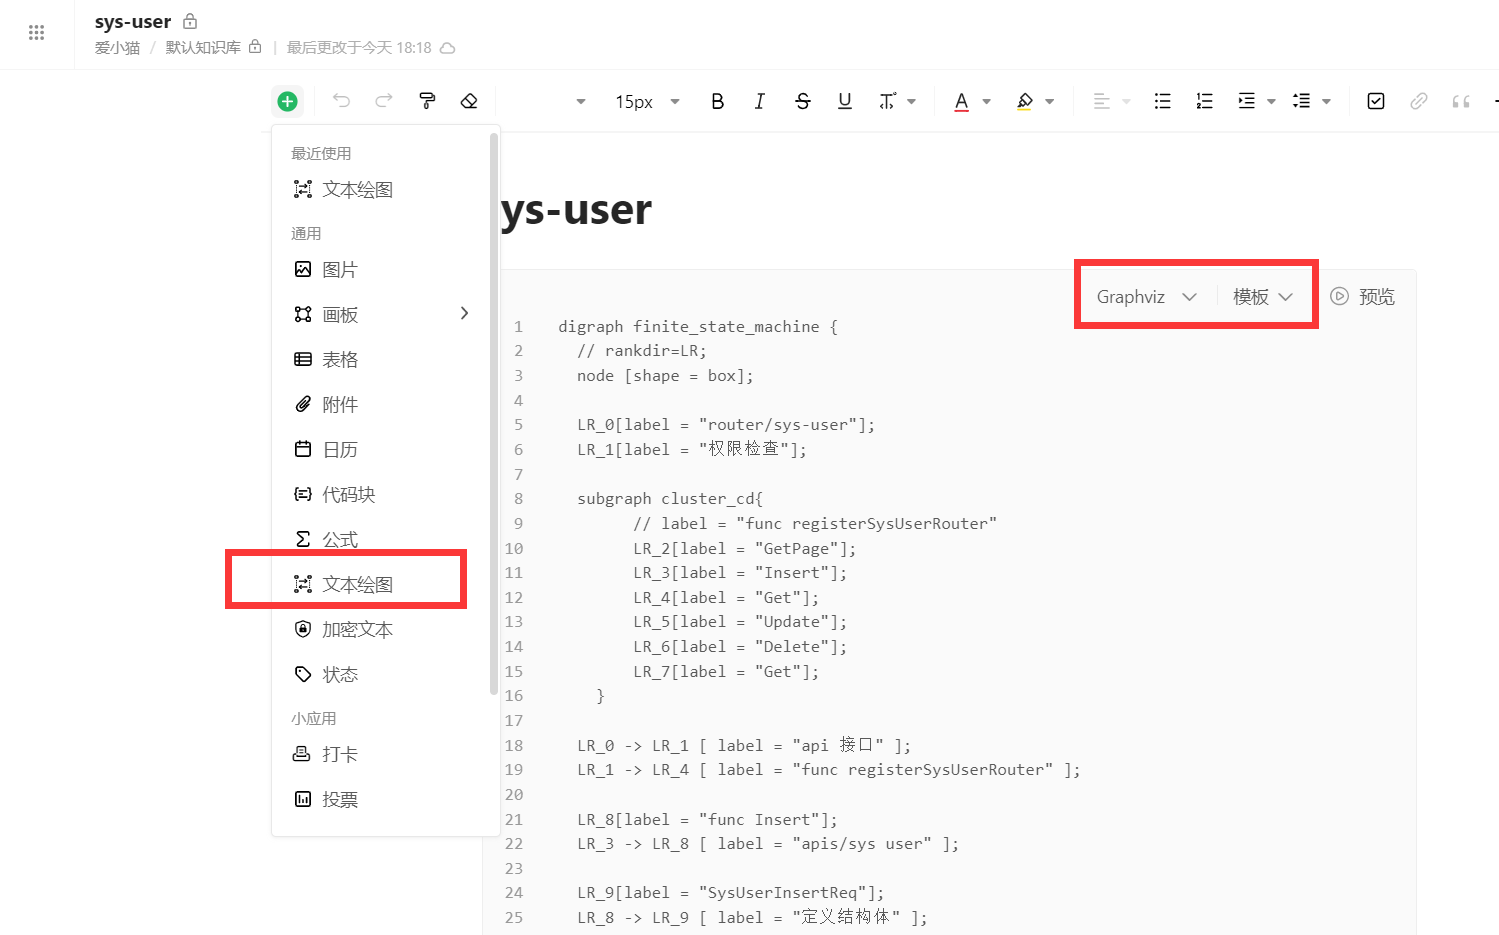
- 我是使用 语雀 中文档自带的文本绘图来使用Graphviz 的。
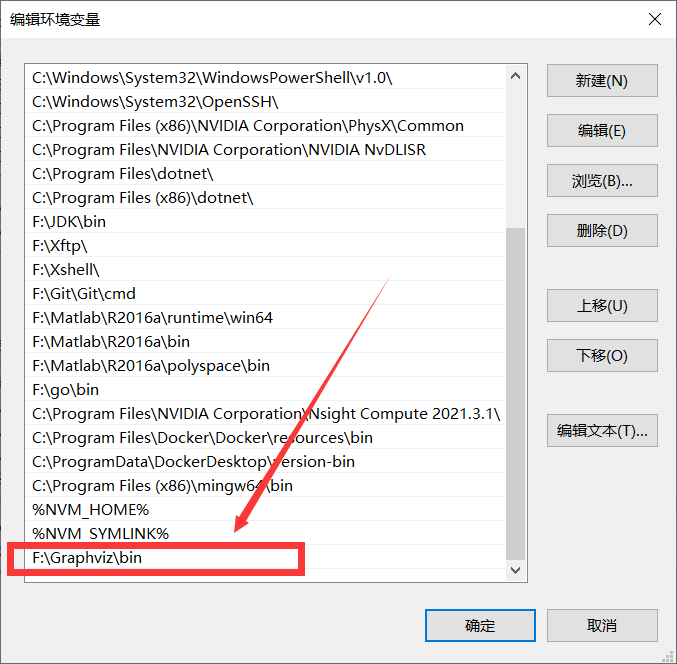
- 如果你想要了解 Graphviz 工具,你可也以进入 Graphviz 官网 下载。按照安装向导安装完以后,记得要把 Graphviz 工具的 bin 目录加到环境变量 PATH 中。例如
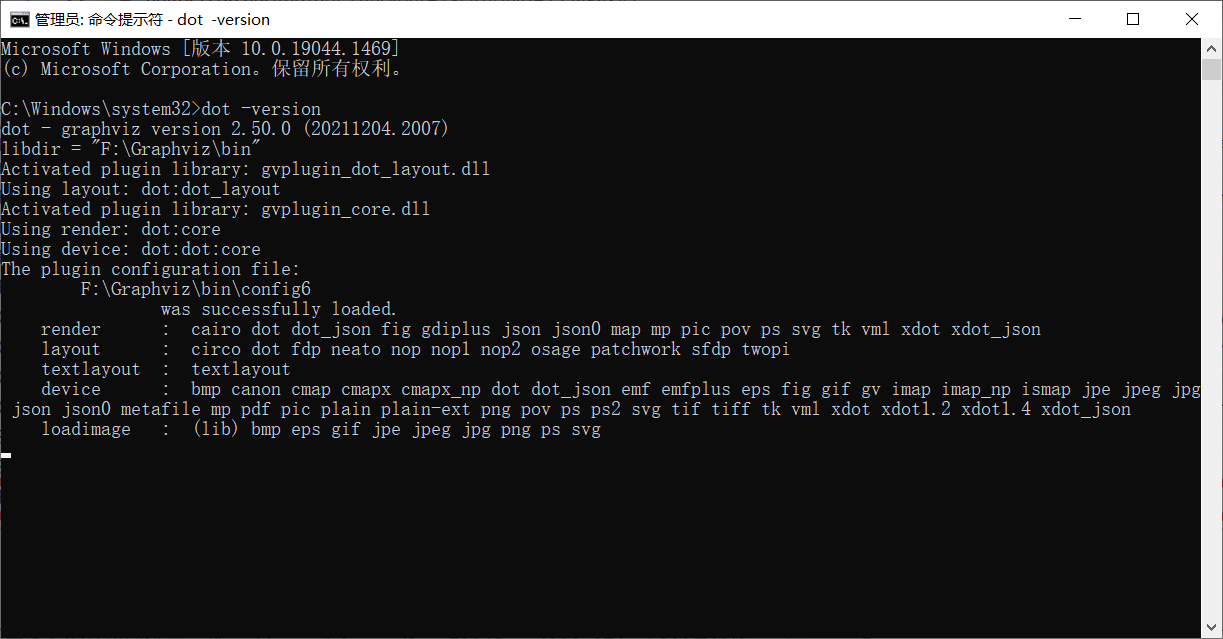
接下来测试下是否安装成功,打开 cmd 命令窗口,输入命令dot -version,出现下图则证明安装成功
三、使用
接下来讲的是在 语雀 中Graphviz的使用。
这是详细的 Grapviz使用语法介绍
3.1、简单使用
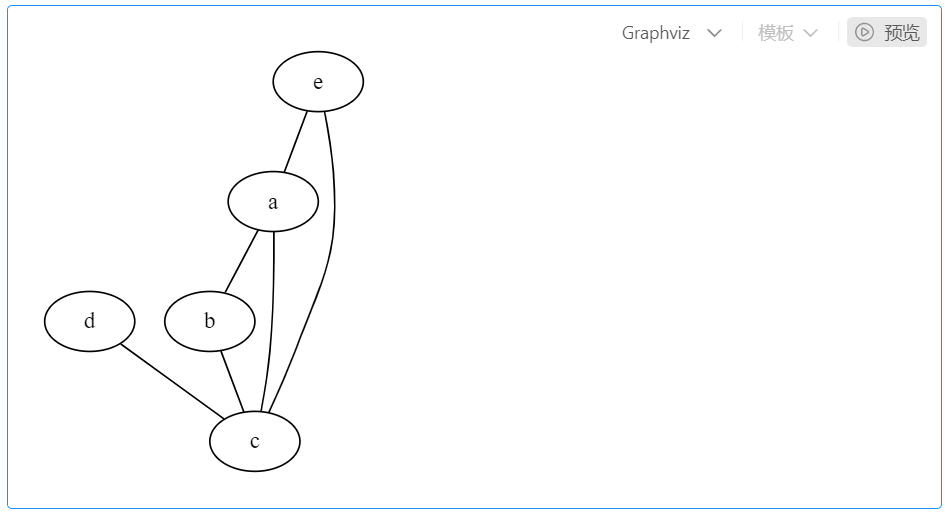
3.1.1 无向图
graph {
    a -- b;
    b -- c;
    a -- c;
    d -- c;
    e -- c;
    e -- a;
  }
效果图:
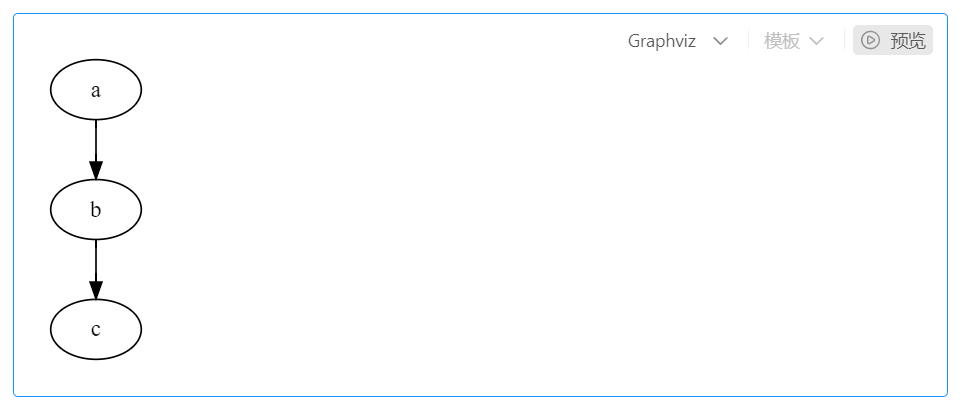
3.1.2 有向图
digraph {
    a -> b;
    b -> c;
}
3.2、稍微复杂点的用法
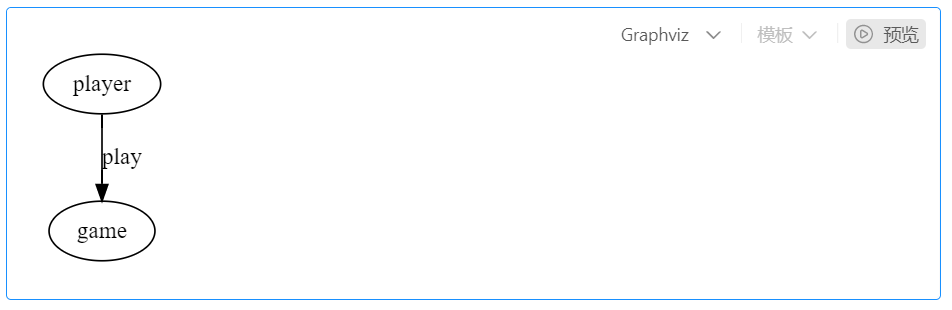
3.2.1 带标签
digraph {
    player[label = "player"];
    game[label = "game"];
    player -> game[label = "play"]
}
效果图:
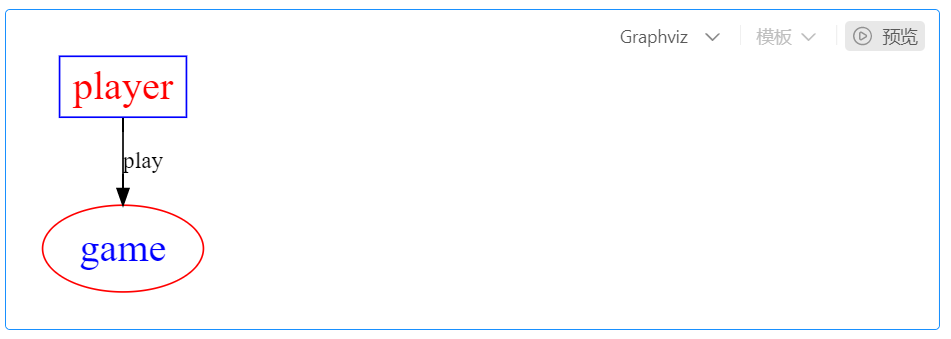
3.2.2 不同颜色
digraph {
    player[label = "player", color = Blue, fontcolor = Red, fontsize = 24, shape = box];
    game[label = "game", color = Red, fontcolor = Blue, fontsize = 24, shape = ellipse];
    player -> game[label = "play"]
}
效果图:
3.2.3 形状
详细可以见 官方文档
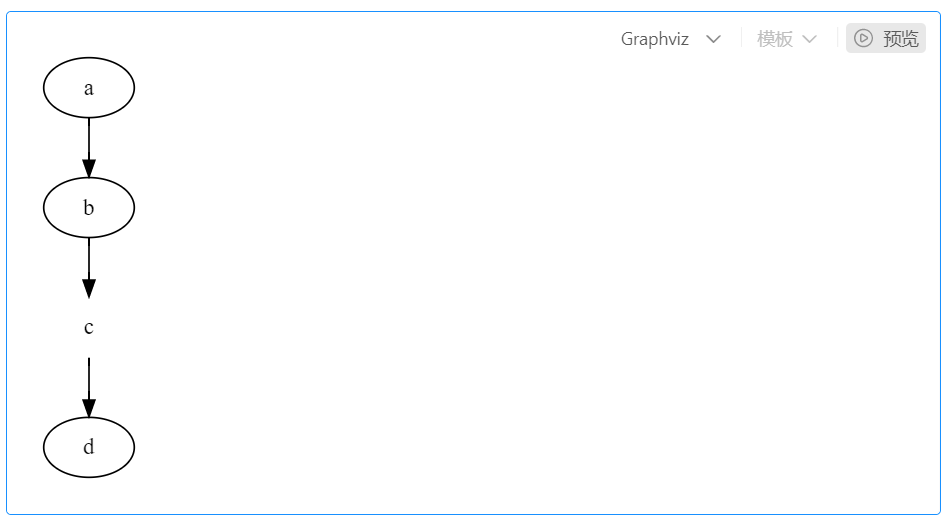
3.2.4 插入图片
digraph {
    c[shape = none, image = "./pic.png"]
    a -> b -> c;
    c -> d;
}
效果图:
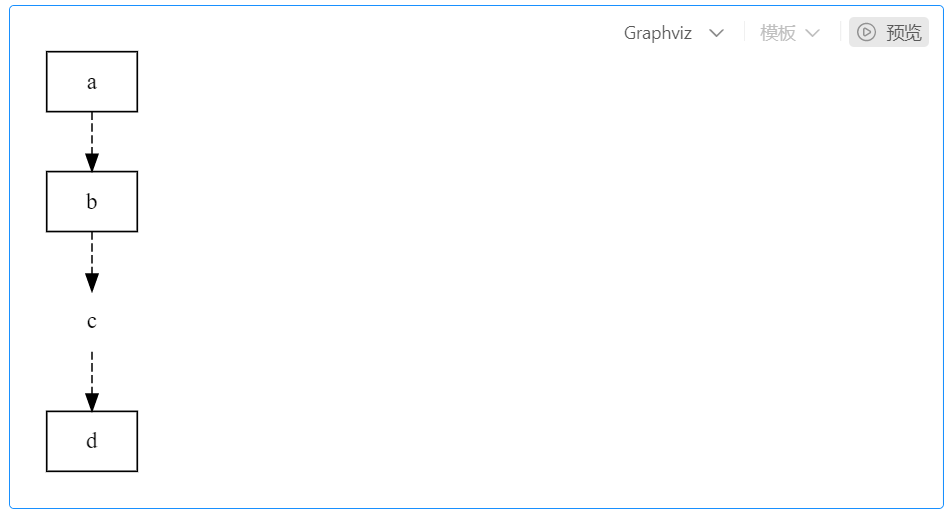
3.2.5 统一节点和连线
digraph {
    node[shape = box]
    edge[style = "dashed"]
    c[shape = none]
    a -> b -> c;
    c -> d;
}
效果图:
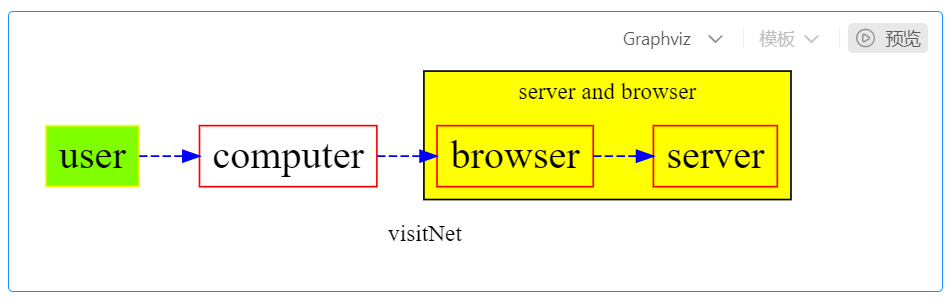
3.2.6 子视图
digraph {
    label = visitNet
    rankdir = LR
    node[color = Red, fontsize = 24, shape = box]
    edge[color = Blue, style = "dashed"]
    user[style = "filled", color = "yellow", fillcolor = "chartreuse"]
    subgraph cluster_cd{
        label = "server and browser"
        bgcolor = yellow;
        browser -> server
    }
    user -> computer;
    computer -> browser;
}
效果图:
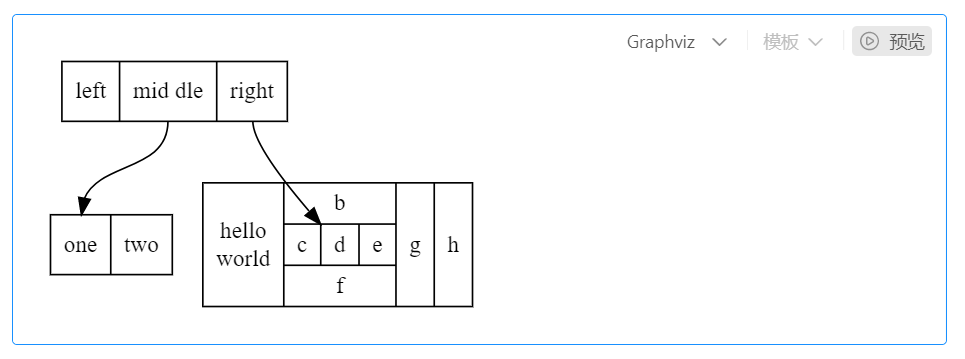
3.2.7 结构视图
digraph {
node[shape = record];
struct1[label = "<f0> left|<f1> mid\ dle|<f2> right"];
struct2[label = "<f0> one|<f1> two"];
struct3[label = "hello\nworld | {b|{c|<here> d|e}|f}|g|h"];
struct1:f1 -> struct2:f0;
struct1:f2 -> struct3:here;
}
效果图:
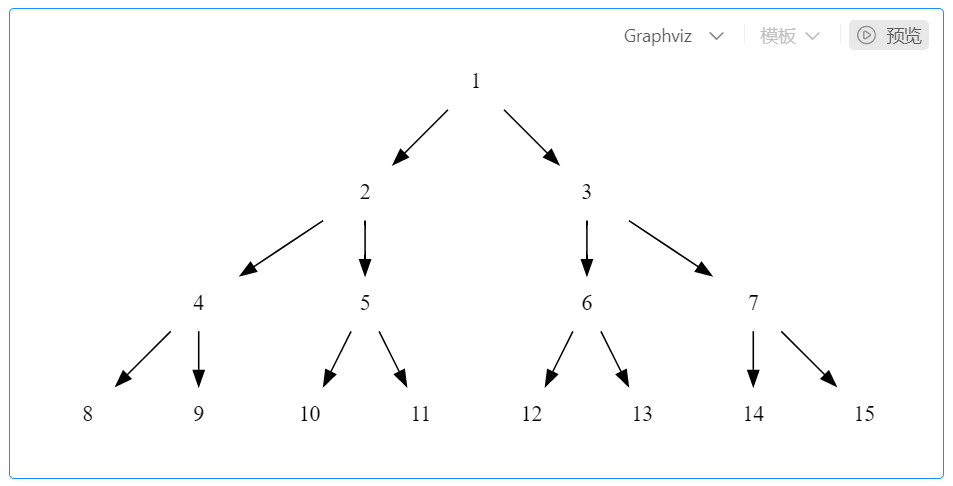
3.2.8 树形结构
digraph tree {
  fontname = "PingFang-SC-Light"
  fontsize = 24
  node[shape = "plaintext"]

  1 -> 2;
  1 -> 3;
  2 -> 4;
  2 -> 5;
  3 -> 6;
  3 -> 7;
  4 -> 8;
  4 -> 9;
  5 -> 10;
  5 -> 11;
  6 -> 12;
  6 -> 13;
  7 -> 14;
  7 -> 15;
}
效果图:
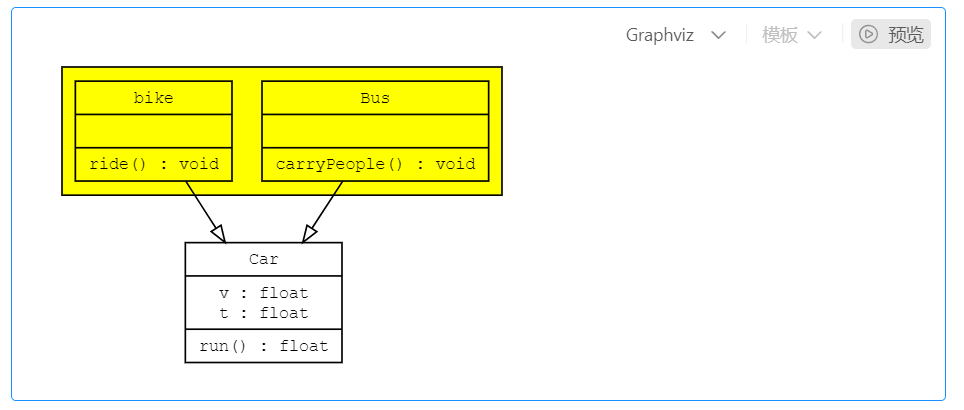
3.2.9 继承
digraph UML {

    node[fontname = "Courier New", fontsize = 10, shape = record];
    edge[fontname = "Courier New", fontsize = 10, arrowhead = "empty"];

    Car[label = "{Car | v : float\nt : float | run() : float}"]

    subgraph clusterSome{
        bgcolor = "yellow";
        Bus[label = "{Bus | | carryPeople() : void}"];
        Bike[label = "{bike | | ride() : void}"];
    }
    Bus -> Car
    Bike -> Car
}
效果图:
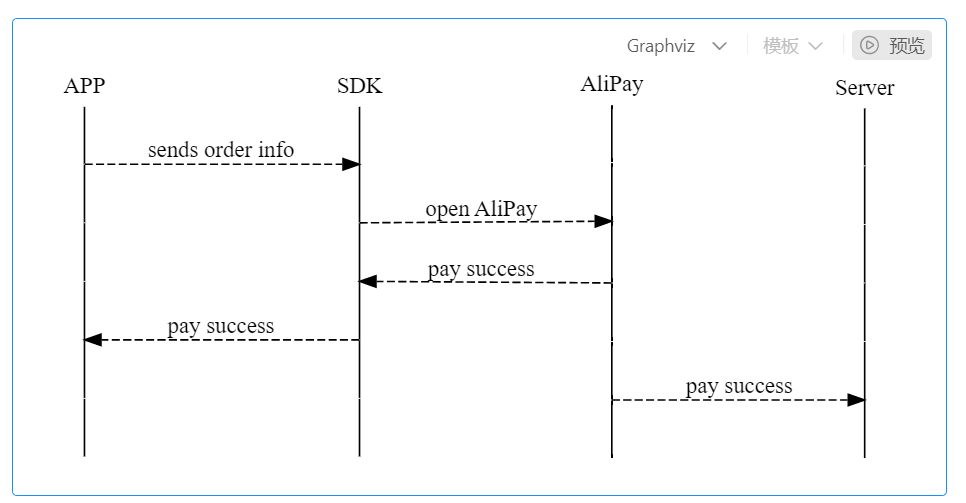
3.2.10 时序图
digraph time {

    rankdir = "LR";
    node[shape = "point", width = 0, height = 0];
    edge[arrowhead = "none", style = "dashed"];

    {
        rank = "same"
        edge[style = "solided"];
        APP[shape = "plaintext"];
        APP -> step00 -> step01 -> step02 -> step03 -> step04 -> step05;
    }

    {
        rank="same";
        edge[style="solided"];
        SDK[shape="plaintext"];
        SDK -> step10 -> step11 -> step12 -> step13 -> step14 -> step15;
    }
    {
        rank="same";
        edge[style="solided"];
        AliPay[shape="plaintext"];
        AliPay -> step20 -> step21 -> step22 -> step23 -> step24 -> step25;
    }
    {
        rank="same";
        edge[style="solided"];
        Server[shape="plaintext"];
        Server -> step30 -> step31 -> step32 -> step33 -> step34 -> step35;
    }

    step00 -> step10 [label="sends order info", arrowhead="normal"];
    step11 -> step21 [label="open AliPay", arrowhead="normal"];
    step22 -> step12 [label="pay success", arrowhead="normal"];
    step13 -> step03 [label="pay success", arrowhead="normal"];
    step24 -> step34 [label="pay success", arrowhead="normal"];
}
效果图:
四、参考
附:有不足、疏漏欢迎指出,我可以借鉴学习后补充。

 浙公网安备 33010602011771号