matplotlib 中的 figure/ax/plt的区别
matplotlib has an extensive codebase that can be daunting to many new users. However, most of matplotlib can be understood with a fairly simple conceptual framework and knowledge of a few important points.
- fig
Figure,就是图的外框,也叫画布,可以包括1-无穷个内框Axes - ax
Axes,就是图的内框,真正的绘图区域。一个figure可能会被划分为多个axes,每个图都在各自的axes里绘制。 - Axis
就是坐标轴,需要注意区分axes和axis,一个axes至少包括2个axis(x-axis,y-axis)。axis主要对坐标轴的刻度、刻度标签进行设置,ticks的位置通过locator定位。 - plt
Pyplot为底层面向对象的绘图库提供状态机接口。状态机隐式自动创建图形和轴,以实现所需的绘图。对matlab熟悉的人应该用plt绘图更顺手。
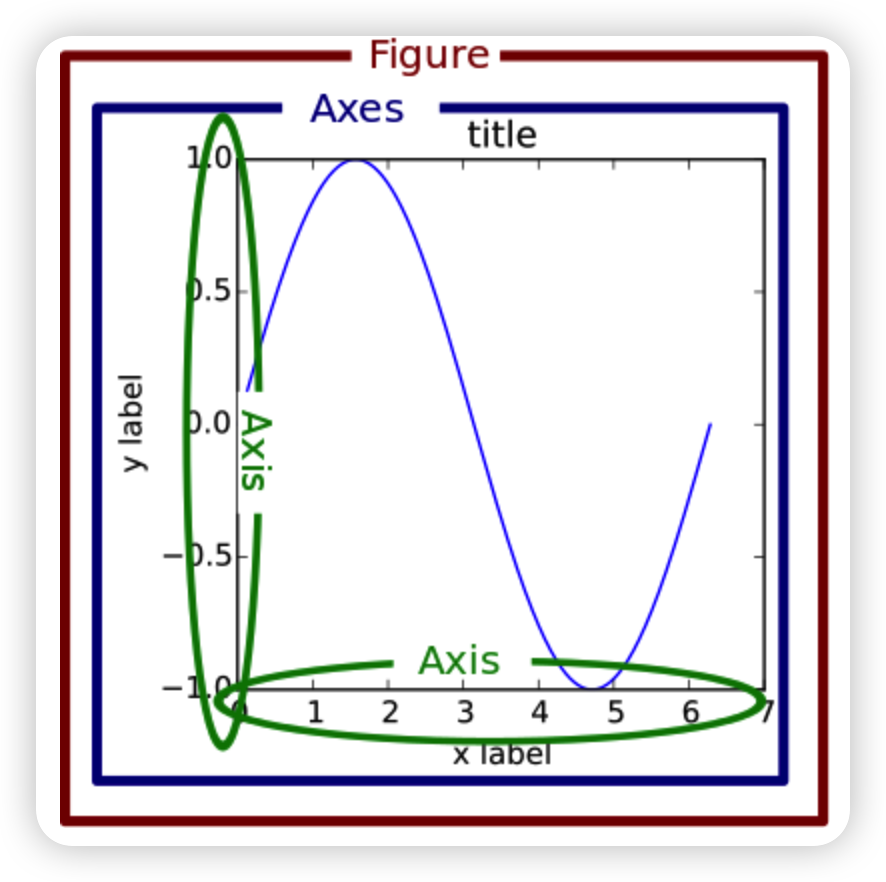
图源:Matplotlib官方手册 https://matplotlib.org/1.5.1/faq/usage_faq.html#parts-of-a-figure
import matplotlib.pyplot as plt
import math
import numpy as np
x=np.arange(1,10)
y=x**3
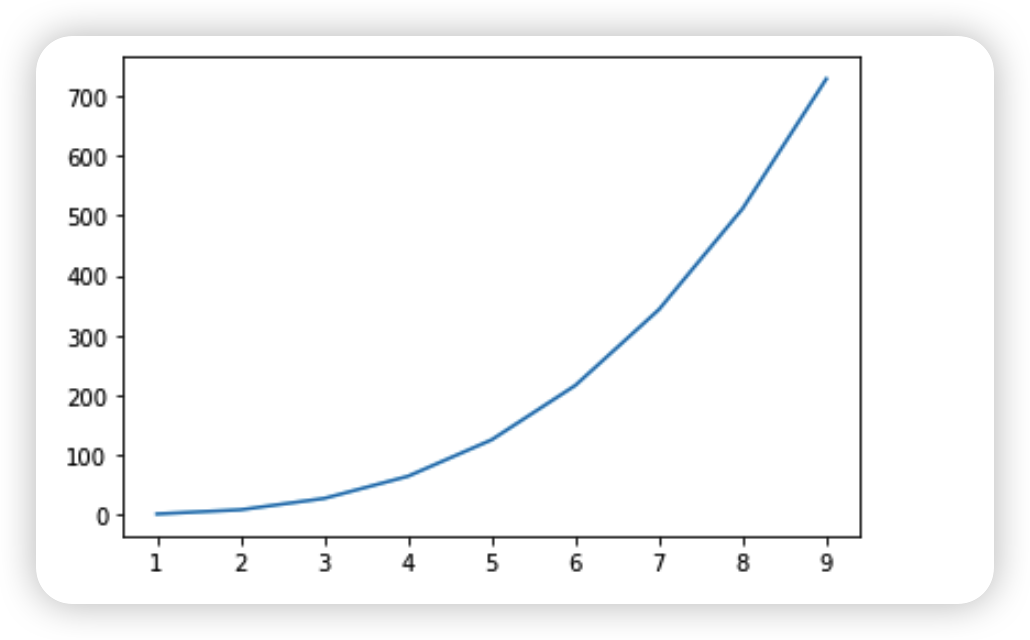
#plt.plot()
plt.figure() # <Figure size 432x288 with 0 Axes>
# Plot some data on the axes.
plt.plot(x,y)
plt.show()
#ax.plot()

fig,ax=plt.subplots()# Create a figure containing a single axes.
ax.plot(x,y) # Plot some data on the axes.
plt.show()
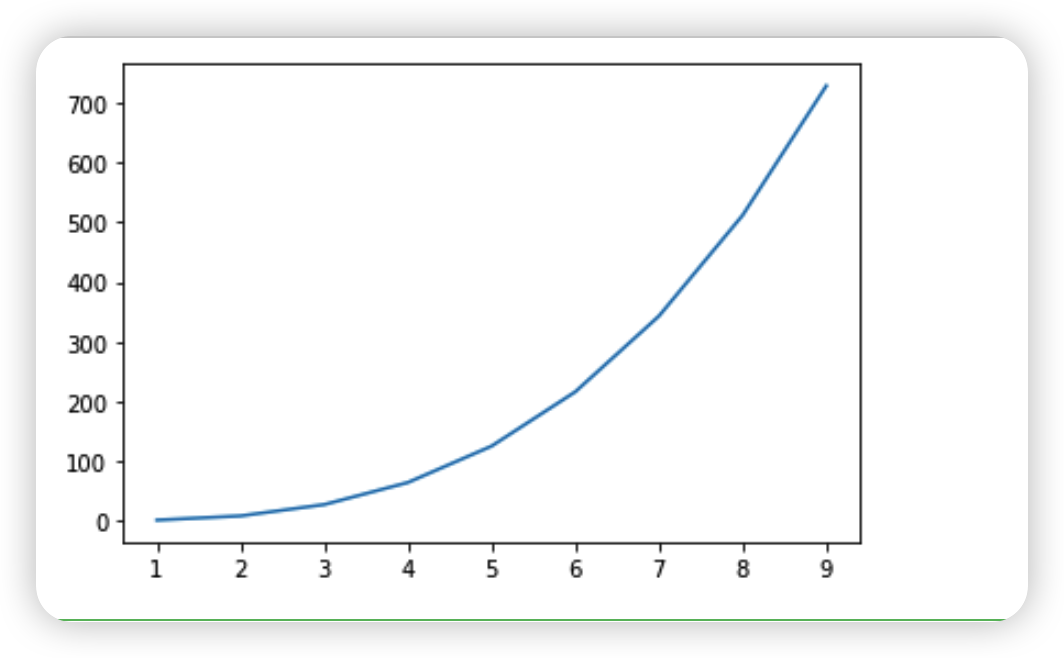
结果是一样的,区别在于:
(1)plt.plot()先生成一个figure画布,然后在这个画布上隐式生成的画图区域上画图
(2)ax.plot()同时生成了fig和ax对象,然后用ax对象在其区域上画图,推荐使用该方式
参考:
「1」https://blog.csdn.net/qq_41159191/article/details/125876349
「2」https://www.cnblogs.com/cgmcoding/p/13384221.html
「3」https://matplotlib.org/stable/users/explain/api_interfaces.html#api-interfaces

 浙公网安备 33010602011771号