【深度学习 - 吴恩达】L1W3作业
本文为吴恩达 Deep Learning 作业,浅层神经网络
获得数据
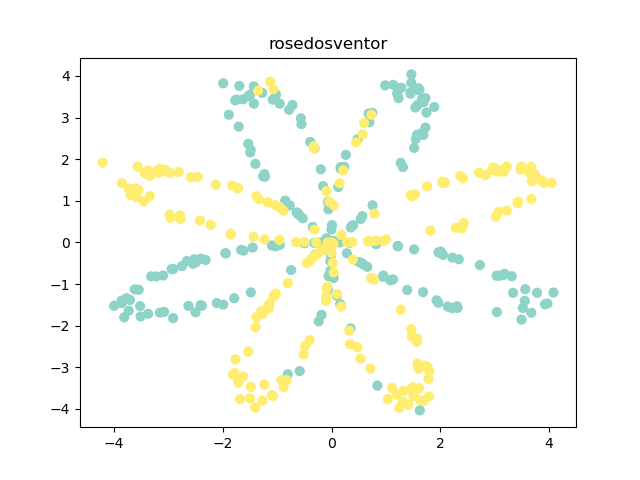
X, Y = load_planar_dataset()
show_data(X, Y)

def show_data(X, Y):
    plt.scatter(X[0, :], X[1, :], c=Y.reshape(X[0, :].shape), s=40, cmap='Set3')
    plt.title("rosedosventor")
    plt.show()


def load_planar_dataset():
    np.random.seed(1)
    m = 400  # number of examples
    N = int(m / 2)  # number of points per class
    D = 2  # dimensionality
    X = np.zeros((m, D))  # data matrix where each row is a single example
    Y = np.zeros((m, 1), dtype='uint8')  # labels vector (0 for red, 1 for blue)
    a = 4  # maximum ray of the flower

    for j in range(2):  # 玫瑰线
        ix = range(N * j, N * (j + 1))
        t = np.linspace(j * 3.12, (j + 1) * 3.12, N) + np.random.randn(N) * 0.2  # theta
        r = a * np.sin(4 * t) + np.random.randn(N) * 0.2  # radius
        X[ix] = np.c_[r * np.sin(t), r * np.cos(t)]
        Y[ix] = j

    X = X.T
    Y = Y.T

    return X, Y
- 样本数量 。
- 维度 。
- 或 ,对应的点为绿色或黄色,每种颜色的点各 个。
主要算法
神经网络结构
def layer_sizes(X, Y):
    n_x = X.shape[0]  # size of input layer
    n_h = 4
    n_y = Y.shape[0]  # size of output layer
    return n_x, n_h, n_y
- 输入层维度
n_x为 ,隐藏层维度n_h为 (自定义),输出层维度n_y为 。
初始化
def initialize_parameters(n_x, n_h, n_y):
    np.random.seed(2)

    W1 = np.random.randn(n_h, n_x) * 0.01  # 重点
    b1 = np.zeros((n_h, 1))  # 重点
    W2 = np.random.randn(n_y, n_h) * 0.01  # 重点
    b2 = np.zeros((n_y, 1))  # 重点

    assert (W1.shape == (n_h, n_x))
    assert (b1.shape == (n_h, 1))
    assert (W2.shape == (n_y, n_h))
    assert (b2.shape == (n_y, 1))

    parameters = {"W1": W1, "b1": b1, "W2": W2, "b2": b2}
    return parameters
W1的维度是(n_h, n_x),b1的维度是(n_h, 1),W2的维度是(n_y, n_h),b2的维度是(n_y, 1)。
向前传播
def forward_propagation(X, parameters):
    W1 = parameters["W1"]
    b1 = parameters["b1"]
    W2 = parameters["W2"]
    b2 = parameters["b2"]

    Z1 = np.dot(W1, X) + b1  # 重点
    A1 = np.tanh(Z1)  # 重点
    Z2 = np.dot(W2, A1) + b2  # 重点
    A2 = sigmoid(Z2)  # 重点

    assert (A2.shape == (1, X.shape[1]))

    cache = {"Z1": Z1, "A1": A1, "Z2": Z2, "A2": A2}
    return A2, cache
计算代价
def compute_cost(A2, Y):
    m = Y.shape[1]  # number of example

    logProbs = Y * np.log(A2) + (1 - Y) * np.log(1 - A2)  # 重点
    cost = -1 / m * np.sum(logProbs)  # 重点

    cost = np.squeeze(cost)  # makes sure cost is the dimension we expect.
    assert (isinstance(cost, float))

    return cost
反向传播
def backward_propagation(parameters, cache, X, Y):
    m = X.shape[1]

    W2 = parameters["W2"]

    A1 = cache["A1"]
    A2 = cache["A2"]

    dZ2 = A2 - Y  # 重点
    dW2 = 1 / m * np.dot(dZ2, A1.T)  # 重点
    db2 = 1 / m * np.sum(dZ2, axis=1, keepdims=True)  # 重点
    dZ1 = np.dot(W2.T, dZ2) * (1 - np.power(A1, 2))  # 重点
    dW1 = 1 / m * np.dot(dZ1, X.T)  # 重点
    db1 = 1 / m * np.sum(dZ1, axis=1, keepdims=True)  # 重点

    grads = {"dW1": dW1, "db1": db1, "dW2": dW2, "db2": db2}
    return grads
更新
def update_parameters(parameters, grads, learning_rate=1.2):
    W1 = parameters["W1"]
    b1 = parameters["b1"]
    W2 = parameters["W2"]
    b2 = parameters["b2"]

    dW1 = grads["dW1"]
    db1 = grads["db1"]
    dW2 = grads["dW2"]
    db2 = grads["db2"]

    W1 = W1 - learning_rate * dW1  # 重点
    b1 = b1 - learning_rate * db1  # 重点
    W2 = W2 - learning_rate * dW2  # 重点
    b2 = b2 - learning_rate * db2  # 重点

    parameters = {"W1": W1, "b1": b1, "W2": W2, "b2": b2}
    return parameters
整合
def nn_model(X, Y, n_h, num_iterations=10000, print_cost=False):
    np.random.seed(3)
    n_x = layer_sizes(X, Y)[0]
    n_y = layer_sizes(X, Y)[2]

    parameters = initialize_parameters(n_x, n_h, n_y)

    for i in range(0, num_iterations):  # 重点
        A2, cache = forward_propagation(X, parameters)  # 重点
        cost = compute_cost(A2, Y)  # 重点
        grads = backward_propagation(parameters, cache, X, Y)  # 重点
        parameters = update_parameters(parameters, grads)  # 重点
        if print_cost and i % 1000 == 0:
            print("Cost after iteration %i: %f" % (i, cost))
    return parameters
结果
预测
def predict(parameters, X):
    A2, cache = forward_propagation(X, parameters)
    predictions = np.round(A2)
    return predictions
main 函数
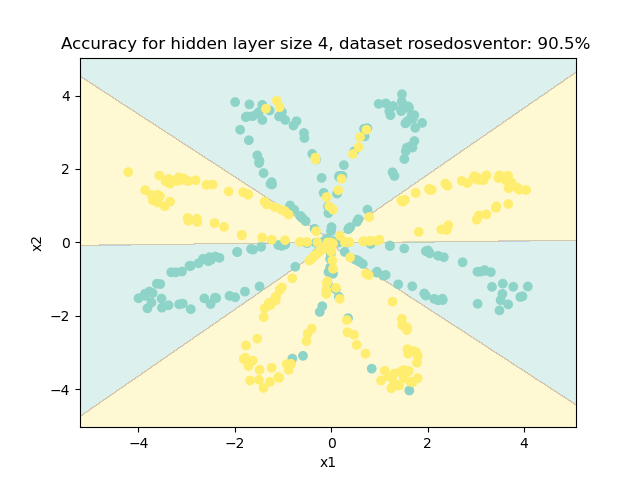
def main():
    X, Y = load_planar_dataset()
    show_data(X, Y)

    parameters = nn_model(X, Y, 4)
    predictions = predict(parameters, X)
    accuracy = float((np.dot(Y, predictions.T) + np.dot(1 - Y, 1 - predictions.T)) / float(Y.size) * 100)

    plot_decision_boundary(lambda x: predict(parameters, x.T), X, Y)
    plt.title("Accuracy for hidden layer size 4, dataset rosedosventor: {}% ".format(accuracy))
    plt.show()
绘图
def plot_decision_boundary(model, X, Y):
    # Set min and max values and give it some padding
    x_min, x_max = X[0, :].min() - 1, X[0, :].max() + 1  # 横坐标的最小值和最大值
    y_min, y_max = X[1, :].min() - 1, X[1, :].max() + 1  # 纵坐标的最小值和最大值
    h = 0.01
    # Generate a grid of points with distance h between them
    xx, yy = np.meshgrid(np.arange(x_min, x_max, h), np.arange(y_min, y_max, h))
    # Predict the function value for the whole grid
    Z = model(np.c_[xx.ravel(), yy.ravel()])
    Z = Z.reshape(xx.shape)
    # Plot the contour and training examples
    plt.contourf(xx, yy, Z, alpha=0.3, cmap='Set3')
    plt.ylabel('x2')
    plt.xlabel('x1')
    plt.scatter(X[0, :], X[1, :], c=Y.reshape(X[0, :].shape), cmap='Set3')

拓展
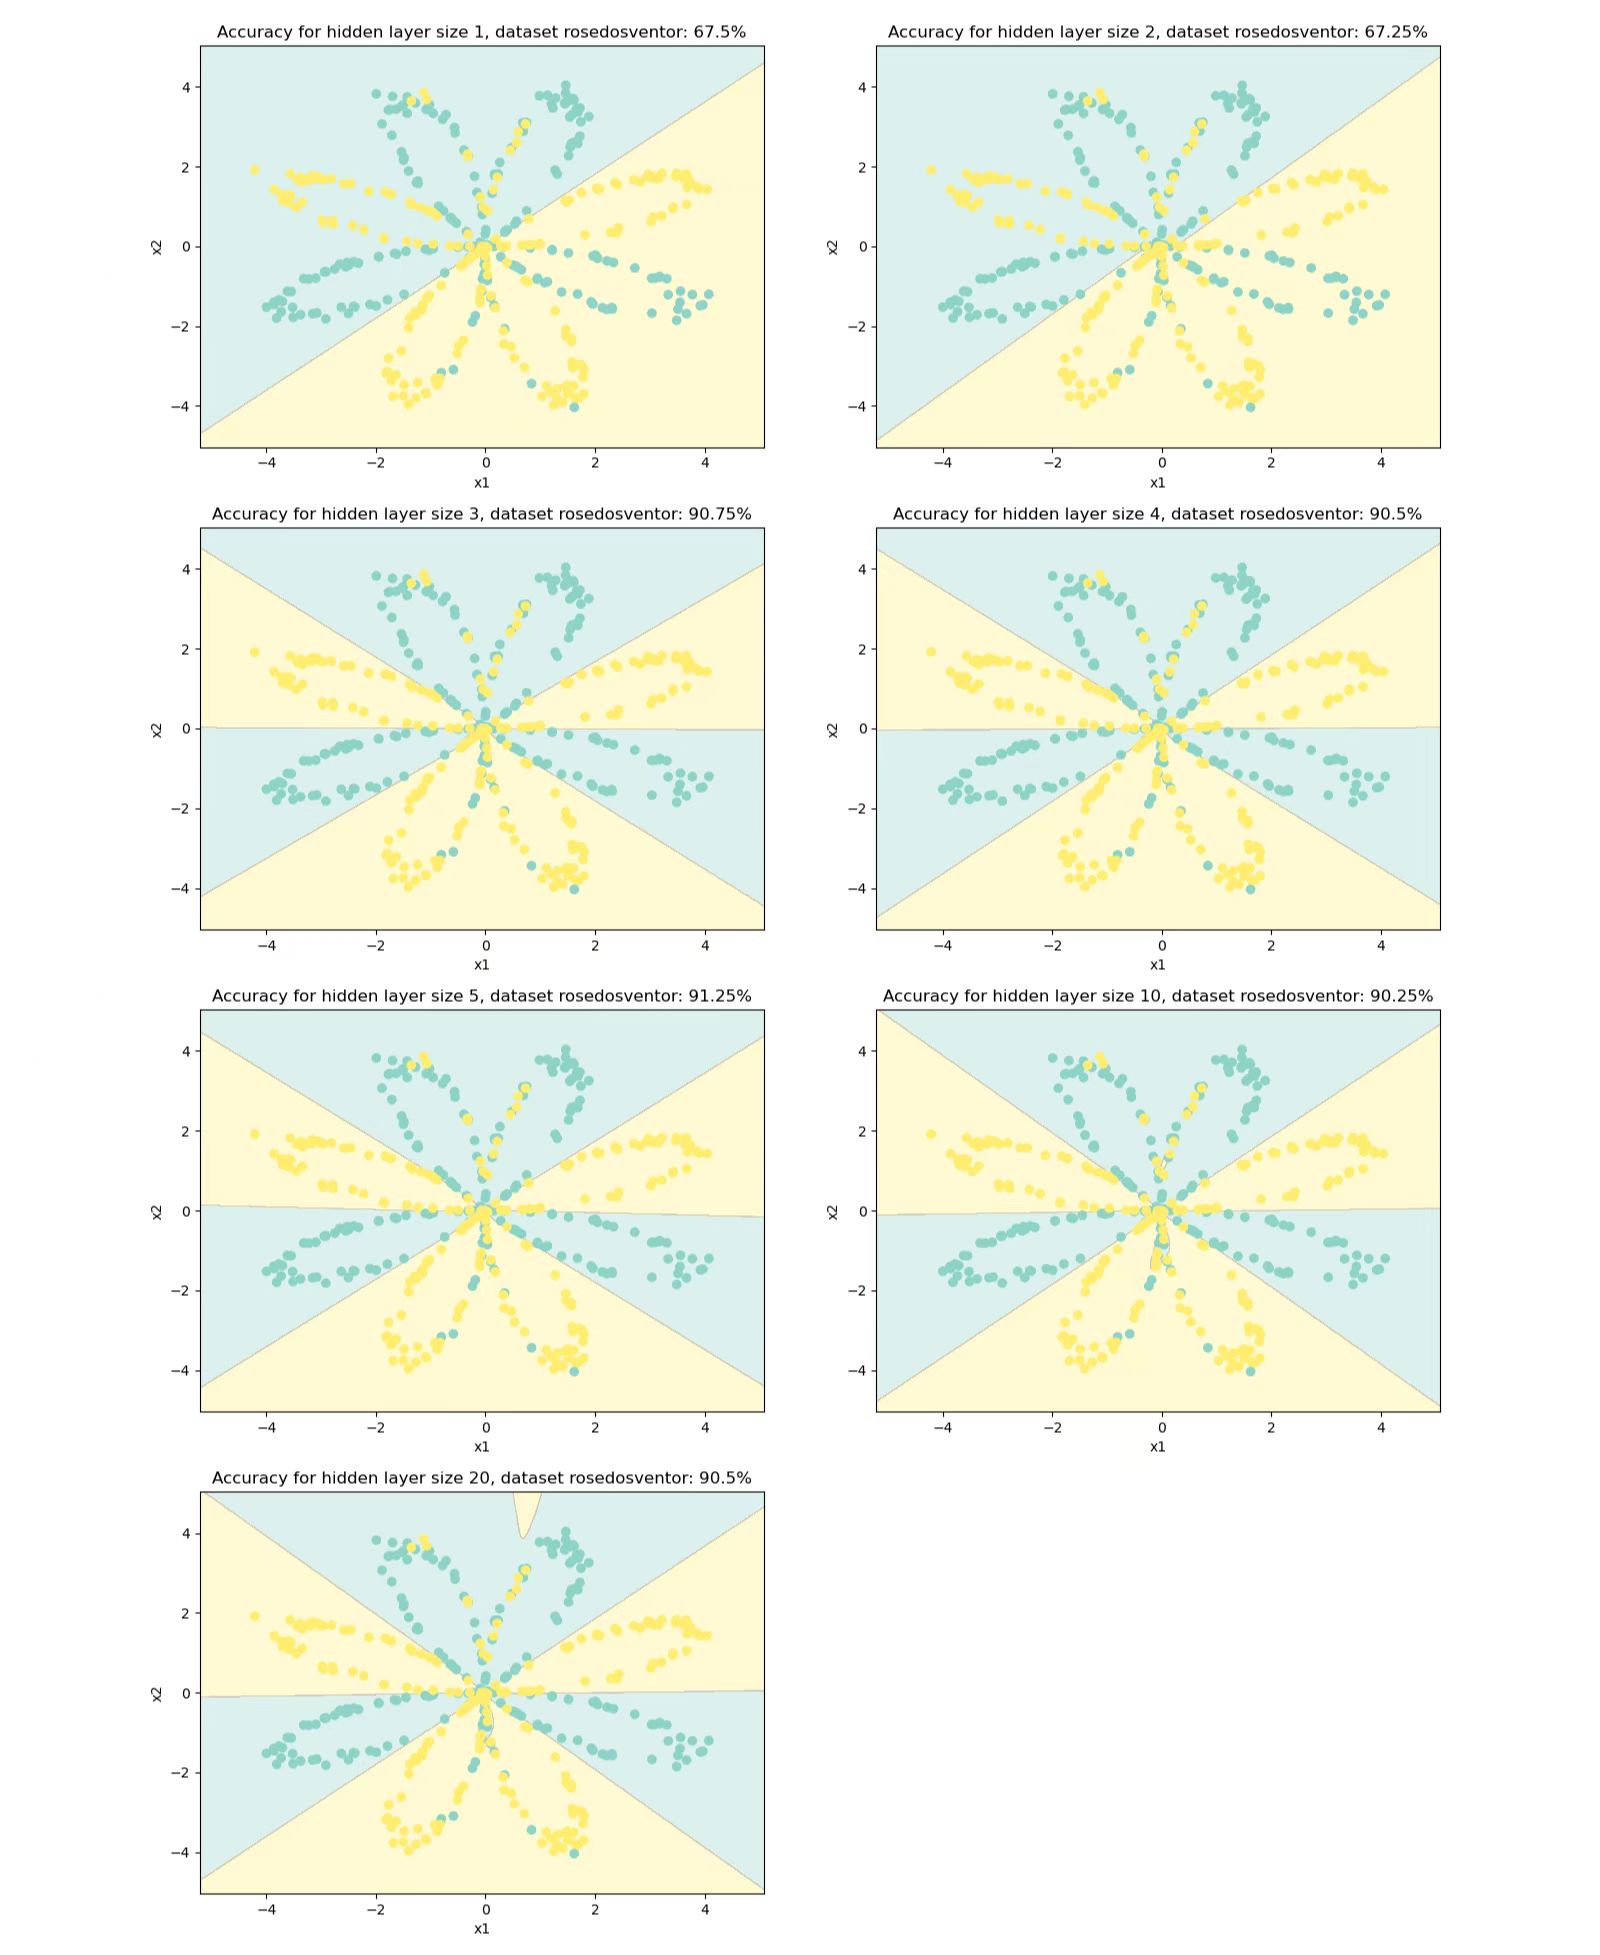
隐藏层大小的选择
def main():
    X, Y = load_planar_dataset()
    plt.figure(figsize=(16, 24))
    hidden_layer_sizes = [1, 2, 3, 4, 5, 10, 20]
    for i, n_h in enumerate(hidden_layer_sizes):
        plt.subplot(4, 2, i + 1)
        parameters = nn_model(X, Y, n_h, num_iterations=5000)
        plot_decision_boundary(lambda x: predict(parameters, x.T), X, Y)
        predictions = predict(parameters, X)
        accuracy = float((np.dot(Y, predictions.T) + np.dot(1 - Y, 1 - predictions.T)) / float(Y.size) * 100)
        plt.title("Accuracy for hidden layer size {}, dataset rosedosventor: {}%".format(n_h, accuracy))
    plt.show()

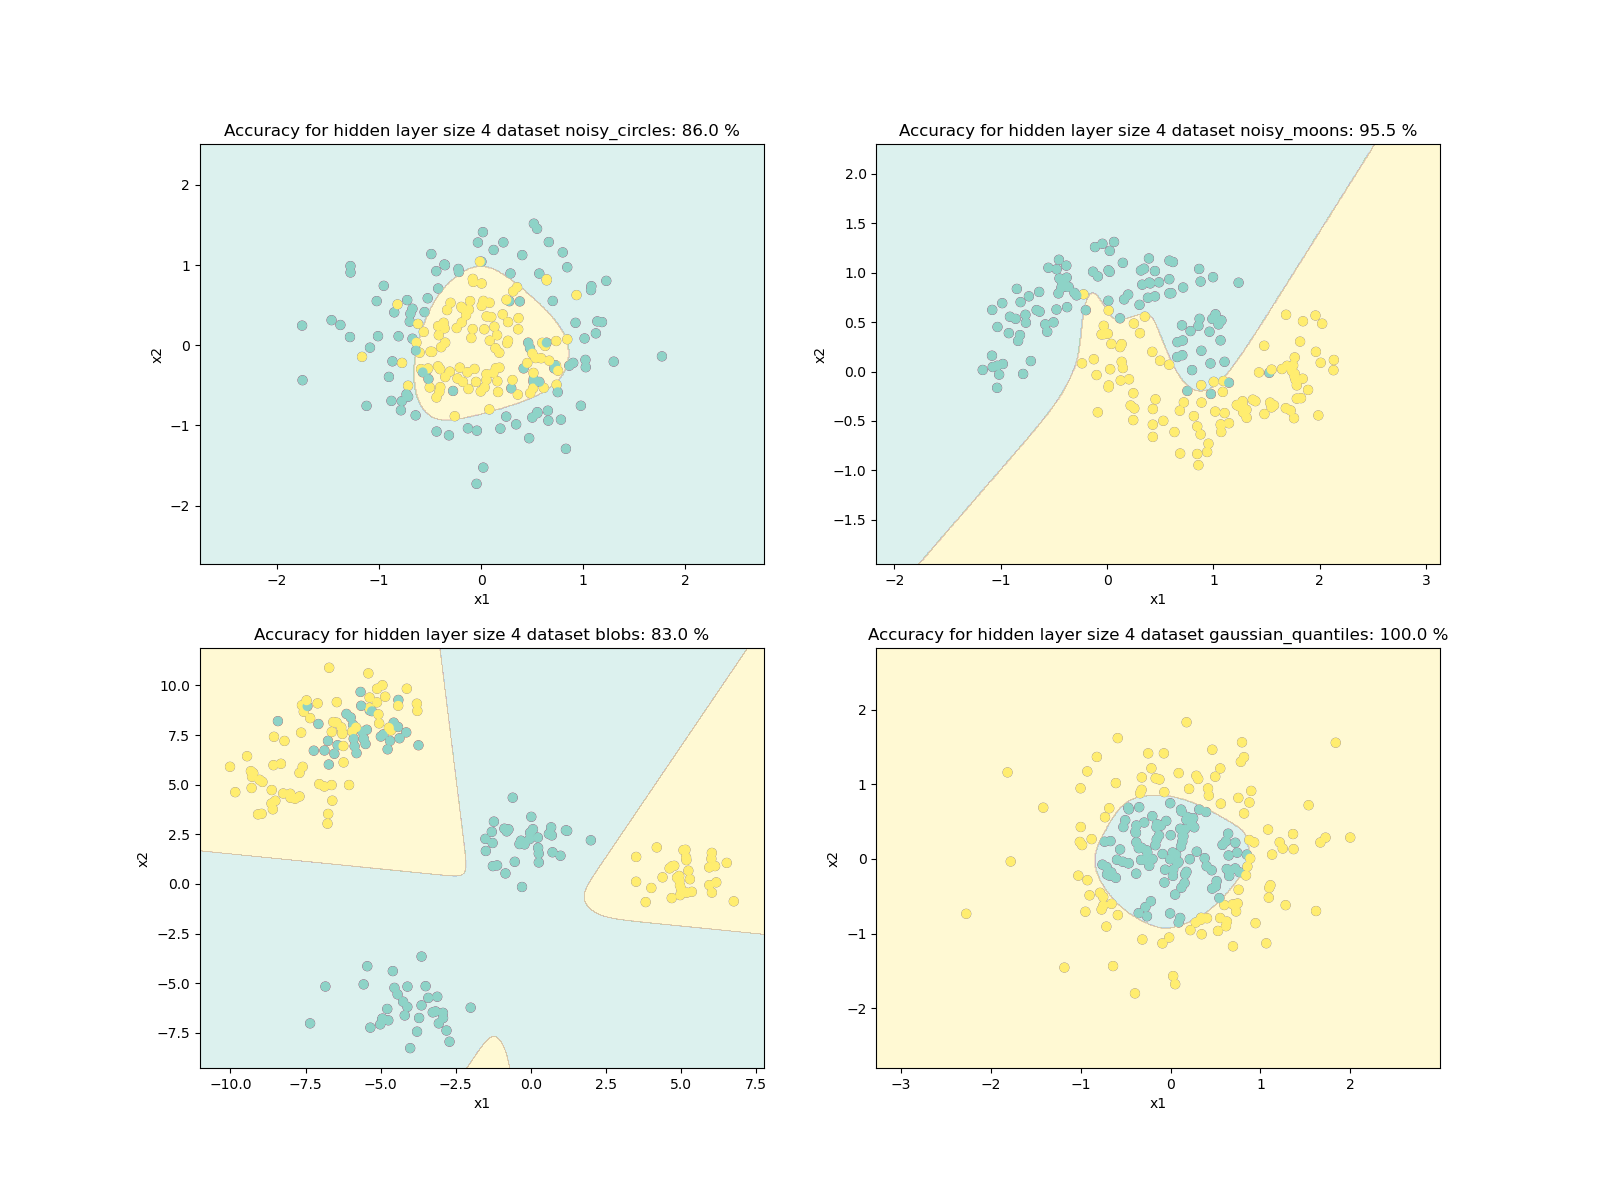
其他数据集
def load_extra_datasets():
    N = 200
    noisy_circles = sklearn.datasets.make_circles(n_samples=N, factor=.5, noise=.3)
    noisy_moons = sklearn.datasets.make_moons(n_samples=N, noise=.2)
    blobs = sklearn.datasets.make_blobs(n_samples=N, random_state=5, n_features=2, centers=6)
    gaussian_quantiles = sklearn.datasets.make_gaussian_quantiles(
        mean=None, cov=0.5, n_samples=N, n_features=2, n_classes=2, shuffle=True, random_state=None)
    no_structure = np.random.rand(N, 2), np.random.rand(N, 2)

    return noisy_circles, noisy_moons, blobs, gaussian_quantiles, no_structure

def main():
    noisy_circles, noisy_moons, blobs, gaussian_quantiles, no_structure = load_extra_datasets()
    datasets = {"noisy_circles": noisy_circles,
                "noisy_moons": noisy_moons,
                "blobs": blobs,
                "gaussian_quantiles": gaussian_quantiles}

    datasetLabels = ["noisy_circles", "noisy_moons", "blobs", "gaussian_quantiles"]
    plt.figure(figsize=(16, 12))
    for i, dataset in enumerate(datasetLabels):
        X, Y = datasets[dataset]
        X, Y = X.T, Y.reshape(1, Y.shape[0])
        if dataset == "blobs":
            Y = Y % 2

        plt.subplot(2, 2, i + 1)
        plt.scatter(X[0, :], X[1, :], c=Y.reshape(X[0, :].shape), s=40, cmap=plt.cm.Spectral)
        parameters = nn_model(X, Y, 4)
        predictions = predict(parameters, X)
        accuracy = float((np.dot(Y, predictions.T) + np.dot(1 - Y, 1 - predictions.T)) / float(Y.size) * 100)
        plot_decision_boundary(lambda x: predict(parameters, x.T), X, Y)
        plt.title("Accuracy for hidden layer size 4 dataset {}: {} %".format(dataset, accuracy))
    plt.show()
关于 Python
plt
plt.scatter:
matplotlib.pyplot.scatter(x, y, s=None, c=None, marker=None, cmap=None, norm=None, vmin=None, vmax=None, alpha=None, linewidths=None, verts=None, edgecolors=None, hold=None, data=None, **kwargs)
- 绘制散点图。
x、y:散点的坐标。s:散点的面积。c:散点的颜色(默认值为蓝色,'b',其余颜色同plt.plot( ))。marker:散点样式(默认值为实心圆,'o',其余样式同plt.plot( ))。alpha:散点透明度([0, 1]之间的数,0 表示完全透明,1 则表示完全不透明)。linewidths:散点的边缘线宽。edgecolors:散点的边缘颜色。cmap:调色盘,取值为plt.cm.Spectral时,给不同c的取值不同的颜色,为不同类别的样本分别分配不同的颜色,但是这个样子不好看,嘻嘻~。- 剩下的参数,以后再探索吧,咕咕咕~
plt.contourf:
- 绘制轮廓线(等高线),对等高线间的填充区域进行填充。
plt.subplot:
- 第一个参数为子图行数,第二个参数为子图列数。第三个参数为索引。
- 子图将分布在行列的索引位置上,索引从 1 开始,从右上角增加到右下角。
np
np.linspace:
numpy.linspace(start, stop, num=50, endpoint=True, retstep=False, dtype=None, axis=0)
- 创建等差数列。
start:返回样本数据开始点。stop:返回样本数据结束点。num:生成的样本数据量,默认为 50。endpoint:True则包含stop;False则不包含stop。retstep:如果为True则结果会给出数据间隔。dtype:输出数组类型。axis:0(默认)或 -1。
np.c_:
- 将将一维数组作为列放入到二维数组中。
np.arrange
- 返回一个有终点和起点的固定步长的排列,如 [1, 2, 3, 4, 5],起点是 1,终点是 6,步长为 1。
np.meshgrid:
X, Y = np.meshgrid(x, y)
- 将
x中每一个数据和y中每一个数据组合生成很多点,然后将这些点的x坐标放入到X中,y坐标放入Y中,并且相应位置是对应的。
xx.ravel():
array类型对象的方法,ravel函数将多维数组降为一维,仍返回array数组,元素以列排列。
sklearn
- 咕咕咕~


【推荐】国内首个AI IDE,深度理解中文开发场景,立即下载体验Trae
【推荐】编程新体验,更懂你的AI,立即体验豆包MarsCode编程助手
【推荐】抖音旗下AI助手豆包,你的智能百科全书,全免费不限次数
【推荐】轻量又高性能的 SSH 工具 IShell:AI 加持,快人一步
· 25岁的心里话
· 闲置电脑爆改个人服务器(超详细) #公网映射 #Vmware虚拟网络编辑器
· 零经验选手,Compose 一天开发一款小游戏!
· 通过 API 将Deepseek响应流式内容输出到前端
· 因为Apifox不支持离线,我果断选择了Apipost!