MATLAB(Octave)命令记录
1. struct:结构体数组
aaaa_s.a = 1;
aaaa_s.b = {'A','B','C'}
aaaa_s.c = [1 2 3 4; 5 6 7 8];
save aaaa_s.txt aaaa_s;
save的结果文件为:


# Created by Octave 8.2.0, Fri Jul 28 15:31:37 2023 CST <wuxiong.wx@B-P26SQ05P-0045.local>
# name: aaaa_s
# type: scalar struct
# ndims: 2
 1 1
# length: 3
# name: a
# type: scalar
1


# name: b
# type: cell
# rows: 1
# columns: 3
# name: <cell-element>
# type: sq_string
# elements: 1
# length: 1
A


# name: <cell-element>
# type: sq_string
# elements: 1
# length: 1
B


# name: <cell-element>
# type: sq_string
# elements: 1
# length: 1
C


# name: c
# type: matrix
# rows: 2
# columns: 4
 1 2 3 4
 5 6 7 8
2. plot:画二维曲线
plot(X,Y,LineSpec) : LineSpec 使用指定的线型、标记和颜色创建绘图; 示例: "--or" 是带有圆形标记的红色虚线
pos_X=[1 2]'
pos_y=[3 4]'
neg_X=[5 6]'
neg_y=[7 8]'
plot(pos_X, pos_y, 'k+', 'LineWidth', 1, 'MarkerSize', 7)  // k+是标记:black黑色的+; +的线宽为1,+标记的大小为7
hold on;
plot(neg_X, neg_y, 'ko', 'MarkerFaceColor', 'y', 'MarkerSize', 7)  // MarkerFaceColor — 标记填充颜色  "none" (默认) | "auto" | RGB 三元组 | 十六进制颜色代码 | "r" | "g" | "b" | ...  短名称"y"黄色,对应的RGB三元组为[1 1 0]; MarkerSize — 标记大小 6 (默认) | 正值
LineSpec — 线型、标记和颜色 字符串 | 字符向量
- LineStyle — 线型 "-" (默认) | "--" | ":" | "-." | "none" 分别为实线、虚线、点线、点划线、无线条
- LineWidth — 线条宽度 0.5 (默认) | 正值 (线宽,指定为以磅为单位的正值,其中 1 磅 = 1/72 英寸。如果该线条具有标记,则线条宽度也会影响标记边。)
- Marker — 标记符号 "none" (默认) | "o" | "+" | "*" | "." | ...
- MarkerFaceColor — 标记填充颜色 "none" (默认) | "auto" | RGB 三元组 | 十六进制颜色代码 | "r" | "g" | "b" | ... 短名称"y"黄色,对应的RGB三元组为[1 1 0];
- MarkerSize — 标记大小 6 (默认) | 正值

2. 画散点图scatter
function plotDataPoints(X, idx, K)
%PLOTDATAPOINTS plots data points in X, coloring them so that those with the same
%index assignments in idx have the same color
%   PLOTDATAPOINTS(X, idx, K) plots data points in X, coloring them so that those
%   with the same index assignments in idx have the same color

% Create palette
palette = hsv(K + 1);  % c = hsv(m) 返回包含 m 种颜色的颜色图,矩阵(K+1)*3,因为是彩色图(三原色)
colors = palette(idx, :);  % 取idx所在行的颜色矩阵

% Plot the data
% scatter(x,y) :在向量 x 和 y 指定的位置创建一个包含圆形标记的散点图。
% scatter(x,y,sz,c) :在向量 x 和 y 指定的位置创建包含圆形标记的散点图,sz(size):圆形标记大小,c(color):标记颜色
scatter(X(:,1), X(:,2), 15, colors);

end
3. linspace:生成线性间距向量
y = linspace(-5,5); % 创建一个由区间 [-5,5] 中的 100 个等间距点组成的向量。
y1 = linspace(-5,5,7) ; % 创建一个由区间 [-5,5] 中的 7 个等间距点组成的向量。
4. bsxfun(fun,A,B) 对数组 A 和 B 应用函数句柄 fun 指定的按元素二元运算
例:从矩阵 A 的对应列元素中减去列均值。然后,按标准差进行归一化。
A = [1 2 10; 3 4 20; 9 6 15];
C = bsxfun(@minus, A, mean(A));
D = bsxfun(@rdivide, C, std(A))
D = 3×3

   -0.8006   -1.0000   -1.0000
   -0.3203         0    1.0000
    1.1209    1.0000         0
在 MATLAB® R2016b 及更高版本中,您可以直接使用运算符而不是 bsxfun,因为这些运算符本身支持对具有兼容大小的数组进行隐式扩展。
(A - mean(A))./std(A)
function [X_norm, mu, sigma] = featureNormalize(X)
%FEATURENORMALIZE Normalizes the features in X
%   FEATURENORMALIZE(X) returns a normalized version of X where
%   the mean value of each feature is 0 and the standard deviation
%   is 1. This is often a good preprocessing step to do when
%   working with learning algorithms.

mu = mean(X);
X_norm = bsxfun(@minus, X, mu);

sigma = std(X_norm);
X_norm = bsxfun(@rdivide, X_norm, sigma);


% ============================================================

end
5. 求和
5.1 sum
S = sum(A) :默认维度dim=1
S = sum(A,dim) :dim=1是行方向,按照每一行求和(汇总到第一行),结果是行向量;dim=2是列方向,按照每一列求和(汇总到第一列),结果是列向量
octave:85> A
A =

   1   2
   3   4
octave:83> sum(A, 1)
ans =

   4   6
octave:82> sum(A)
ans =

   4   6
octave:84> sum(A, 2)
ans =

   3
   7
5.2 矩阵+向量
octave:105> A=[1 2 3; 4 5 6]    % 2x3
A =

   1   2   3
   4   5   6

octave:106> a
a =

   0   1

octave:107> A+a
error: operator +: nonconformant arguments (op1 is 2x3, op2 is 1x2)  % A的第1列的每个元素+a的第1列,同理第2、3列(此处a需为1x3  或 跟A的维度一致)
octave:108> b
b =

   0
   1

octave:109> A+b    % A的第1行的每个元素+b的第1行,同理第2、3行
ans =

   1   2   3
   5   6   7
5.3 求距离的平方 ||x(i) − μj||^2
octave:14> A=[1 2]
A =

   1   2

octave:15> B=[2 5]
B =

   2   5

octave:16> (A(1,:) - B(1,:)).^2
ans =

   1   9

octave:17> sum((A(1,:) - B(1,:)).^2)
ans = 10
6. 数字和矩阵运算:
如 2.^A,对矩阵里面的每个元素 求 2^A(i,j)
如2*A,对矩阵的每个元素 求2*A(i,j)
7. 矩阵和向量的转换:reshape
octave:125> A
A =

   1   2   3
   4   5   6

octave:126> A(:)  % 转换为列向量,本质就是reshape(A, M*N, 1)
ans =

   1
   4
   2
   5
   3
   6

octave:127> B=reshape(A, 6, 1)
B =

   1
   4
   2
   5
   3
   6

octave:128> reshape(B, 2, 3)   % 转换为矩阵
ans =

   1   2   3
   4   5   6
8. 元胞数组:cell array
元胞数组是一种包含名为元胞的索引数据容器的数据类型,其中的每个元胞都可以包含任意类型的数据。例如,
octave:1> B= {42, rand(5), "abcd"}
B =
{
  [1,1] = 42
  [1,2] =      %rand(5)是5*5的随机数(0-1)矩阵

     0.422789   0.220235   0.953274   0.978148   0.128346
     0.921530   0.154159   0.107819   0.088112   0.205652
     0.759998   0.347502   0.243041   0.909032   0.947611
     0.433564   0.118798   0.370793   0.339027   0.468828
     0.689062   0.534718   0.194046   0.935231   0.665819

  [1,3] = abcd
}
octave:2> size(B)
ans =

   1   3

octave:3> C = {'one', 'two', 'three';
     1, 2, 3}
C =
{
  [1,1] = one
  [2,1] = 1
  [1,2] = two
  [2,2] = 2
  [1,3] = three
  [2,3] = 3
}

octave:4> size(C)
ans =

   2   3
引用元胞数组的元素有两种方法:
- 将索引括在圆括号
()中以引用元胞子集,例如,用于定义一个数组子集。 - 将索引括在花括号
{}中以引用各个元胞中的文本、数字或其他数据。 l例如:ast = C{2,3};C{2,3} = 300 300赋值给C{2,3}; [r1c1, r2c1, r1c2, r2c2] = C{1:2,1:2}- 您可以使用花括号进行索引来访问多个元胞的内容。MATLAB® 会以逗号分隔的列表形式返回这些元胞的内容。因为每个元胞可以包含不同类型的数据,所以无法将此列表分配给单个变量。但是,您可以将此列表分配给与元胞数量相同的变量。MATLAB® 将按列顺序赋给变量。
将 C 的四个元胞的内容赋给四个变量。
[r1c1, r2c1, r1c2, r2c2] = C{1:2,1:2}
- 您可以使用花括号进行索引来访问多个元胞的内容。MATLAB® 会以逗号分隔的列表形式返回这些元胞的内容。因为每个元胞可以包含不同类型的数据,所以无法将此列表分配给单个变量。但是,您可以将此列表分配给与元胞数量相同的变量。MATLAB® 将按列顺序赋给变量。
圆括号中的元胞数组索引引用元胞集。例如,要创建一个属于 C 的子集的 2×2 元胞数组,请使用圆括号。
upperLeft = C(1:2,1:2)
upperLeft=2×2 cell array
    {'one'}    {'two'}
    {[  1]}    {[  2]}
通过将元胞集替换为相同数量的元胞来更新这些元胞集。例如,将 C 的第一行中的元胞替换为大小相等 (1×3) 的元胞数组。
C(1,1:3) = {'first','second','third'}
C=2×3 cell array
    {'first'}    {'second'}    {'third'}
    {[    1]}    {[     2]}    {[    3]}
9. find
- k = find(X) 返回一个包含数组 X 中每个非零元素的线性索引的向量。
- ——如果 X 为向量,则 find 返回方向与 X 相同的向量。
- ——如果 X 为多维数组,则 find 返回由结果的线性索引组成的列向量。
- k = find(逻辑表达式):同上,满足逻辑表达式的
octave:27> idx
idx =

   2
   3

octave:28> find(idx==3)  % 直接idx,则是返回非0元素
ans = 2
octave:29> A=[ 1 3 ; 3 4]
A =

   1   3
   3   4

octave:31> find(A==3)
ans =

   2
   3
octave:32> find(A>1)
ans =

   2
   3
   4
10. 等于(==),不等于(~=)
function centroids = computeCentroids(X, idx, K)   % 计算聚类中心
%COMPUTECENTROIDS returns the new centroids by computing the means of the
%data points assigned to each centroid.
%   centroids = COMPUTECENTROIDS(X, idx, K) returns the new centroids by
%   computing the means of the data points assigned to each centroid. It is
%   given a dataset X where each row is a single data point, a vector
%   idx of centroid assignments (i.e. each entry in range [1..K]) for each
%   example, and K, the number of centroids. You should return a matrix
%   centroids, where each row of centroids is the mean of the data points
%   assigned to it.
%


% Useful variables
[m n] = size(X);

% You need to return the following variables correctly.
centroids = zeros(K, n);


% ====================== YOUR CODE HERE ======================
% Instructions: Go over every centroid and compute mean of all points that
%               belong to it. Concretely, the row vector centroids(i, :)
%               should contain the mean of the data points assigned to
%               centroid i.
%
% Note: You can use a for-loop over the centroids to compute this.
%


for i = 1: K
   s = sum(idx == i);
   if (s ~= 0)  % 不等于
       centroids(i, :) = mean(X(find(idx == i), :))
   else
       centroids(i, :) = zeros(1, n);
   end
end


% =============================================================


end
11. randperm 整数的随机排列
p = randperm( 返回行向量,其中包含从 1 到 n)n 没有重复元素的整数随机排列。
p = randperm( 返回行向量,其中包含在 1 到 n,k)n 之间随机选择的 k 个唯一整数。
X = rand( 返回一个由均匀分布的 (0,1)之间 随机数组成的 n)n×n 矩阵。
X = rand(m, 返回一个由均匀分布的 (0,1)之间 随机数组成的 m×n)n 矩阵。
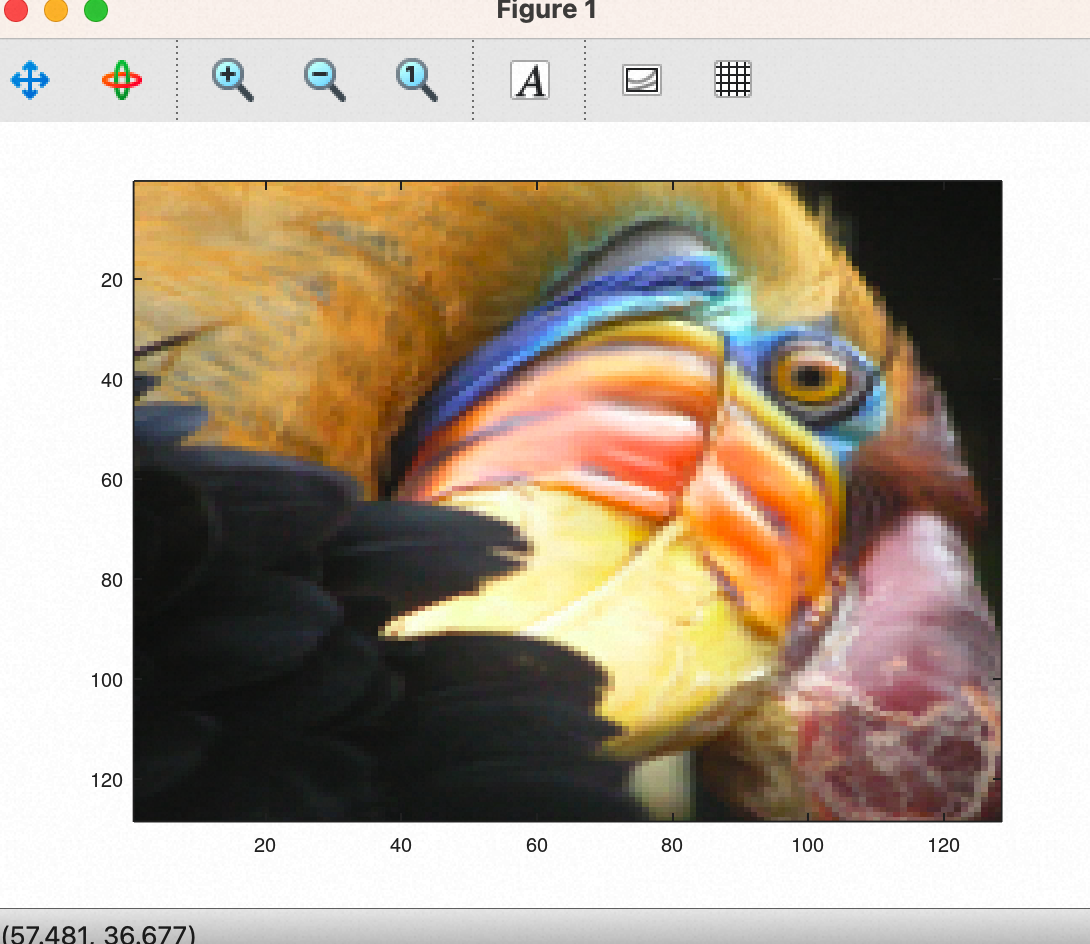
12. 读取图像imread('xxx.img'),显示图像imagesc(C)
%  Load an image of a bird
A = double(imread('bird_small.png'));   % A:128*128*3,彩色图片三元组

A = A / 255; % Divide by 255 so that all values are in the range 0 - 1;不做这一步,下一步的imagesc(A)展示不出来??

imagesc(A) % 将数组 A 中的数据显示为一个图像


【推荐】国内首个AI IDE,深度理解中文开发场景,立即下载体验Trae
【推荐】编程新体验,更懂你的AI,立即体验豆包MarsCode编程助手
【推荐】抖音旗下AI助手豆包,你的智能百科全书,全免费不限次数
【推荐】轻量又高性能的 SSH 工具 IShell:AI 加持,快人一步
· 无需6万激活码!GitHub神秘组织3小时极速复刻Manus,手把手教你使用OpenManus搭建本
· C#/.NET/.NET Core优秀项目和框架2025年2月简报
· 葡萄城 AI 搜索升级:DeepSeek 加持,客户体验更智能
· 什么是nginx的强缓存和协商缓存
· 一文读懂知识蒸馏