使用Python 和matlab 进行AR模型的仿真(自回归模型)
"""对钙信号的动力学进行建模,AR模型。"""
import matplotlib.pyplot as plt
import numpy as np
if __name__ == '__main__':
length = 500
time = range(length)
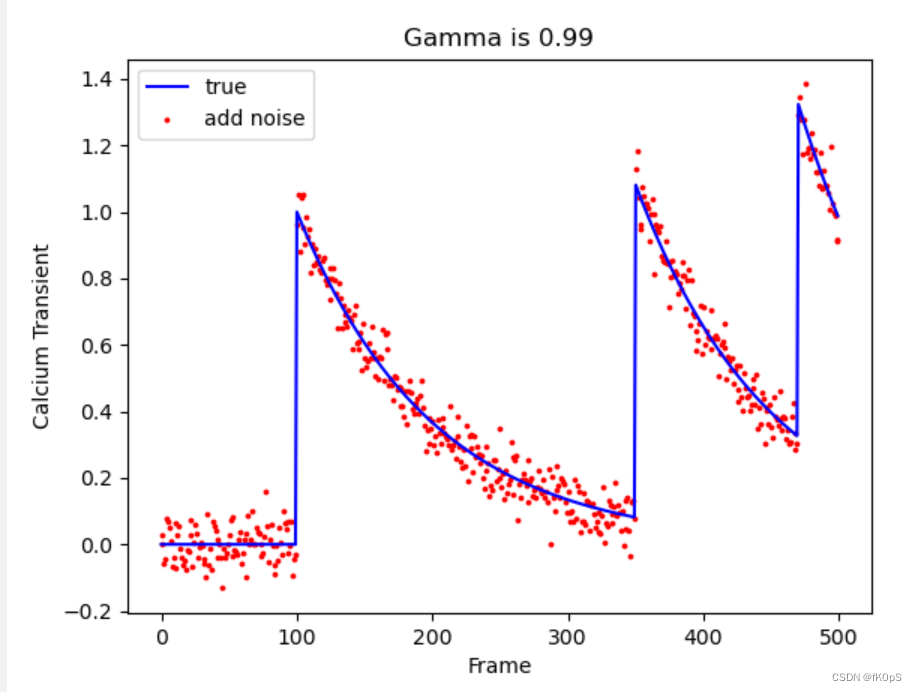
gamma = 0.99
c0 = 1
# st = np.random.poisson(lam=10, size=length).astype(float)*0.01
st = np.random.normal(loc=0.0, scale=1.0, size=length)*0.05
ct=np.zeros(shape = length)
ctn=np.zeros(shape = length)
spikes = [100, 350, 470]
spikeAmplitude = 1
#自回归模型
for i in range(1, length):
if i in spikes:
ct[i] = gamma*ct[i-1] + spikeAmplitude
else:
ct[i] = gamma*ct[i-1]
ctn[i] = ct[i]+ st[i]
print(ct[i])
fig,ax = plt.subplots()
ax.plot(time, ct, color = 'b', label = 'true')
ax.scatter(time, ctn, color = 'r',s=3, label = 'add noise')
ax.set_xlabel('Frame')
ax.set_ylabel('Calcium Transient')
plt.title('Gamma is {}'.format(gamma))
plt.legend(loc = "best")
fig.show()
--------------------
matalb
len = 500;
gamma = 0.98;% 0.99,200帧;
spikes = [100];
c0 = 1;
ct = zeros(1,len,'double');
ctn = ct;% noise
spikeAmplitude = 2;
mu = 0;sigma = 1;
st = normrnd(mu, sigma, 1, len) .* 0.05;
for i = 2:len
% do something
if ismember(i,spikes)
ct(1,i) = gamma*ct(1,i-1) + spikeAmplitude;
else
ct(1,i) = gamma*ct(1,i-1);
end
ctn(1,i) = ct(1,i)+ st(1,i);
end
figure;
plot(ct);hold on;
plot(ctn);

 浙公网安备 33010602011771号