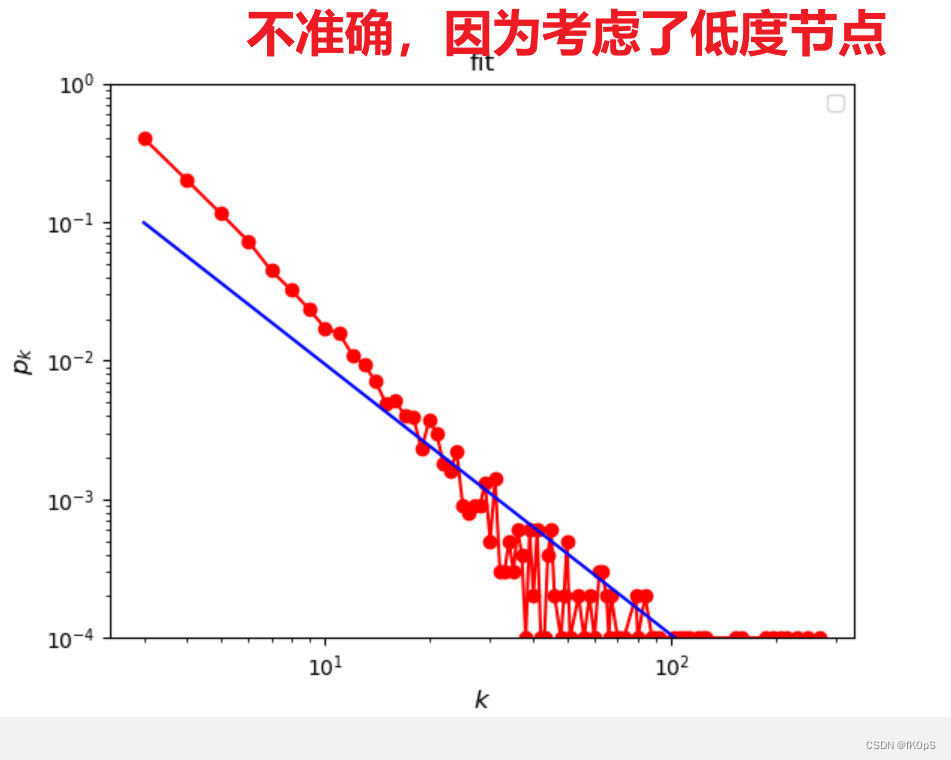
如何拟合幂率分布的幂率
from scipy import optimize
import numpy as np

#定义需要拟合的函数
def fit_line(x, a, b):
    return a*x + b

k, pk = get_dgreeDistr(BA)

kmin = np.min(k)
kmax = np.max(k)

x = np.log10(np.array(k))
y = np.log10(np.array(pk))

# 确定拟合的参数
a, b = optimize.curve_fit(fit_line, x, y)[0]

#有了拟合后的直线后,构造一条直线;
x1 = np.arange(kmin, kmax,0.1)
y1 = (10 ** b) * (x1 ** a)

fig, ax = plt.subplots()
ax.plot(k, pk, 'ro-')
ax.plot(x1, y1, 'b-')
ax.set_xlabel('$k$', fontsize='large')
ax.set_ylabel('$p_k$', fontsize='large')
ax.set_ylim(1e-4,1)
ax.set_xscale("log")
ax.set_yscale("log")
ax.legend(loc="best")
ax.set_title("fit")
fig.show()
------------------------
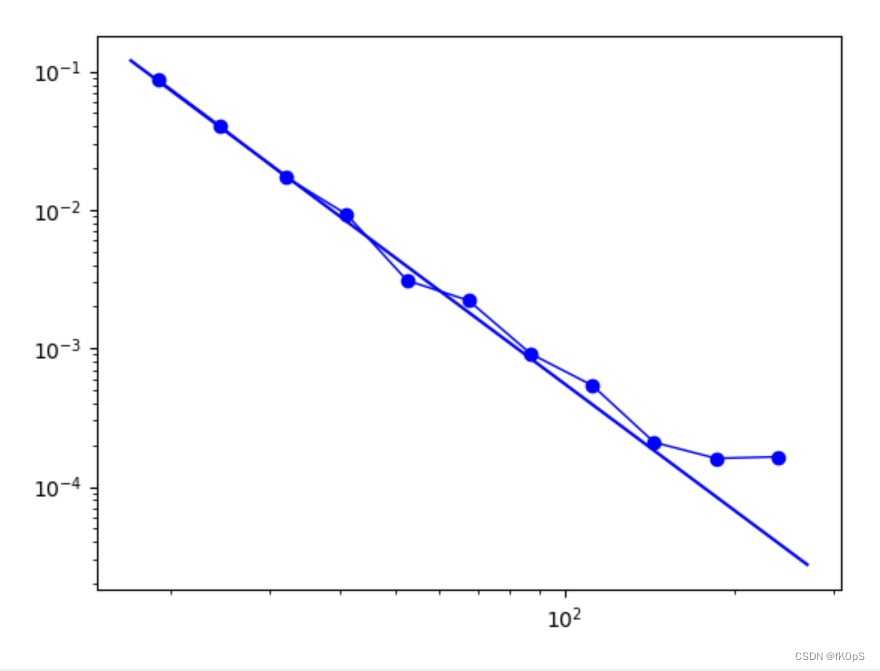
如何“精确地”估计幂率分布的幂率:

pip install powerlaw

import powerlaw
data = [BA.degree(i) for i in BA.nodes()]
print(max(data))

fit = powerlaw.Fit(data)
kmin = fit.power_law.xmin
alpha = fit.power_law.alpha
D = fit.power_law.D
print("kmin is {}".format(kmin))
print("gamma is {}".format(alpha))
print("kmin is {}".format(D))

fig, ax = plt.subplots()
ax = fit.plot_pdf(marker='o', color='b', linewidth=1)
fit.power_law.plot_pdf(color='b', linestyle='-',ax=ax)
fig.show()
准确,因为只考虑了多度节点

 浙公网安备 33010602011771号