Pyqtgraph Python 动态播放多条trace,滚动播放
Python 动态播放多条trace,滚动播放
1、参考:
# -*- coding: utf-8 -*-
"""
Various methods of drawing scrolling plots.
"""
import initExample ## Add path to library (just for examples; you do not need this)

import pyqtgraph as pg
from pyqtgraph.Qt import QtCore, QtGui
import numpy as np

win = pg.GraphicsLayoutWidget(show=True)
win.setWindowTitle('pyqtgraph example: Scrolling Plots')


# 1) Simplest approach -- update data in the array such that plot appears to scroll
#    In these examples, the array size is fixed.
p1 = win.addPlot()
p2 = win.addPlot()
data1 = np.random.normal(size=300)
curve1 = p1.plot(data1)
curve2 = p2.plot(data1)
ptr1 = 0
def update1():
    global data1, ptr1
    data1[:-1] = data1[1:]  # shift data in the array one sample left
                            # (see also: np.roll)
    data1[-1] = np.random.normal()
    curve1.setData(data1)

    ptr1 += 1
    curve2.setData(data1)
    curve2.setPos(ptr1, 0)


# 2) Allow data to accumulate. In these examples, the array doubles in length
#    whenever it is full.
win.nextRow()
p3 = win.addPlot()
p4 = win.addPlot()
# Use automatic downsampling and clipping to reduce the drawing load
p3.setDownsampling(mode='peak')
p4.setDownsampling(mode='peak')
p3.setClipToView(True)
p4.setClipToView(True)
p3.setRange(xRange=[-100, 0])
p3.setLimits(xMax=0)
curve3 = p3.plot()
curve4 = p4.plot()

data3 = np.empty(100)
ptr3 = 0

def update2():
    global data3, ptr3
    data3[ptr3] = np.random.normal()
    ptr3 += 1
    if ptr3 >= data3.shape[0]:
        tmp = data3
        data3 = np.empty(data3.shape[0] * 2)
        data3[:tmp.shape[0]] = tmp
    curve3.setData(data3[:ptr3])
    curve3.setPos(-ptr3, 0)
    curve4.setData(data3[:ptr3])


# 3) Plot in chunks, adding one new plot curve for every 100 samples
chunkSize = 100
# Remove chunks after we have 10
maxChunks = 10
startTime = pg.ptime.time()
win.nextRow()
p5 = win.addPlot(colspan=2)
p5.setLabel('bottom', 'Time', 's')
p5.setXRange(-10, 0)
curves = []
data5 = np.empty((chunkSize+1,2))
ptr5 = 0

def update3():
    global p5, data5, ptr5, curves
    now = pg.ptime.time()
    for c in curves:
        c.setPos(-(now-startTime), 0)

    i = ptr5 % chunkSize
    if i == 0:
        curve = p5.plot()
        curves.append(curve)
        last = data5[-1]
        data5 = np.empty((chunkSize+1,2))
        data5[0] = last
        while len(curves) > maxChunks:
            c = curves.pop(0)
            p5.removeItem(c)
    else:
        curve = curves[-1]
    data5[i+1,0] = now - startTime
    data5[i+1,1] = np.random.normal()
    curve.setData(x=data5[:i+2, 0], y=data5[:i+2, 1])
    ptr5 += 1


# update all plots
def update():
    update1()
    update2()
    update3()

timer = pg.QtCore.QTimer()
timer.timeout.connect(update)
timer.start(50)


## Start Qt event loop unless running in interactive mode or using pyside.
if __name__ == '__main__':
    import sys
    if (sys.flags.interactive != 1) or not hasattr(QtCore, 'PYQT_VERSION'):
        QtGui.QApplication.instance().exec_()
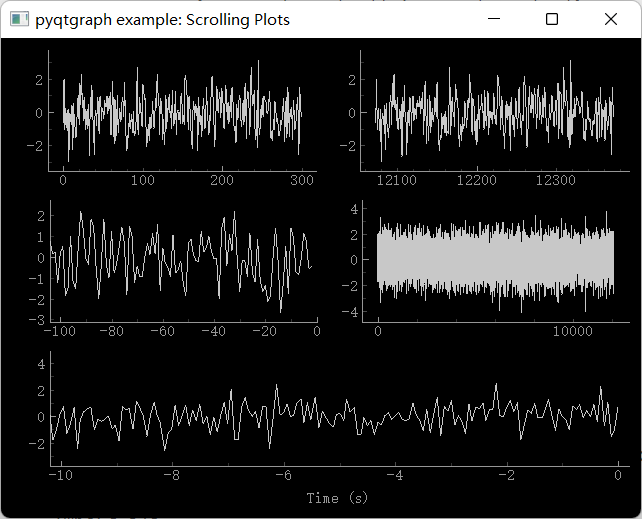
效果如下:

2、第二,参考:
#!/usr/bin/python
# -*- coding: utf-8 -*-
"""
Test the speed of rapidly updating multiple plot curves
"""

## Add path to library (just for examples; you do not need this)
import initExample


from pyqtgraph.Qt import QtGui, QtCore
import numpy as np
import pyqtgraph as pg
from pyqtgraph.ptime import time
app = QtGui.QApplication([])

plot = pg.plot()
plot.setWindowTitle('pyqtgraph example: MultiPlotSpeedTest')
plot.setLabel('bottom', 'Index', units='B')

nPlots = 100
nSamples = 500
curves = []
for idx in range(nPlots):
    curve = pg.PlotCurveItem(pen=(idx,nPlots*1.3))
    plot.addItem(curve)
    curve.setPos(0,idx*6)
    curves.append(curve)

plot.setYRange(0, nPlots*6)
plot.setXRange(0, nSamples)
plot.resize(600,900)

rgn = pg.LinearRegionItem([nSamples/5.,nSamples/3.])
plot.addItem(rgn)


data = np.random.normal(size=(nPlots*23,nSamples))
ptr = 0
lastTime = time()
fps = None
count = 0
def update():
    global curve, data, ptr, plot, lastTime, fps, nPlots, count
    count += 1

    for i in range(nPlots):
        curves[i].setData(data[(ptr+i)%data.shape[0]])

    ptr += nPlots
    now = time()
    dt = now - lastTime
    lastTime = now
    if fps is None:
        fps = 1.0/dt
    else:
        s = np.clip(dt*3., 0, 1)
        fps = fps * (1-s) + (1.0/dt) * s
    plot.setTitle('%0.2f fps' % fps)
    #app.processEvents()  ## force complete redraw for every plot
timer = QtCore.QTimer()
timer.timeout.connect(update)
timer.start(0)

## Start Qt event loop unless running in interactive mode.
if __name__ == '__main__':
    import sys
    if (sys.flags.interactive != 1) or not hasattr(QtCore, 'PYQT_VERSION'):
        QtGui.QApplication.instance().exec_()
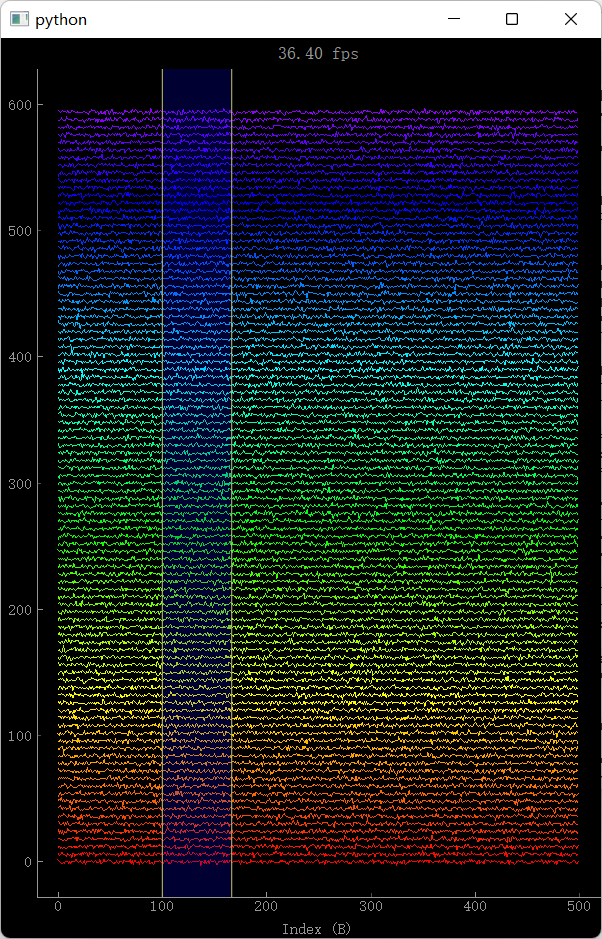
效果如下:

300条Trace也是可以同步展示的,但是fps只有15
plot = pg.plot()是一个什么对象啊?pg.plot() 和pg.PlotWidget()有什么区别?两者有什么区别?
官方解释如下:
pyqtgraph.plot(args*, *kargs*)[source]
Create and return a PlotWidget Accepts a title argument to set the title of the window. All other arguments are used to plot data. (see PlotItem.plot())


【推荐】国内首个AI IDE,深度理解中文开发场景,立即下载体验Trae
【推荐】编程新体验,更懂你的AI,立即体验豆包MarsCode编程助手
【推荐】抖音旗下AI助手豆包,你的智能百科全书,全免费不限次数
【推荐】轻量又高性能的 SSH 工具 IShell:AI 加持,快人一步
· TypeScript + Deepseek 打造卜卦网站:技术与玄学的结合
· Manus的开源复刻OpenManus初探
· AI 智能体引爆开源社区「GitHub 热点速览」
· 三行代码完成国际化适配,妙~啊~
· .NET Core 中如何实现缓存的预热?