
Pyqtgraph,如何在绘制trace时让颜色发生变化。获取plot的时候,请把pen参数也给加上;
Pyqtgraph,如何在绘制trace时让颜色发生变化。获取plot的时候,请把pen参数也给加上;
PlotWidget 颜色、self.TNLPlotWidget.plot(pen=[0, 255, 0])
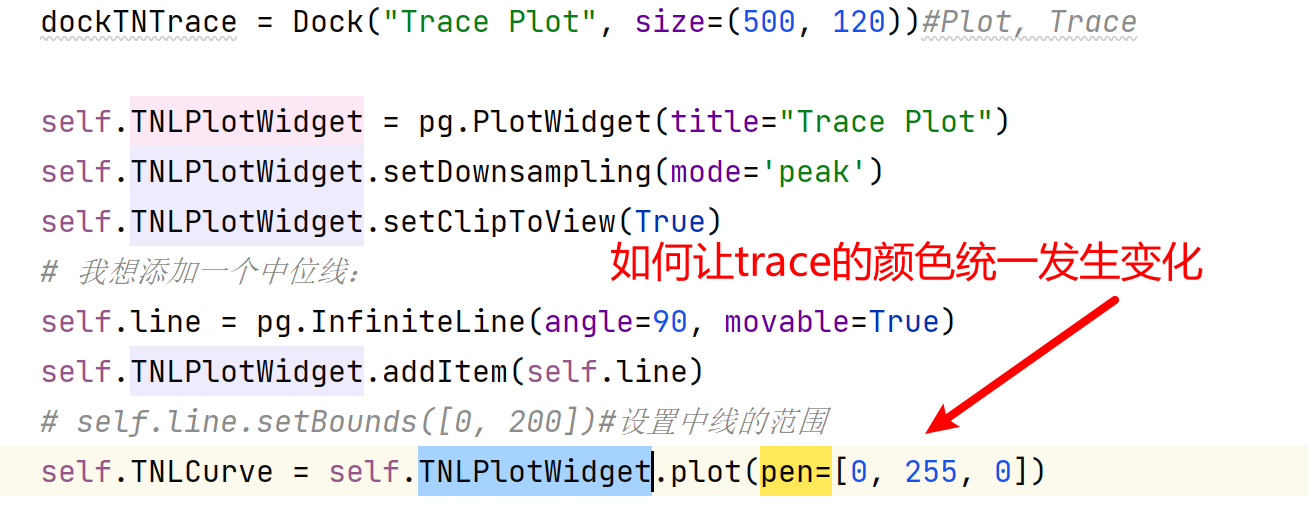
默认的话,是灰色;
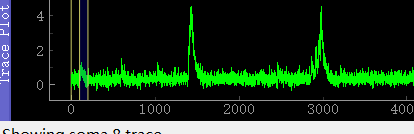
效果如下:
https://pyqtgraph.readthedocs.io/en/latest/api_reference/functions.html#pyqtgraph.mkPen
https://pyqtgraph.readthedocs.io/en/latest/api_reference/functions.html#pyqtgraph.mkColor
https://pyqtgraph.readthedocs.io/en/latest/api_reference/functions.html#pyqtgraph.intColor
通过以上的三个连接,彻底搞懂pyqtgraph里边的颜色系统


【推荐】国内首个AI IDE,深度理解中文开发场景,立即下载体验Trae
【推荐】编程新体验,更懂你的AI,立即体验豆包MarsCode编程助手
【推荐】抖音旗下AI助手豆包,你的智能百科全书,全免费不限次数
【推荐】轻量又高性能的 SSH 工具 IShell:AI 加持,快人一步
· TypeScript + Deepseek 打造卜卦网站:技术与玄学的结合
· Manus的开源复刻OpenManus初探
· AI 智能体引爆开源社区「GitHub 热点速览」
· 三行代码完成国际化适配,妙~啊~
· .NET Core 中如何实现缓存的预热?