
Python 如何绘制线图?
Python 如何绘制线图?
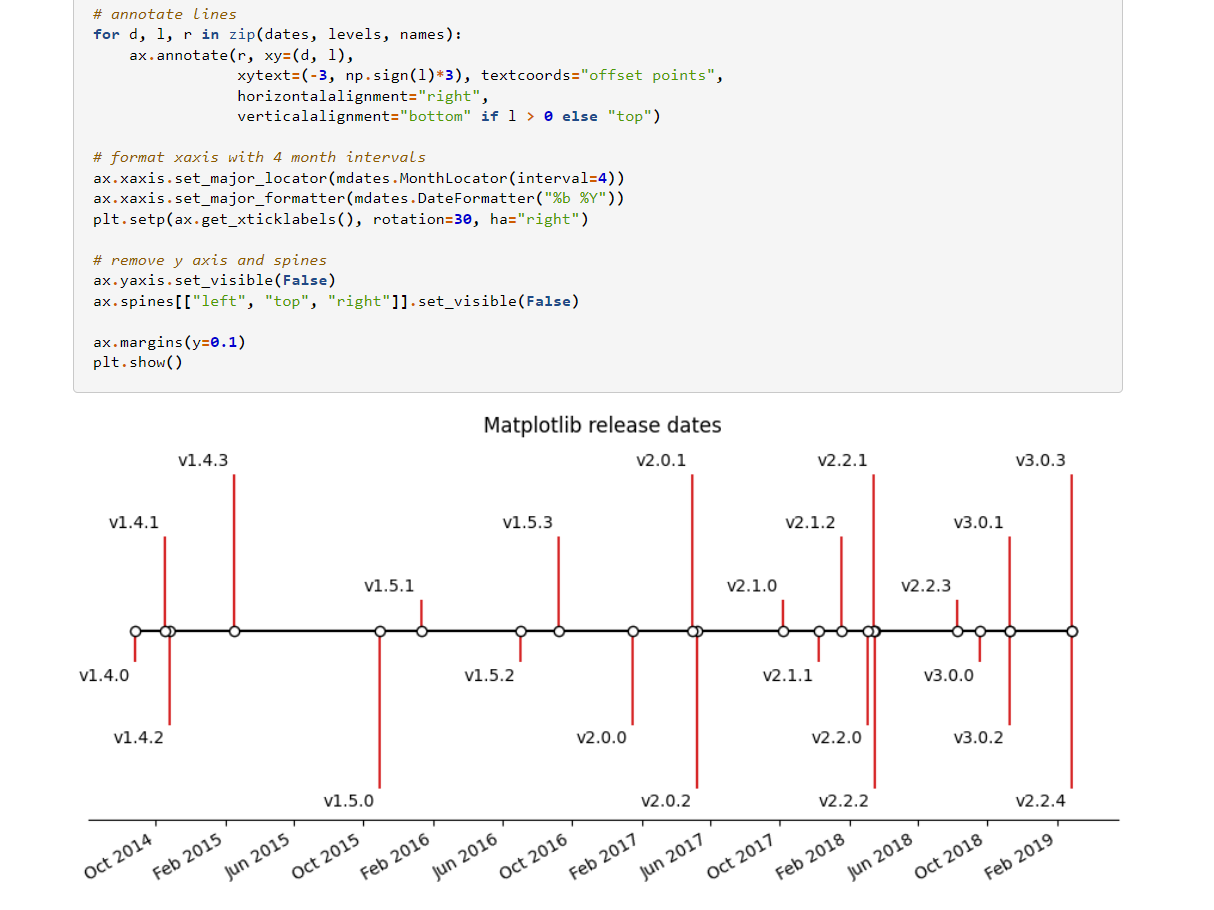
Creating a timeline with lines, dates, and text:
链接如下:
https://matplotlib.org/stable/gallery/lines_bars_and_markers/timeline.html
# Choose some nice levels
levels = np.tile([-5, 5, -3, 3, -1, 1],
                 int(np.ceil(len(dates)/6)))[:len(dates)]

# Create figure and plot a stem plot with the date
fig, ax = plt.subplots(figsize=(8.8, 4), constrained_layout=True)
ax.set(title="Matplotlib release dates")

ax.vlines(dates, 0, levels, color="tab:red")  # The vertical stems.
ax.plot(dates, np.zeros_like(dates), "-o",
        color="k", markerfacecolor="w")  # Baseline and markers on it.

# annotate lines
for d, l, r in zip(dates, levels, names):
    ax.annotate(r, xy=(d, l),
                xytext=(-3, np.sign(l)*3), textcoords="offset points",
                horizontalalignment="right",
                verticalalignment="bottom" if l > 0 else "top")

# format xaxis with 4 month intervals
ax.xaxis.set_major_locator(mdates.MonthLocator(interval=4))
ax.xaxis.set_major_formatter(mdates.DateFormatter("%b %Y"))
plt.setp(ax.get_xticklabels(), rotation=30, ha="right")

# remove y axis and spines
ax.yaxis.set_visible(False)
ax.spines[["left", "top", "right"]].set_visible(False)

ax.margins(y=0.1)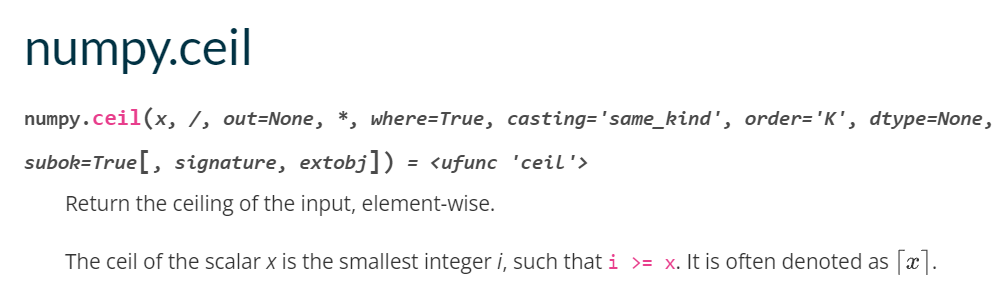
plt.show()代码解析,np.ceil 是什么功能?
返回,大于x的最小整数,向上取整;
# 绘制垂直的直线;
ax.vlines(dates, 0, levels, color="tab:red")  # The vertical stems.

# 绘制水平线;
ax.plot(dates, np.zeros_like(dates), "-o",
        color="k", markerfacecolor="w")  # Baseline and markers on it.

【推荐】国内首个AI IDE,深度理解中文开发场景,立即下载体验Trae
【推荐】编程新体验,更懂你的AI,立即体验豆包MarsCode编程助手
【推荐】抖音旗下AI助手豆包,你的智能百科全书,全免费不限次数
【推荐】轻量又高性能的 SSH 工具 IShell:AI 加持,快人一步
· TypeScript + Deepseek 打造卜卦网站:技术与玄学的结合
· Manus的开源复刻OpenManus初探
· AI 智能体引爆开源社区「GitHub 热点速览」
· 三行代码完成国际化适配,妙~啊~
· .NET Core 中如何实现缓存的预热?