<!DOCTYPE html>
<html>
<head>
<meta charset="utf-8">
<title>table模块快速使用</title>
<link rel = "stylesheet" href = "./layui/css/layui.css">
</head>
<body>
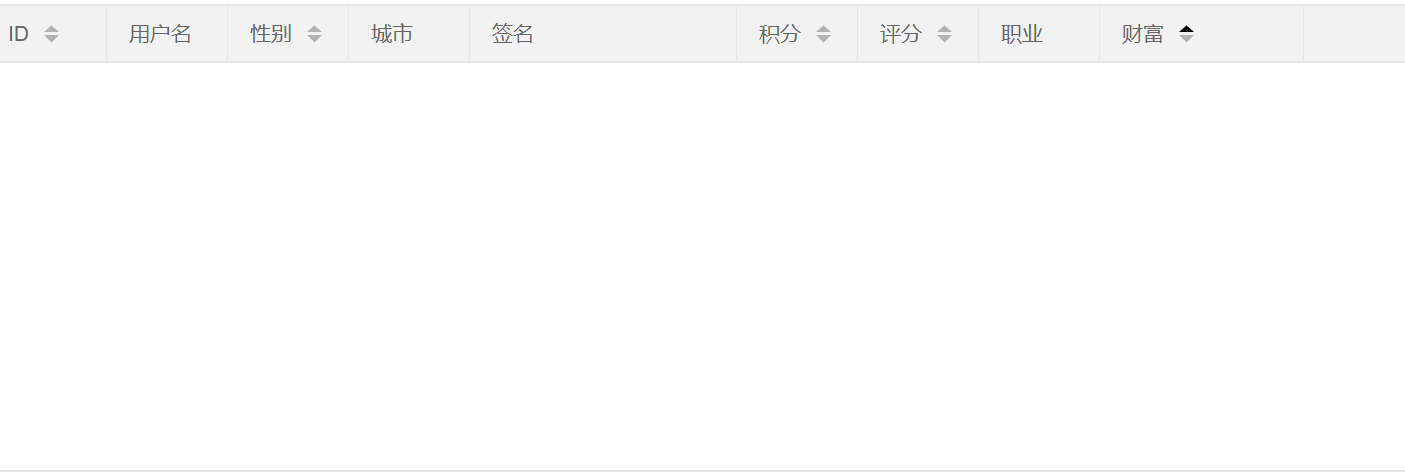
<table id="demo" lay-filter="test"></table>
<script type="text/javascript" src="./layui/layui.js"></script>
<script>
layui.use('table', function(){
var table = layui.table;
table.render({
elem: '#demo'
,height: 312
,url: '/demo/table/user/'
,page: true
,cols: [[
{field: 'id', title: 'ID', width:80, sort: true, fixed: 'left'}
,{field: 'username', title: '用户名', width:80}
,{field: 'sex', title: '性别', width:80, sort: true}
,{field: 'city', title: '城市', width:80}
,{field: 'sign', title: '签名', width: 177}
,{field: 'experience', title: '积分', width: 80, sort: true}
,{field: 'score', title: '评分', width: 80, sort: true}
,{field: 'classify', title: '职业', width: 80}
,{field: 'wealth', title: '财富', width: 135, sort: true}
]]
});
});
</script>
</body>
</html>


【推荐】国内首个AI IDE,深度理解中文开发场景,立即下载体验Trae
【推荐】编程新体验,更懂你的AI,立即体验豆包MarsCode编程助手
【推荐】抖音旗下AI助手豆包,你的智能百科全书,全免费不限次数
【推荐】轻量又高性能的 SSH 工具 IShell:AI 加持,快人一步
· .NET Core 中如何实现缓存的预热?
· 从 HTTP 原因短语缺失研究 HTTP/2 和 HTTP/3 的设计差异
· AI与.NET技术实操系列:向量存储与相似性搜索在 .NET 中的实现
· 基于Microsoft.Extensions.AI核心库实现RAG应用
· Linux系列:如何用heaptrack跟踪.NET程序的非托管内存泄露
· TypeScript + Deepseek 打造卜卦网站:技术与玄学的结合
· Manus的开源复刻OpenManus初探
· AI 智能体引爆开源社区「GitHub 热点速览」
· 三行代码完成国际化适配,妙~啊~
· .NET Core 中如何实现缓存的预热?