


Flutter性能检测工具介绍
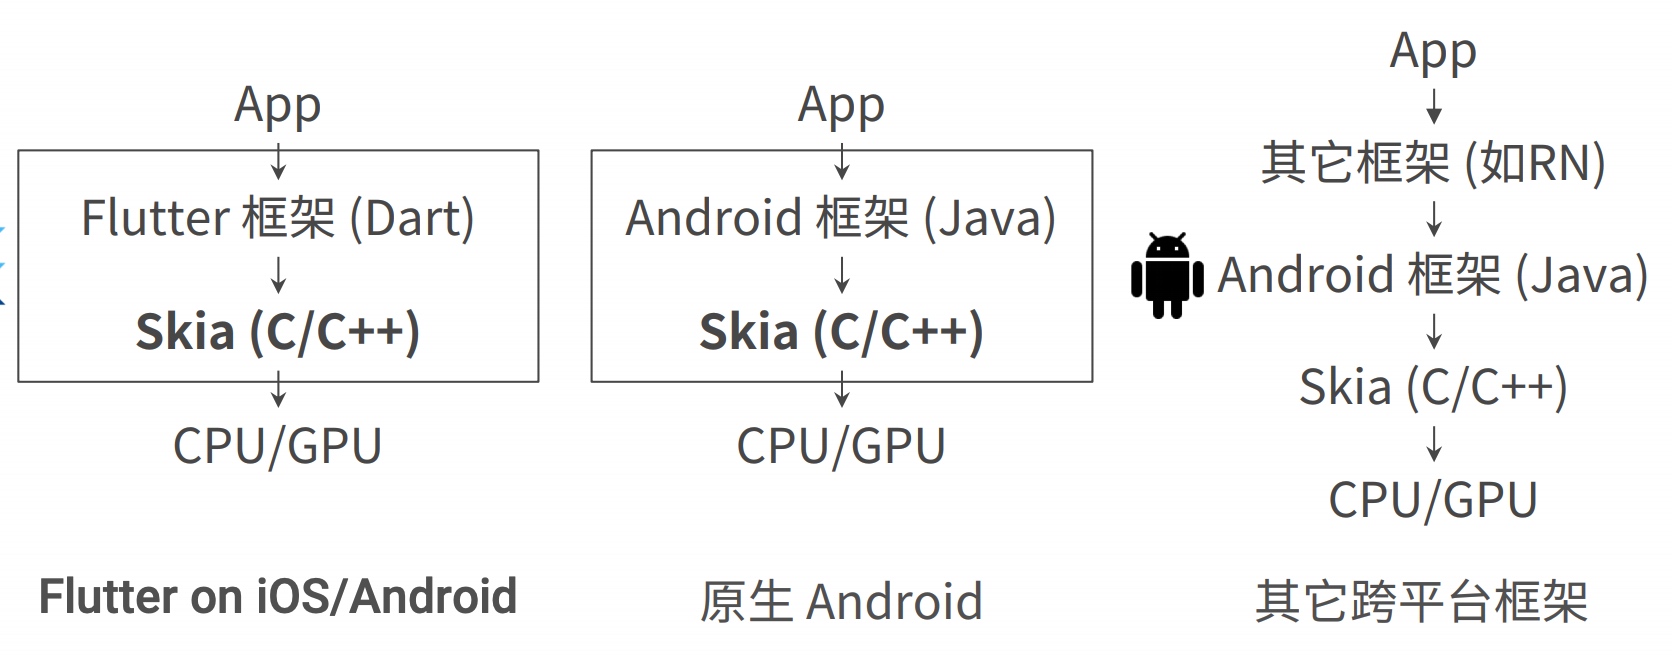
Flutter的widget渲染正常情况下一般可以达到60fps以上,作为跨平台语言为甚么有如此优势?
- 它基于Skia引擎直接绘制
- Skia经过Google团队优化后,性能明显提升,如抗锯齿能力就得到了很好的改善
但这并不意味着怎么写都可以达到这个水平,实际开发时需要综合考虑各方面的因数,如业务逻辑臃肿导致
WidgetTree庞大,不够合理的状态刷新导致大两部必要的Widget被重新构建,各种插件的注册和通信没能很好的处理,UI线程的大量IO读写,等等这些都会给项目带来致命的缺陷,最终引发出的问题就是页面卡顿,卡死,严重影响用户体验。
Flutter性能问题主要集中在GPU线程和UI线程,需要对图层的构建,在了解如何使用Flutter性能检测工具之前我们需要对它的运行模式有写基本的了解,Flutter提供了Observatory用于检测app性能指标.
Flutter性能检测工具-Observatory
observatory: 在
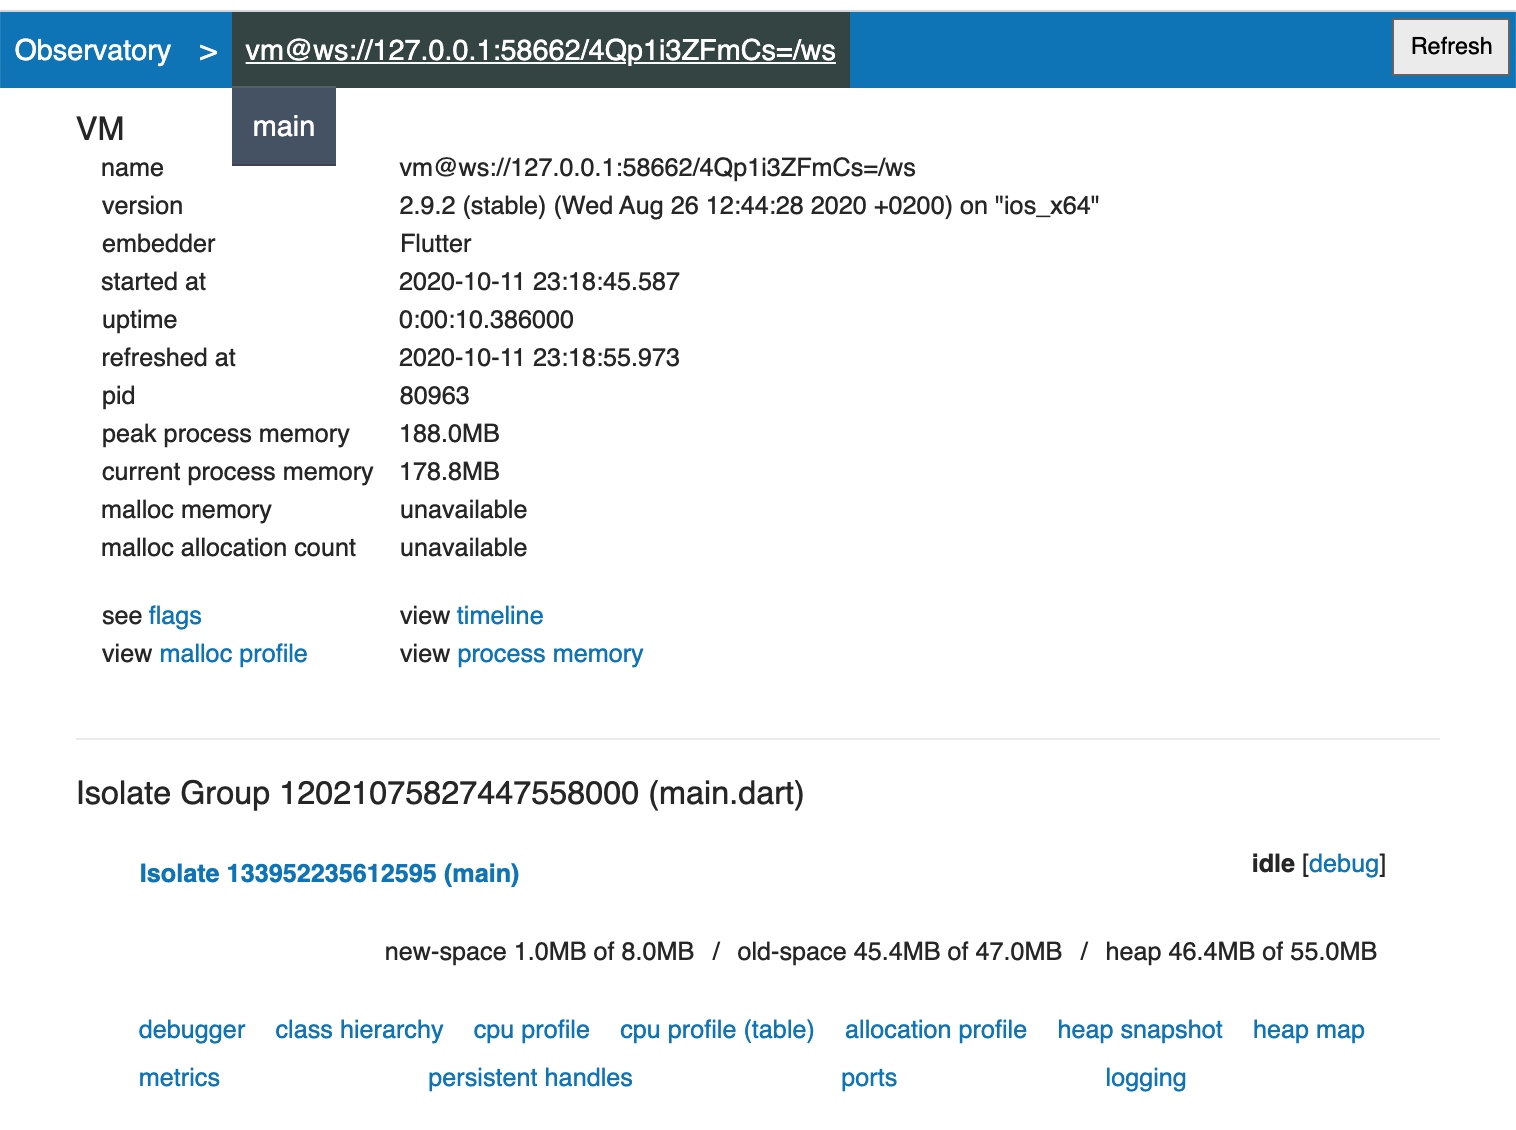
engine/shell/testings/observatory可以找到它的具体实现,它开启了一个ServiceClient,用于获取dartvm运行状态.flutter app启动的时候会生成一个当前的observatory服务器的地址An Observatory debugger and profiler on iPhone SE (2nd generation) is available at: http://127.0.0.1:58662/4Qp1i3ZFmCs=/在浏览器中打开,可以看到这个功能图
Observatory-Debugger
debugger: 有一个debug控制台,需要通过命令去控制,主要是对堆栈的操作和isolate,vm状态的管理
List of commands:
break        - Add a breakpoint by source location or function name (hotkey: [F8])

clear        - Remove a breakpoint by source location or function name (hotkey: [F8])

cls          - Clear the console

continue, c  - Resume execution of the isolate (hotkey: [F7])

delete       - Remove a breakpoint by breakpoint id

down         - Move down one or more frames (hotkey: [Page Down])

finish       - Continue running the isolate until the current function exits

frame, f     - Set the current frame

help         - List commands or provide details about a specific command

info         - Show information on a variety of topics

isolate, i   - Switch, list, rename, or reload isolates

log          - Control which log messages are displayed

next, n      - Continue running the isolate until it reaches the next source location in the current function (hotkey: [F9])

next-async   - Step over await or yield

next-sync    - Run until return/unwind to current activation.

pause        - Pause the isolate (hotkey: [Ctrl ;])

print, p     - Evaluate and print an expression in the current frame

refresh      - Refresh debugging information of various sorts

reload       - Reload the sources for the current isolate

rewind       - Rewind the stack to a previous frame

set          - Set a debugger option

step, s      - Continue running the isolate until it reaches the next source location (hotkey: [F10]

up           - Move up one or more frames (hotkey: [Page Up])

vm           - Manage a Dart virtual machine

For more information on a specific command type 'help <command>'

For a list of hotkeys type 'help hotkeys'

Command prefixes are accepted (e.g. 'h' for 'help')

Hit [TAB] to complete a command (try 'is[TAB][TAB]')

Hit [ENTER] to repeat the last command

Use up/down arrow for command history
Observatory-Class Hierarchy
包括了所有的flutter framework相关的class继承关系
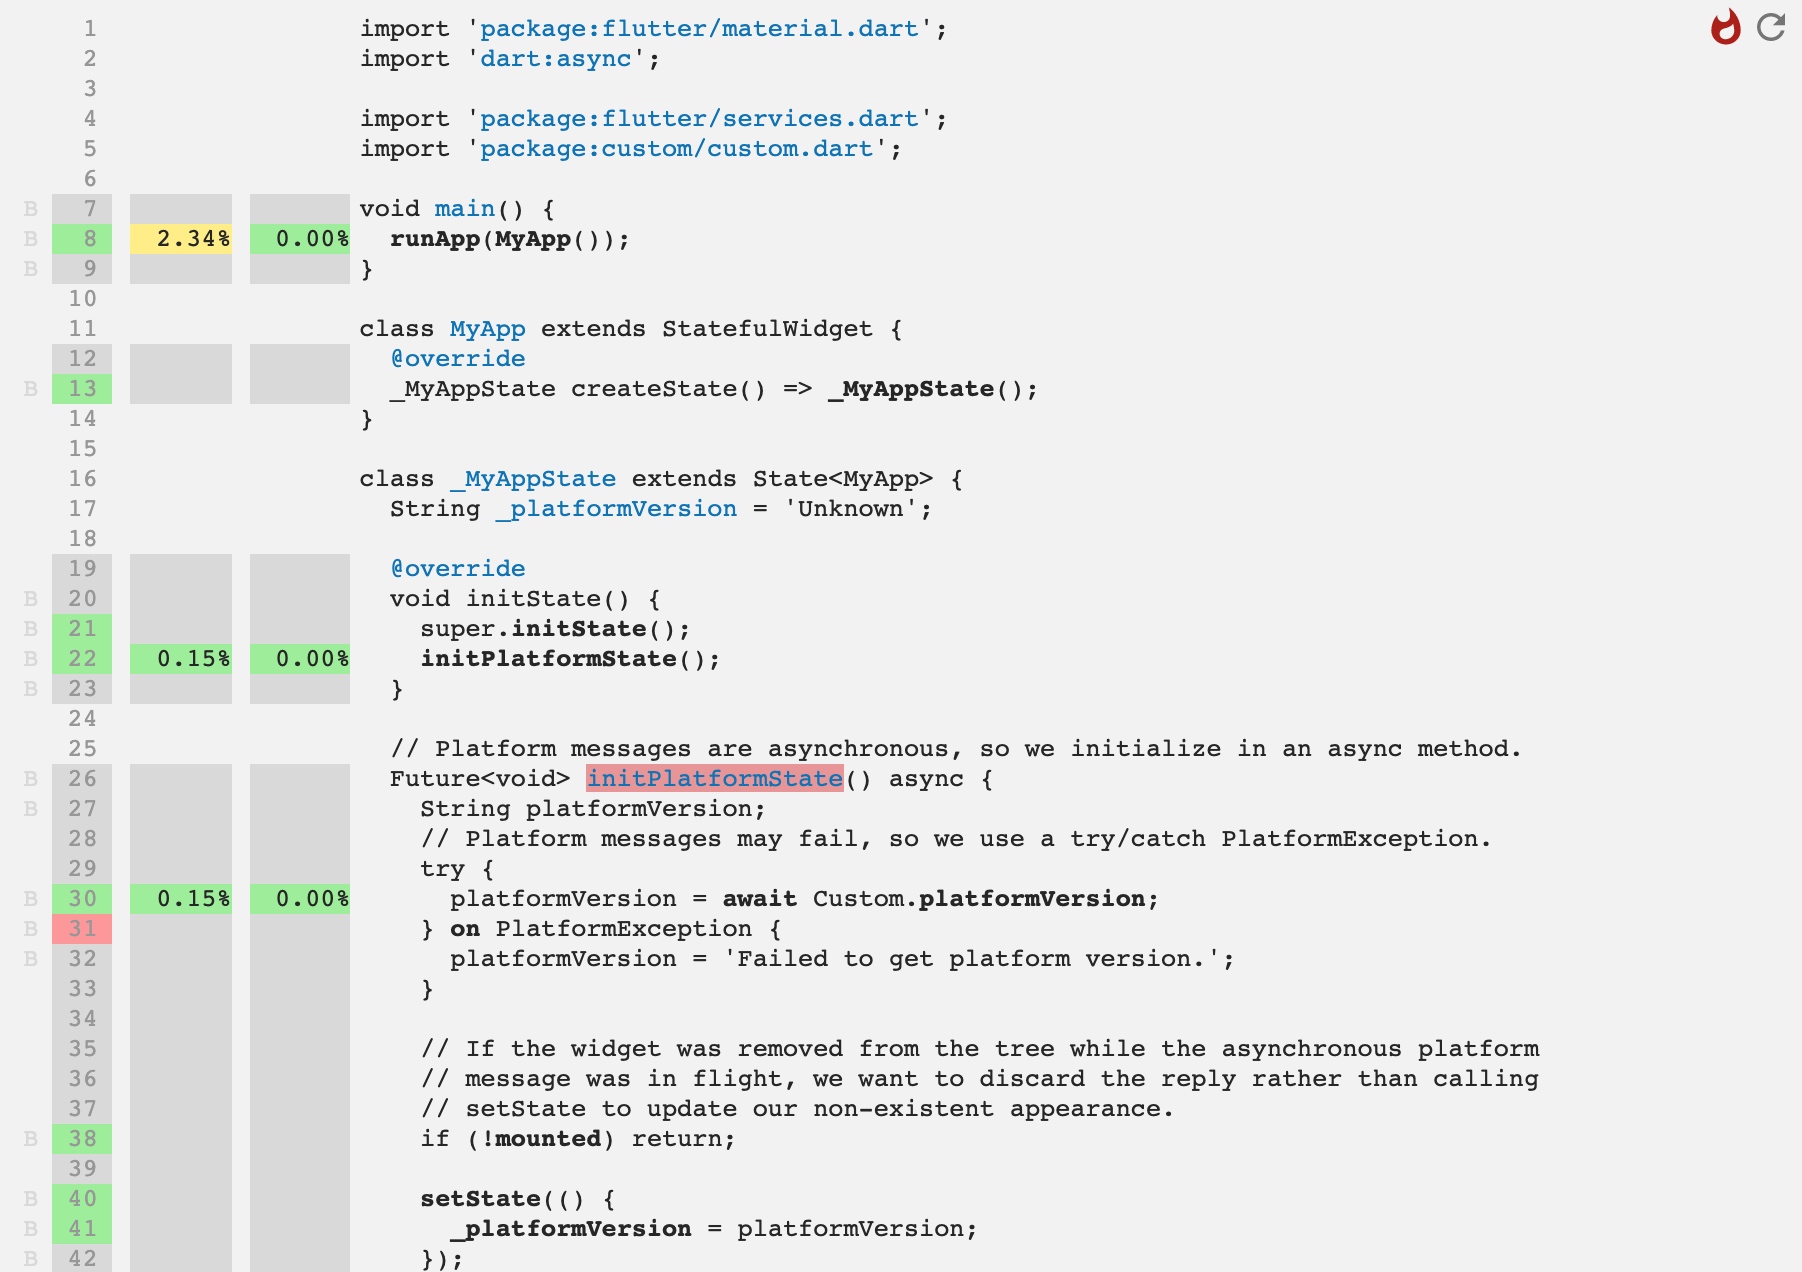
Observatory-cup profile(table)
- cup profile: 查看当前cpu的使用率,详细列出了每个堆栈占用的大小,支持关键字过滤搜索
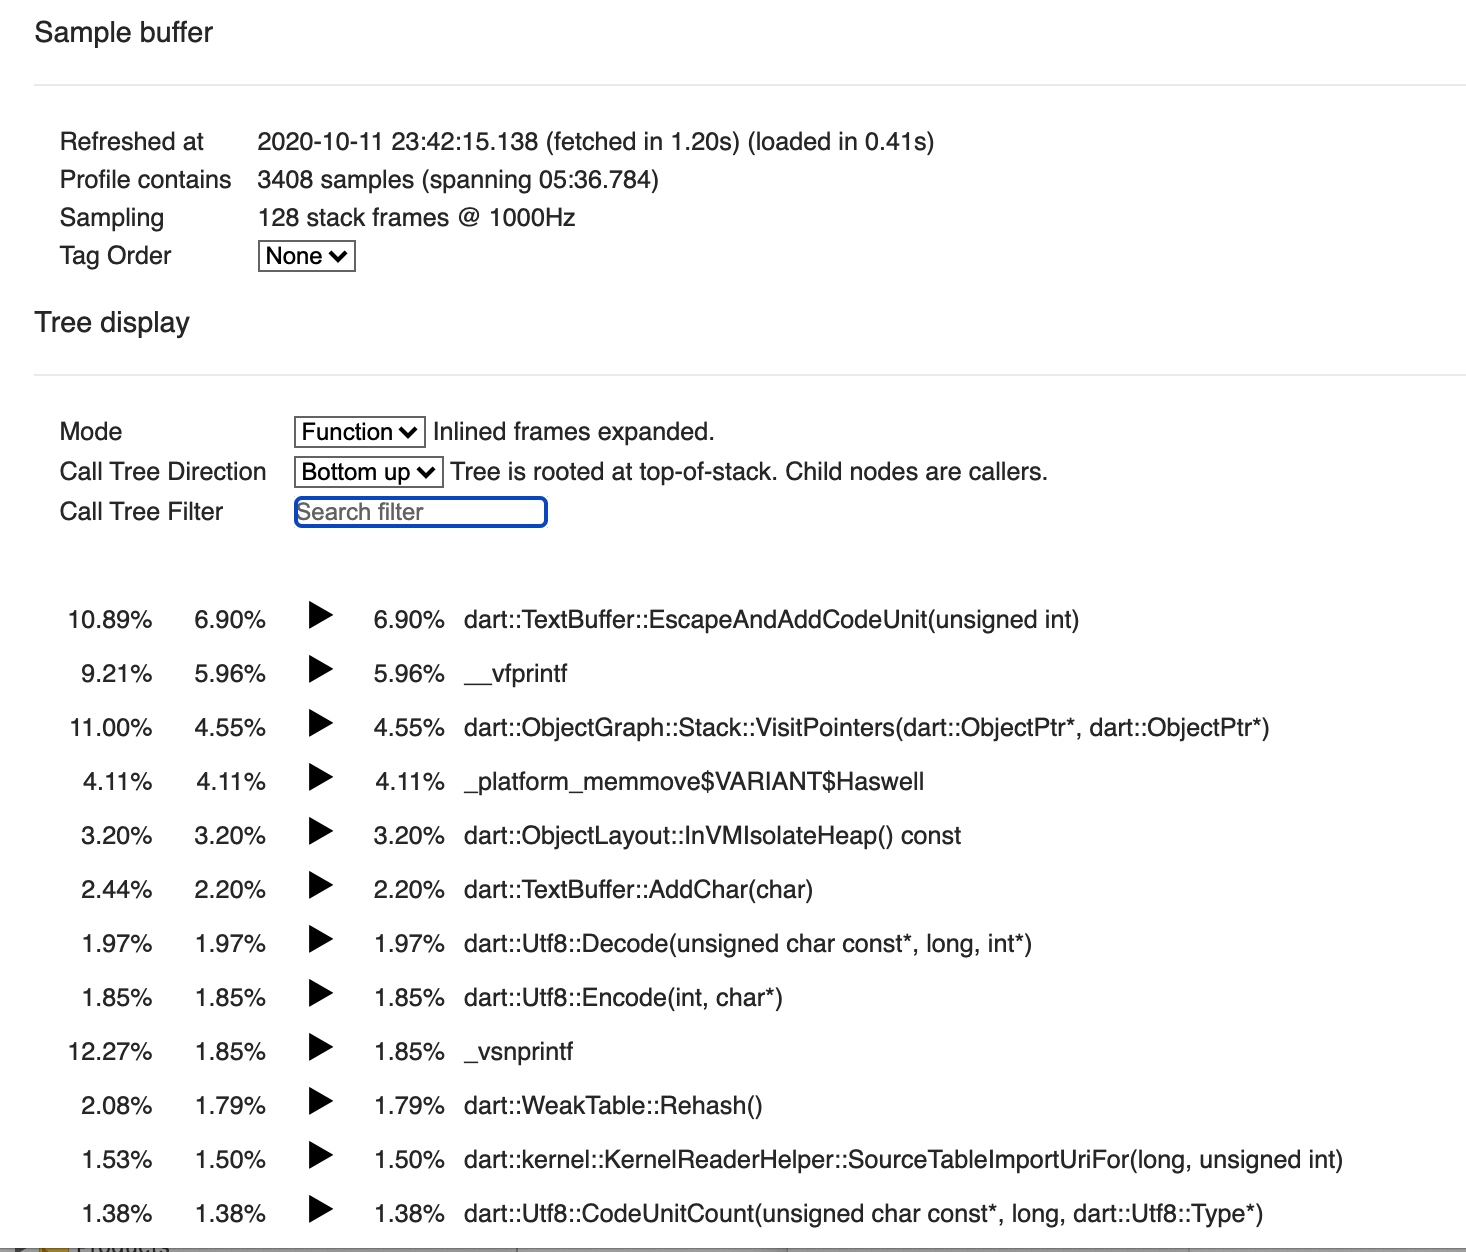
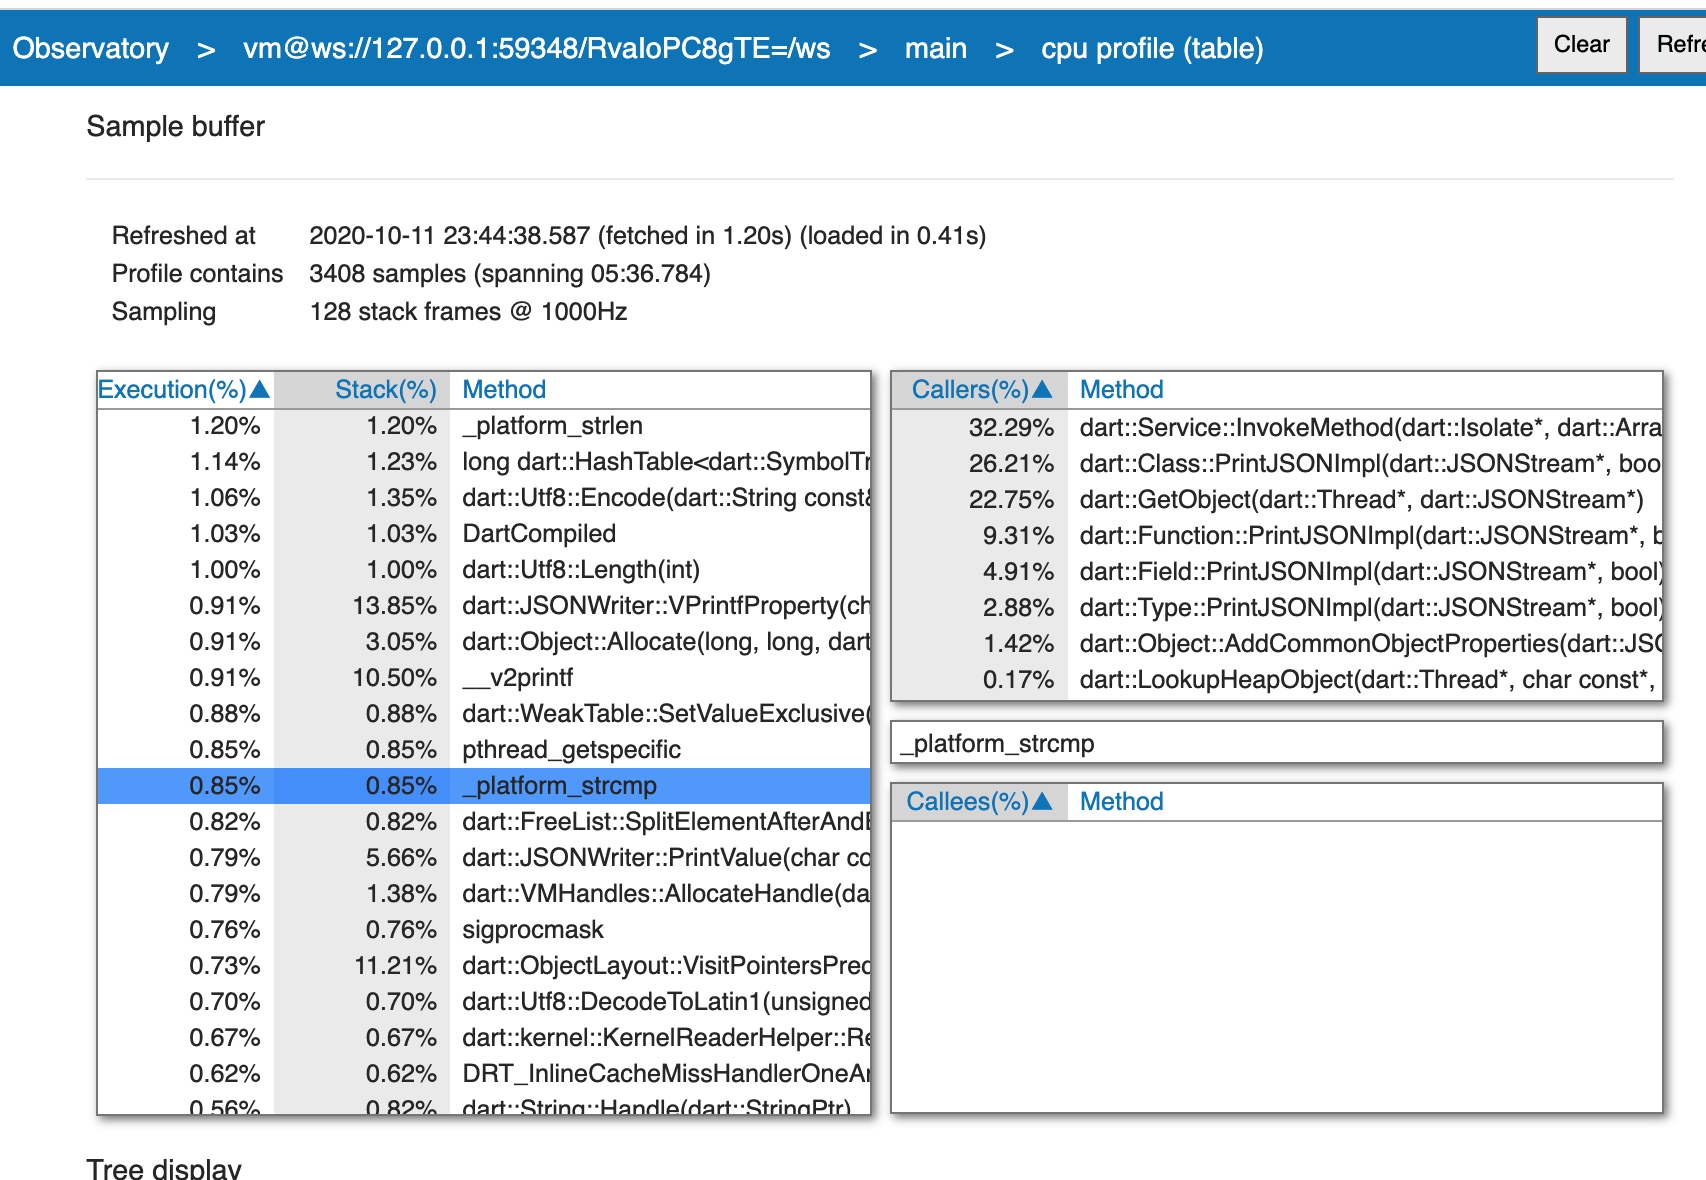
- cup profile(table)
Observatory-allocation profile
- 查看内存分配
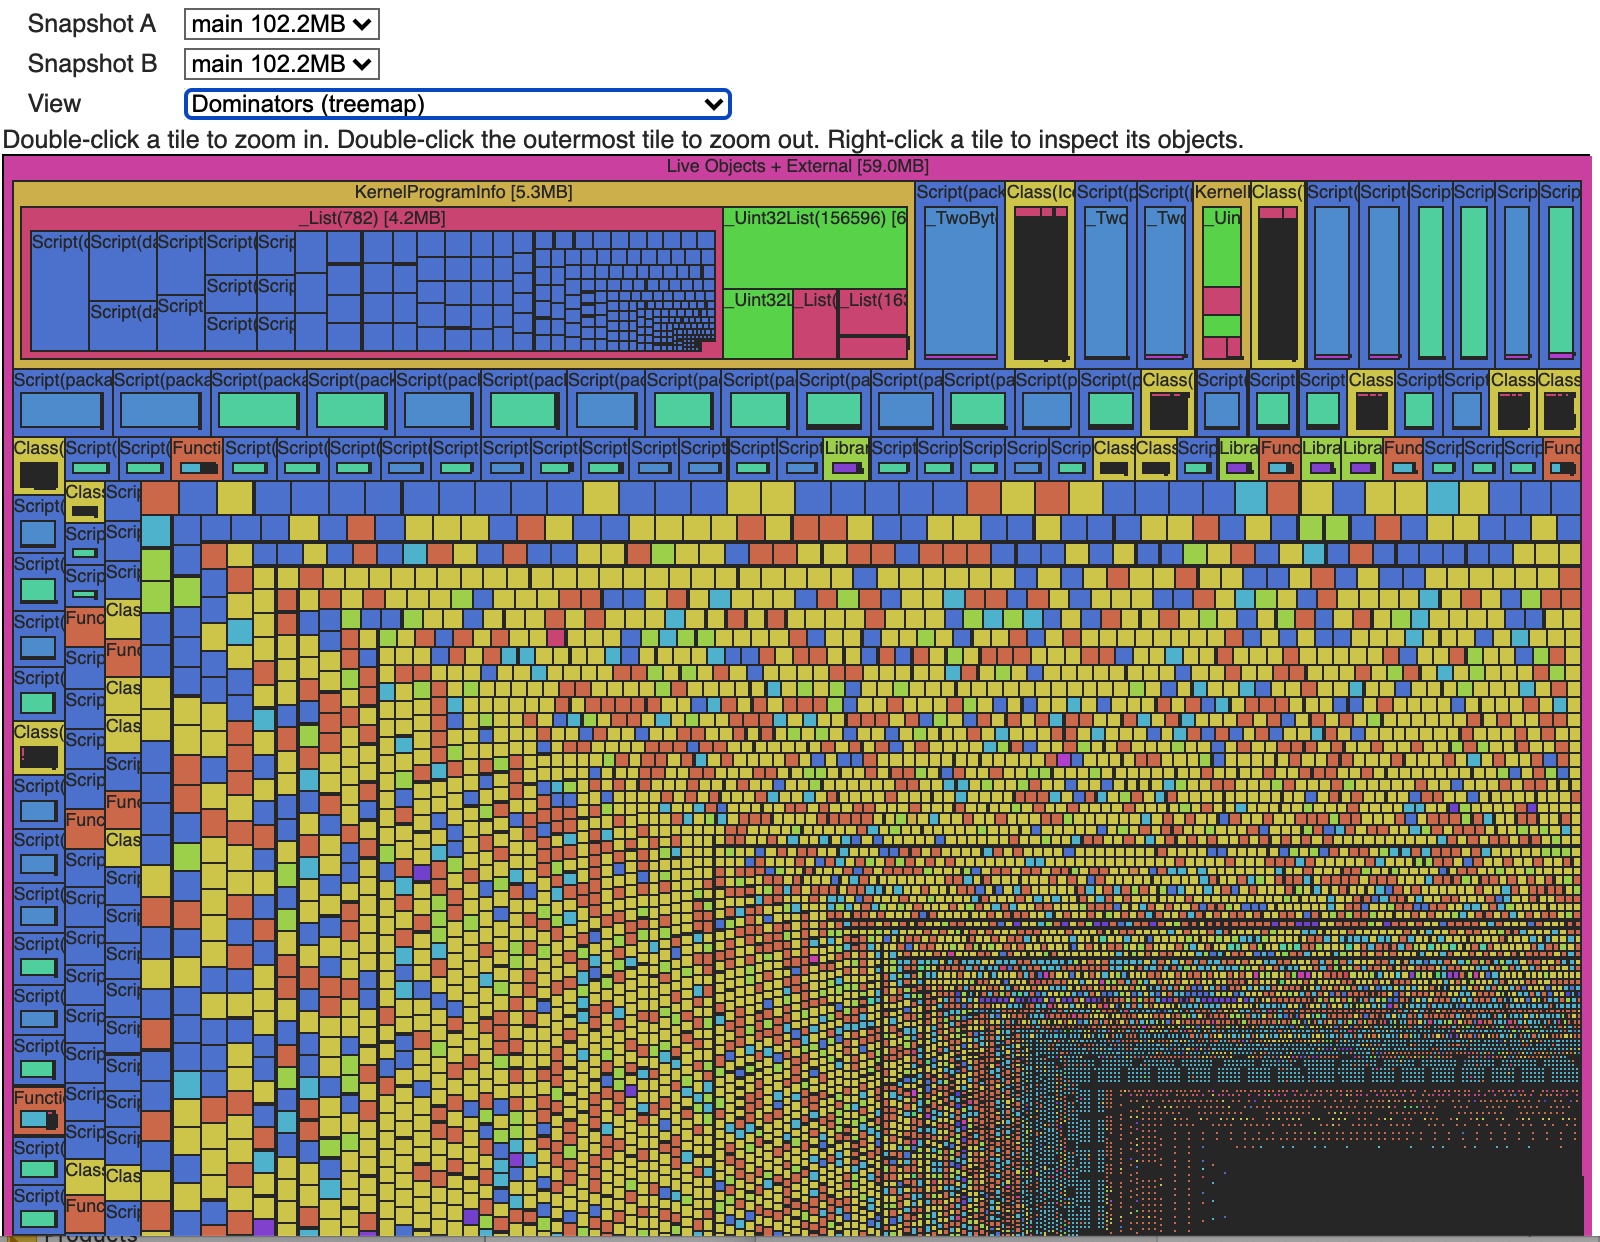
Observatory-allocation heap snapshot
- 查看堆区的快照信息,支持多种展现,可一很直观的的看到某个类的占用空间(非常有用)
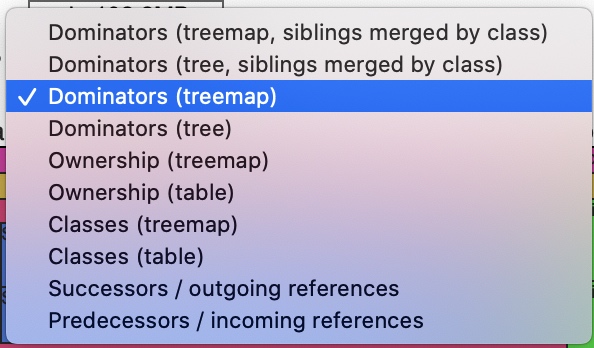
- tree map图示,可以切换成class
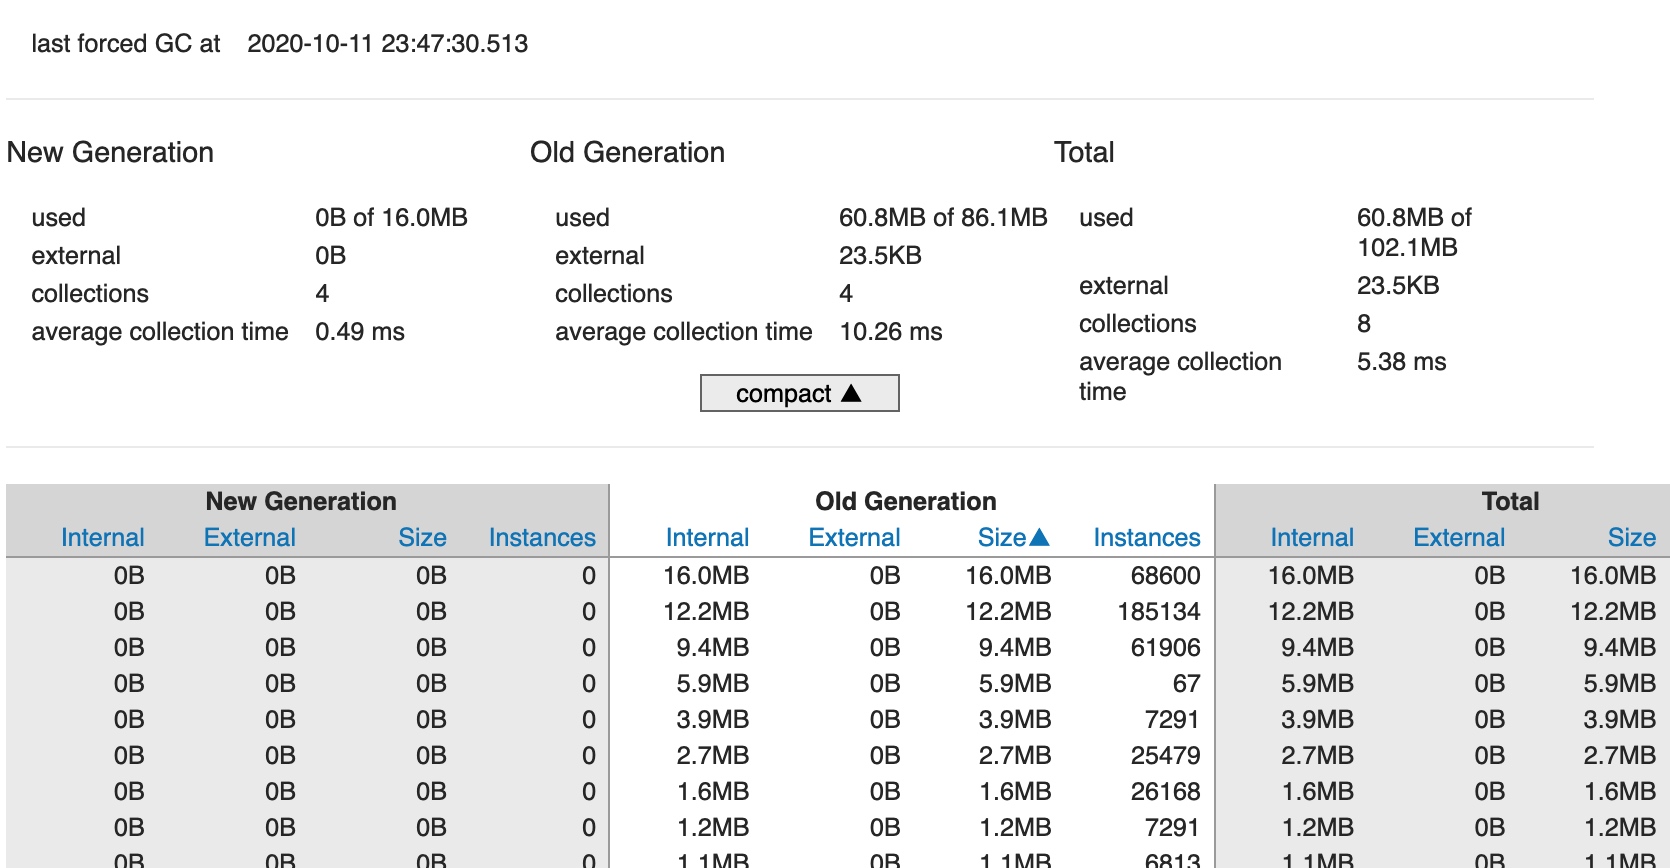
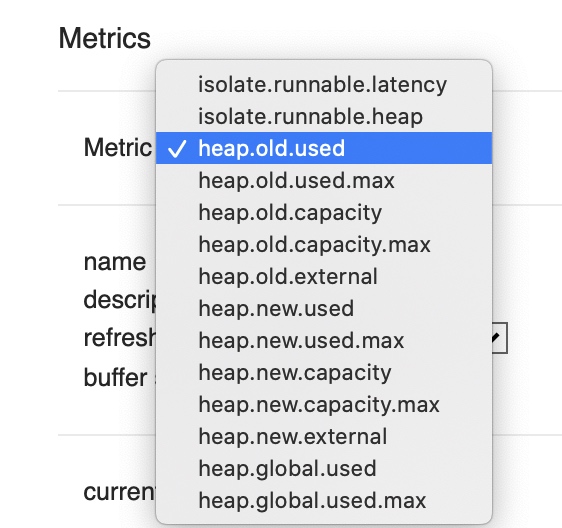
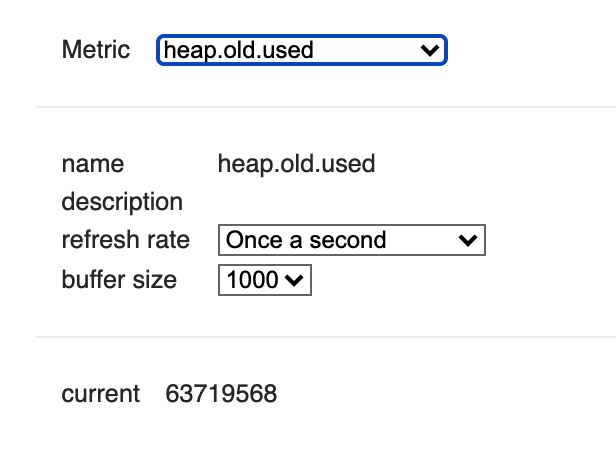
 ## Observatory-Metrics
 - 堆区分配的统计信息,对项目的内存泄漏检查有一定的帮助
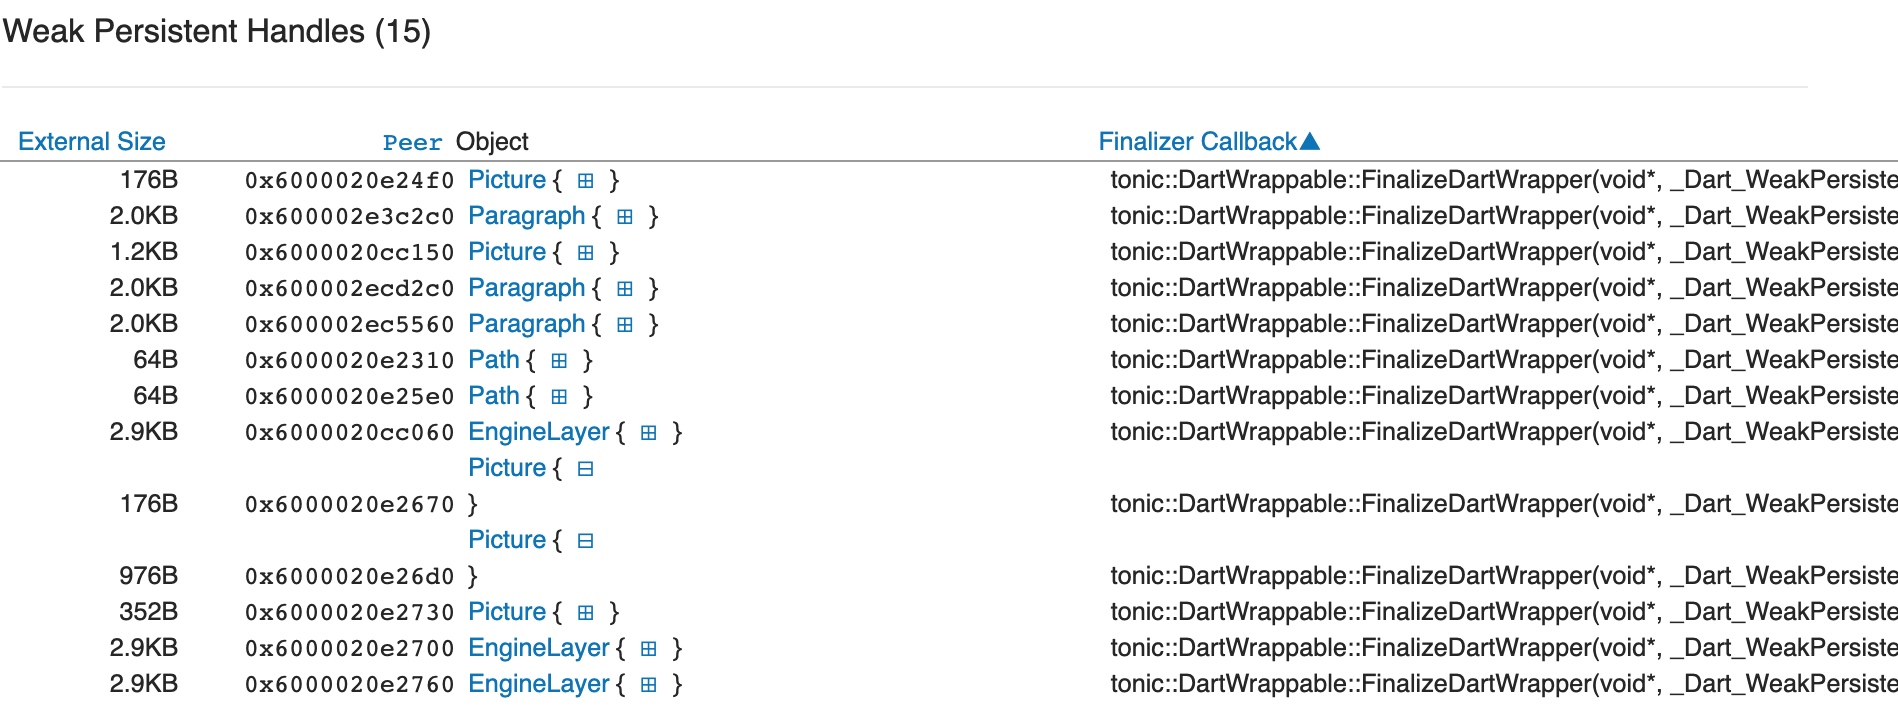
 ## Observatory-persistent handles
 - 查看待处理绘制指令
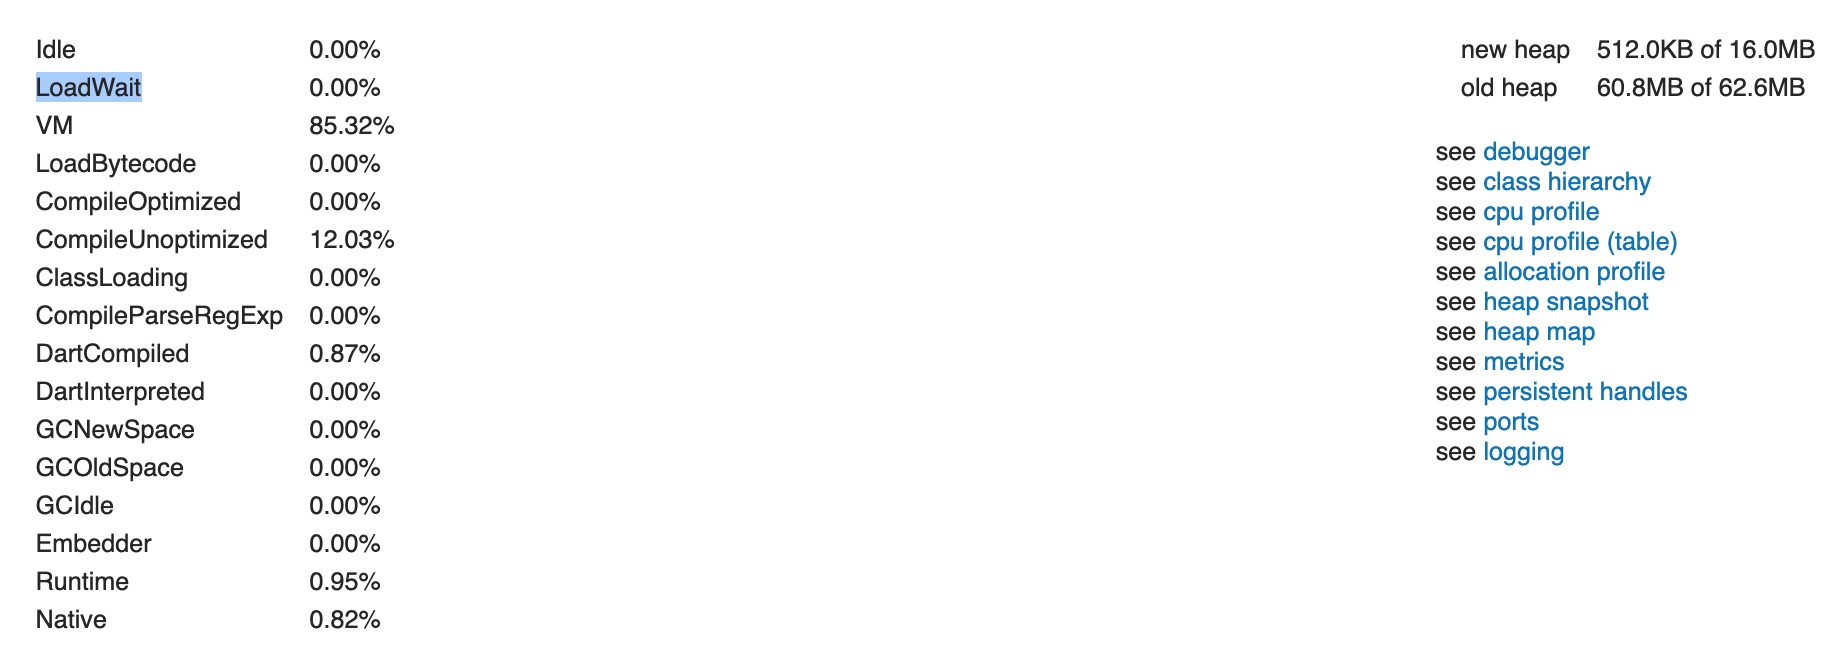
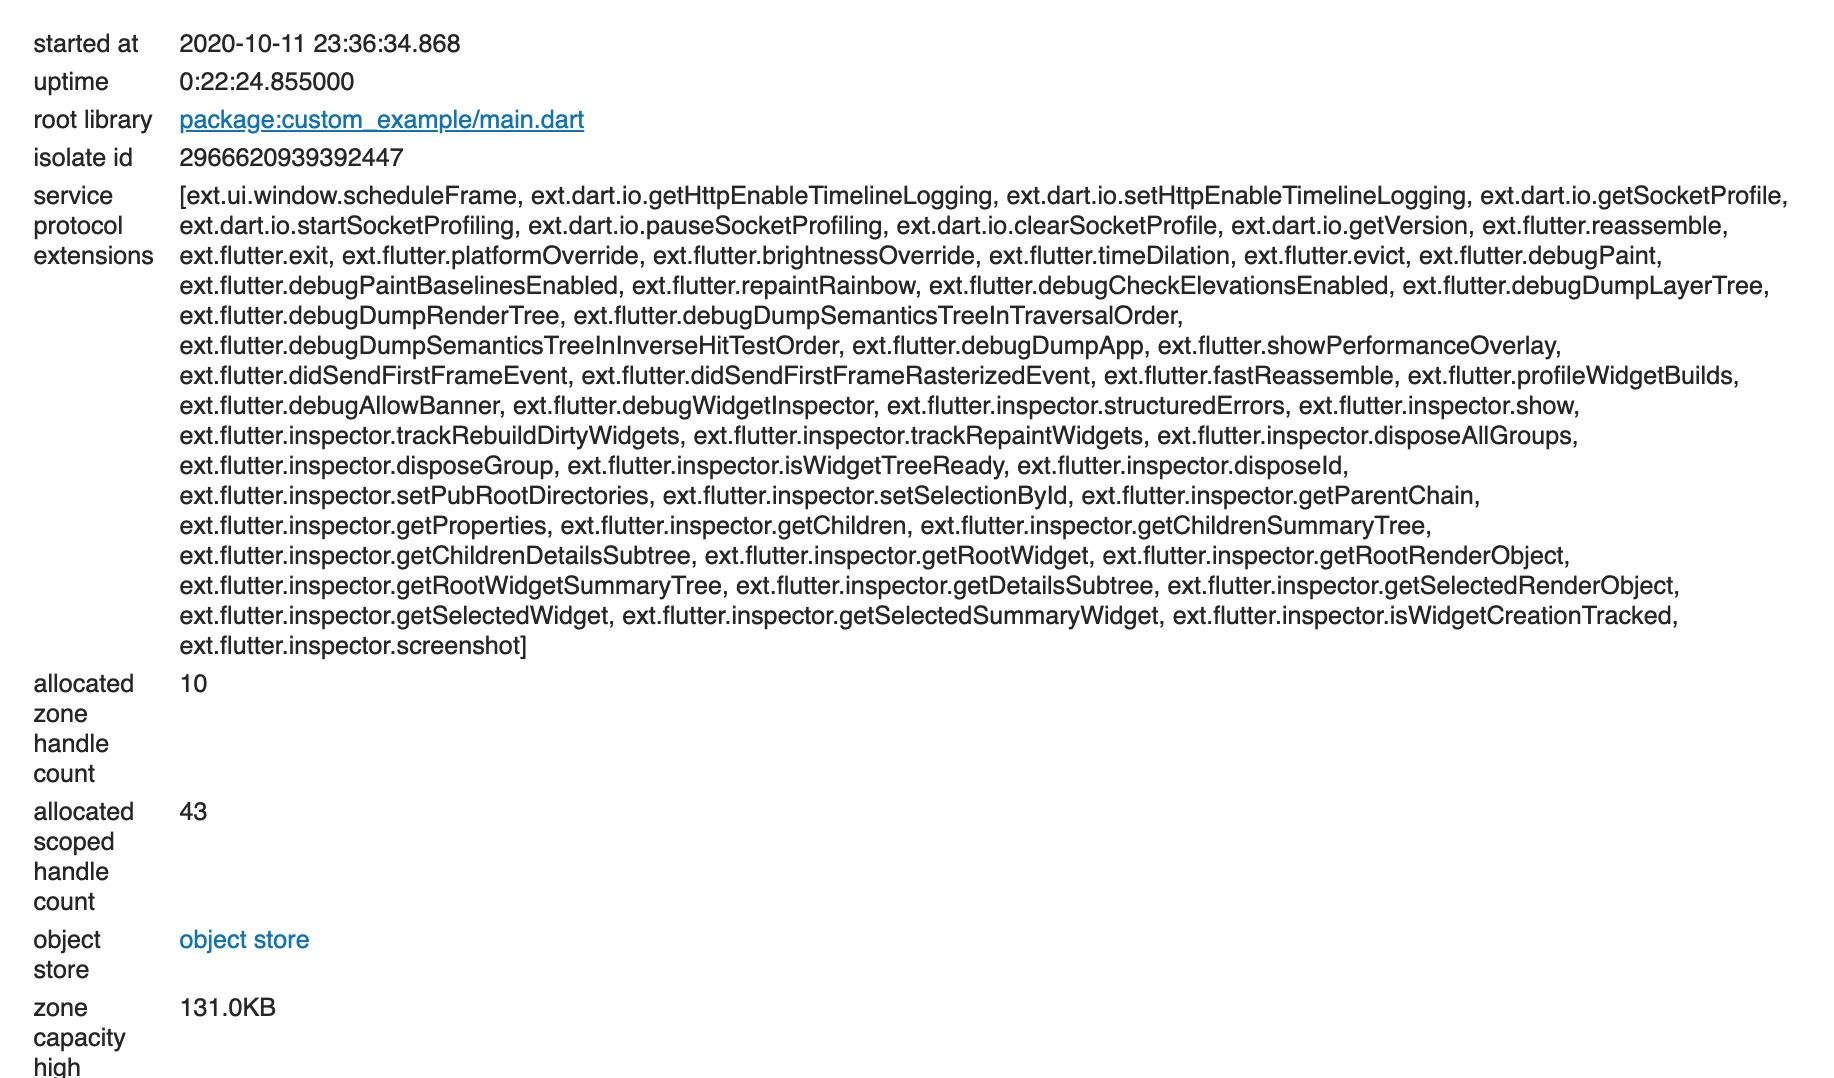
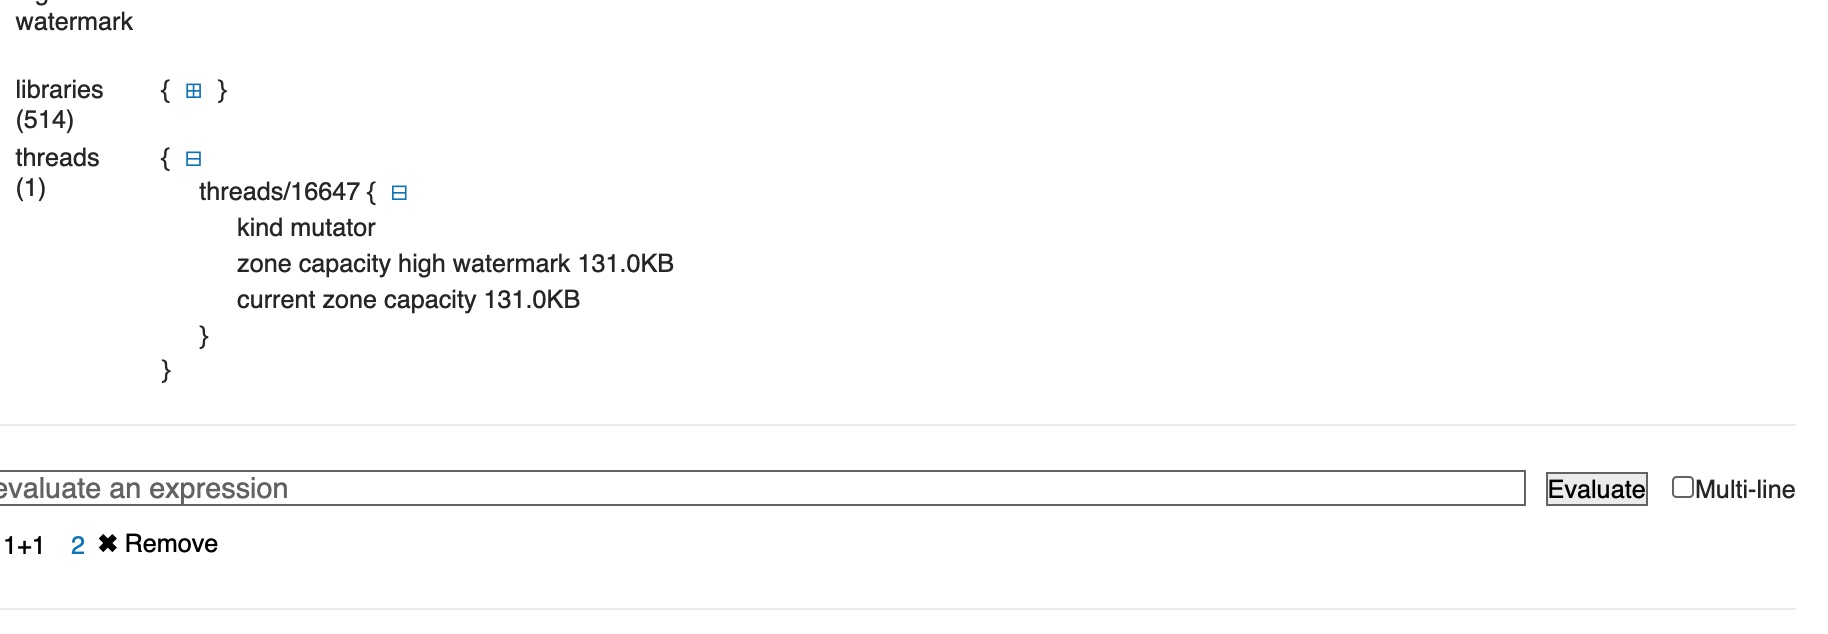
Observatory-main
- main isolate的概览信息,当前占用的资源信息,依赖的服务等
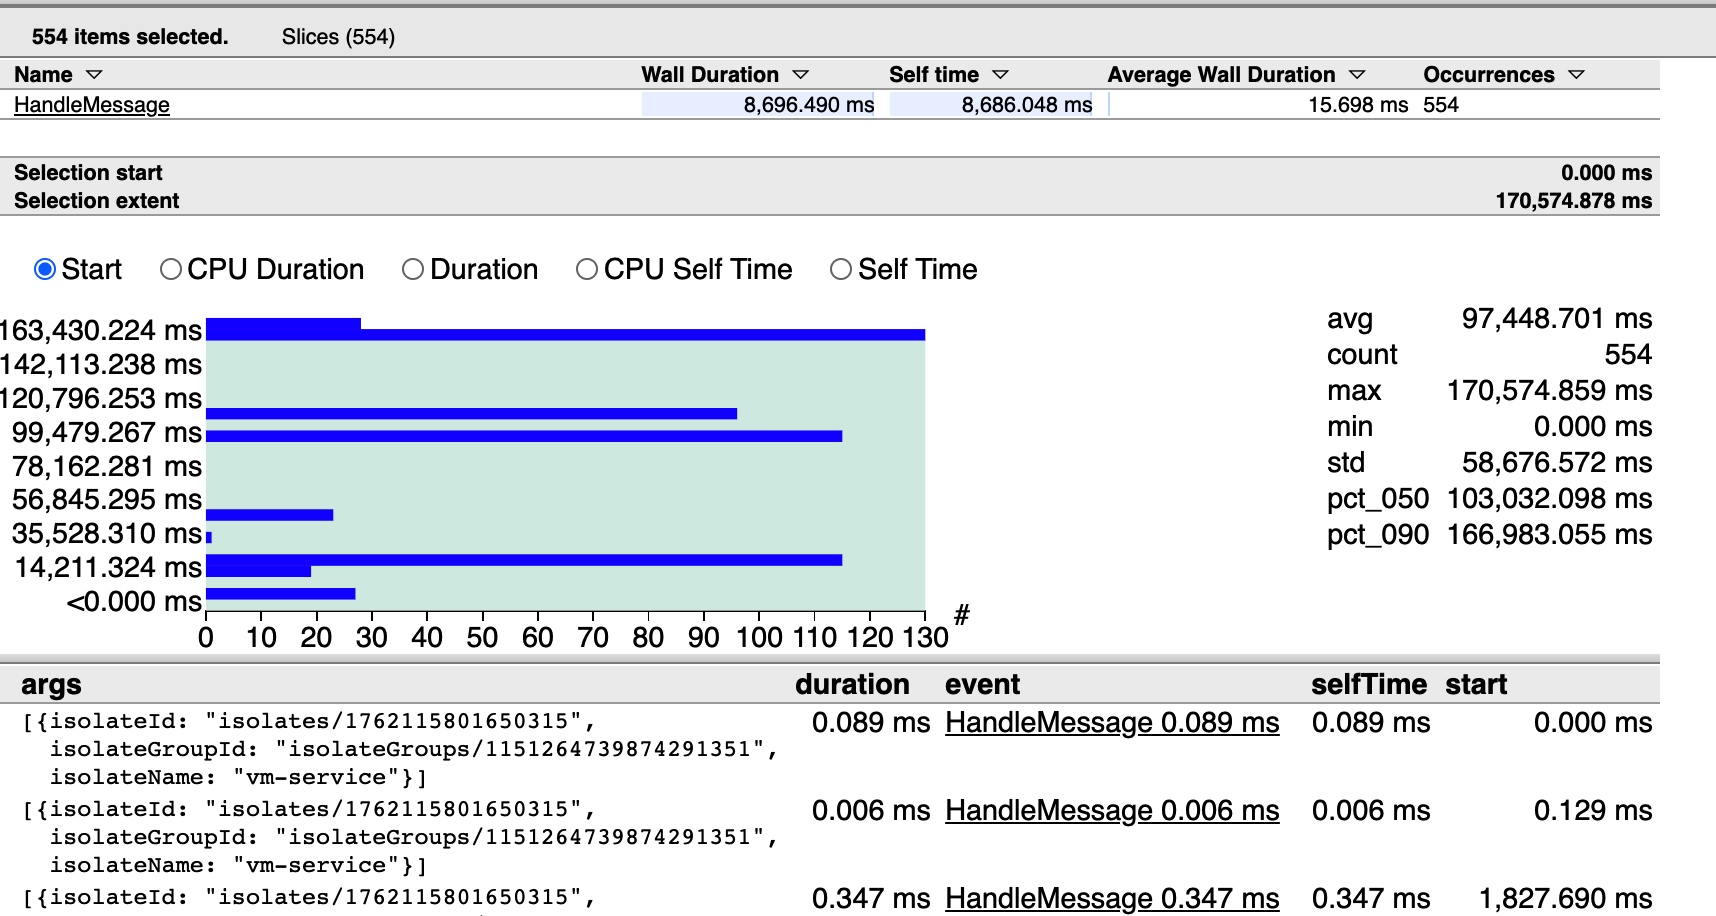
 ## Observatory-timeline
 - 提供了多种选项分类统计api的调用时间长
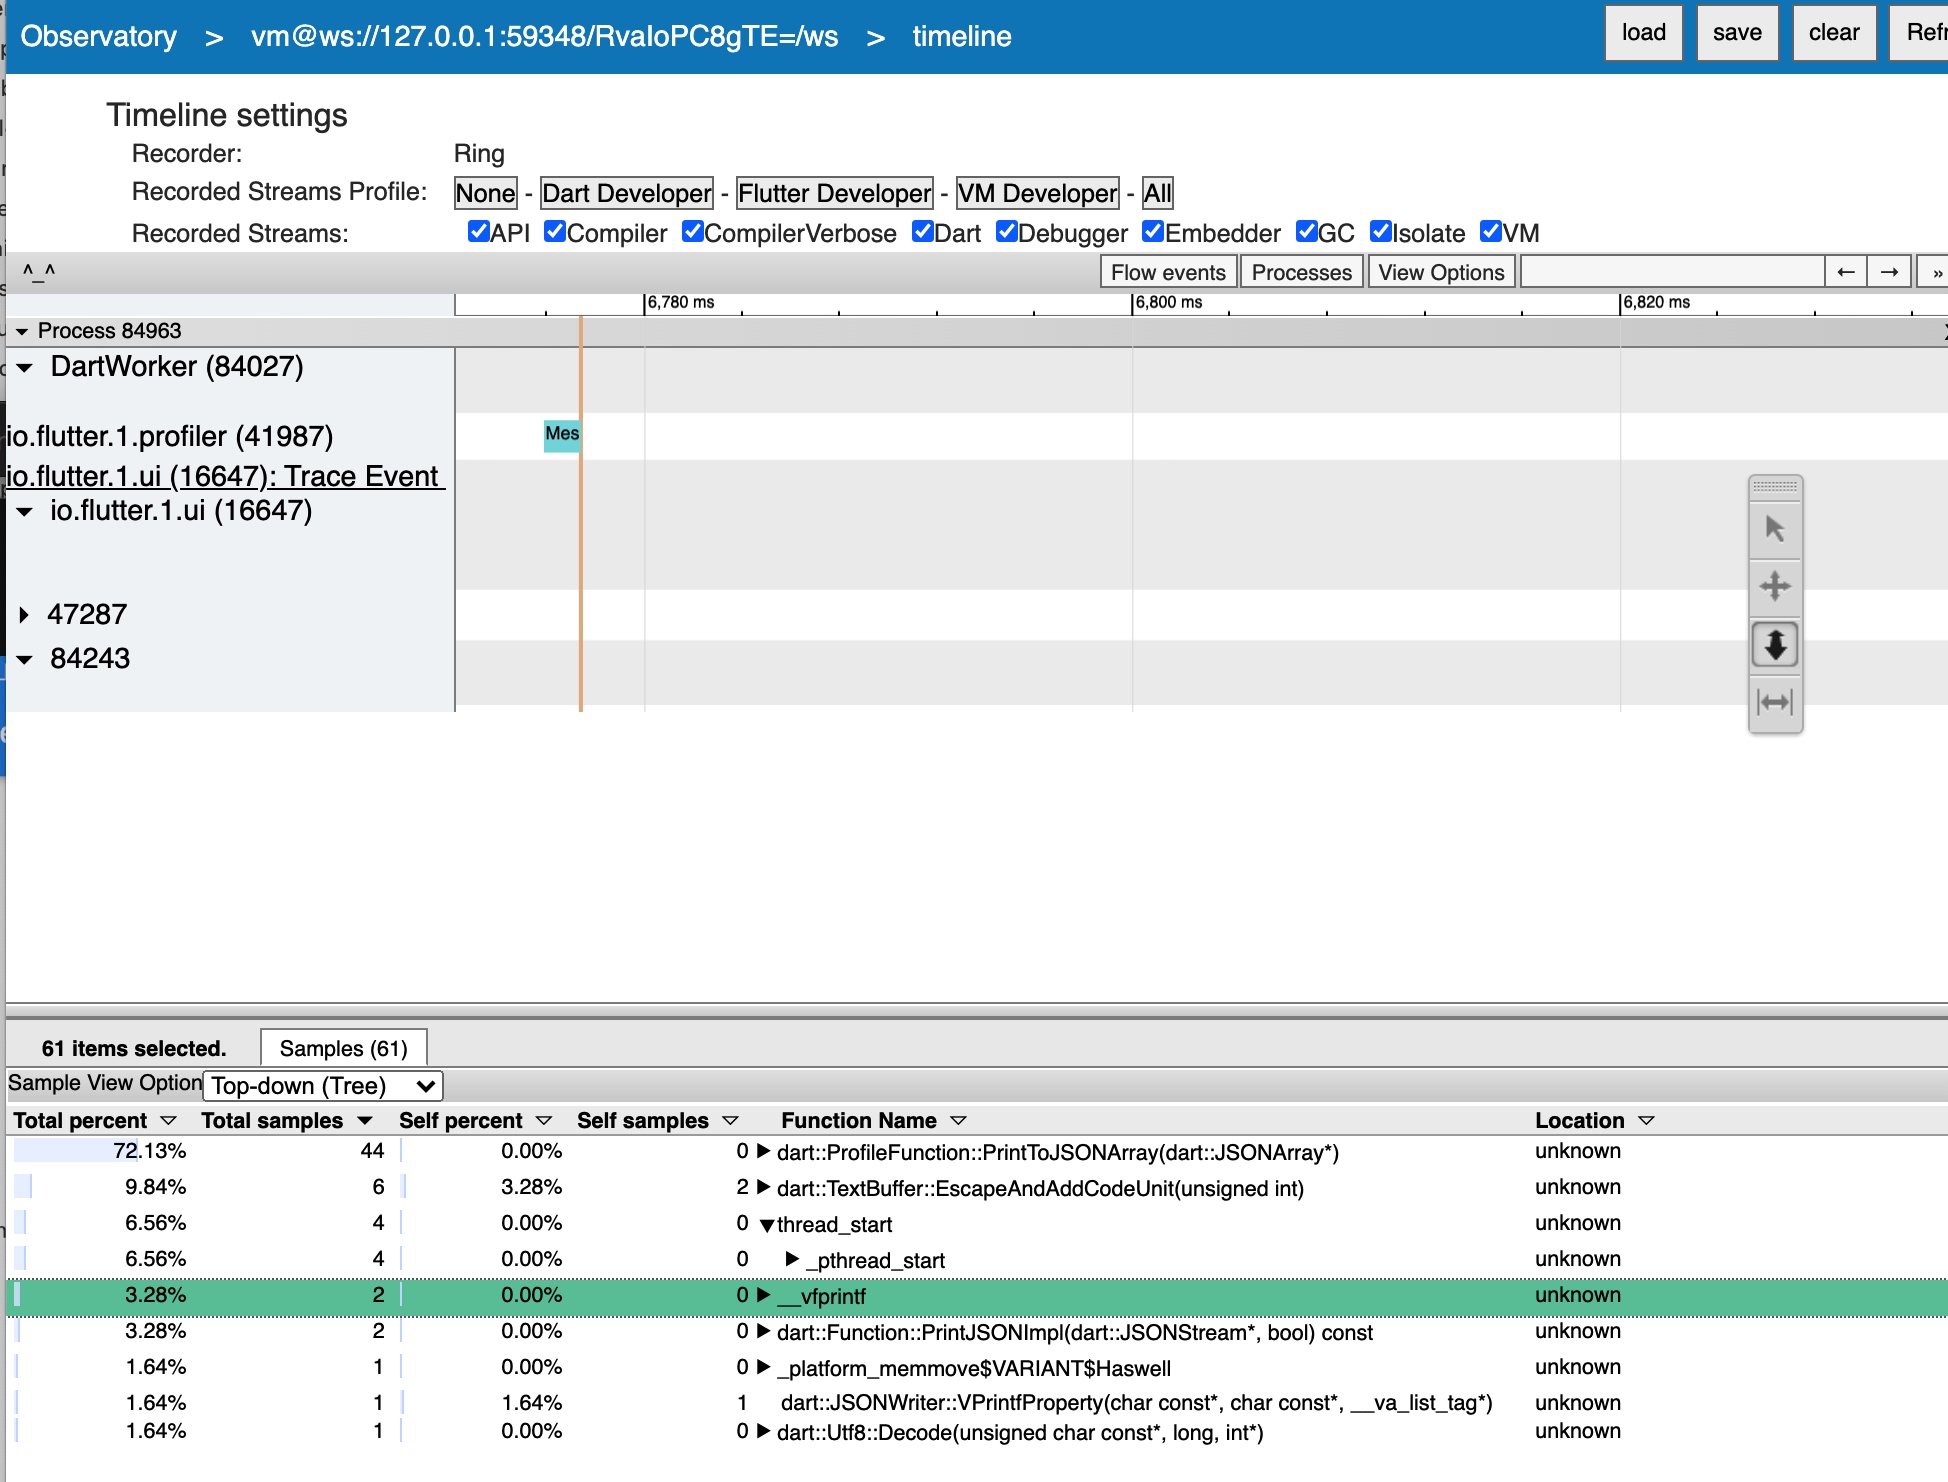
- 通过
flutter run --profile --trace-skia来查看skia的调用情况,将文件导入,点击上面窗口的load - Flutter将每一帧录制成SkPicture给Skia渲染,也可以通过捕捉Skp(SkPicture)进行分析,命令
flutter screenshot --type=skia
DevTools检测
DevTools也提供了一些基本的检测,具体的细节没有Observatory提供的完善.
下面的Timeline常见的示意图,y轴承为每一帧渲染的基准线16ms
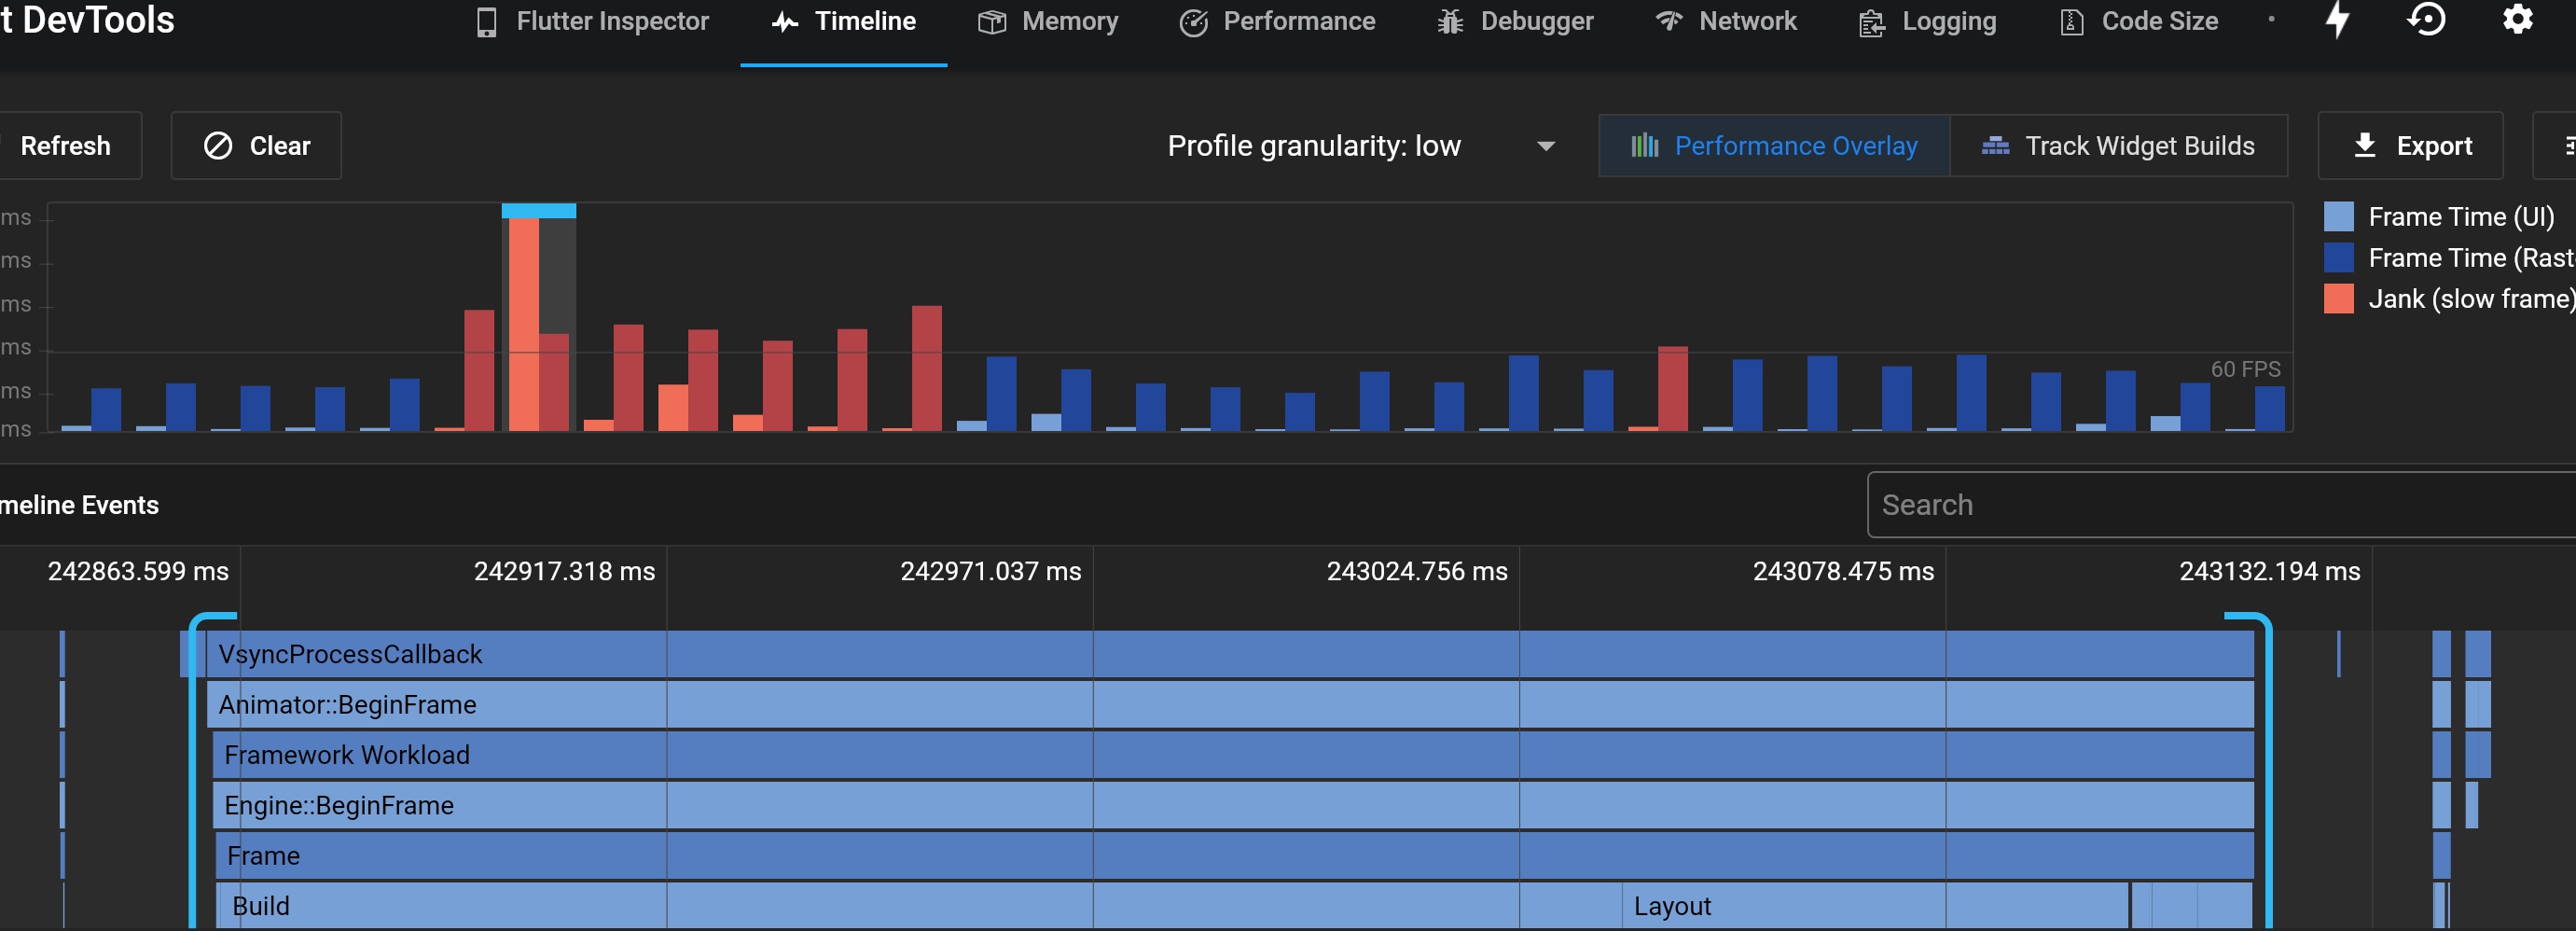
以下为UI线程耗时较长的build阶段
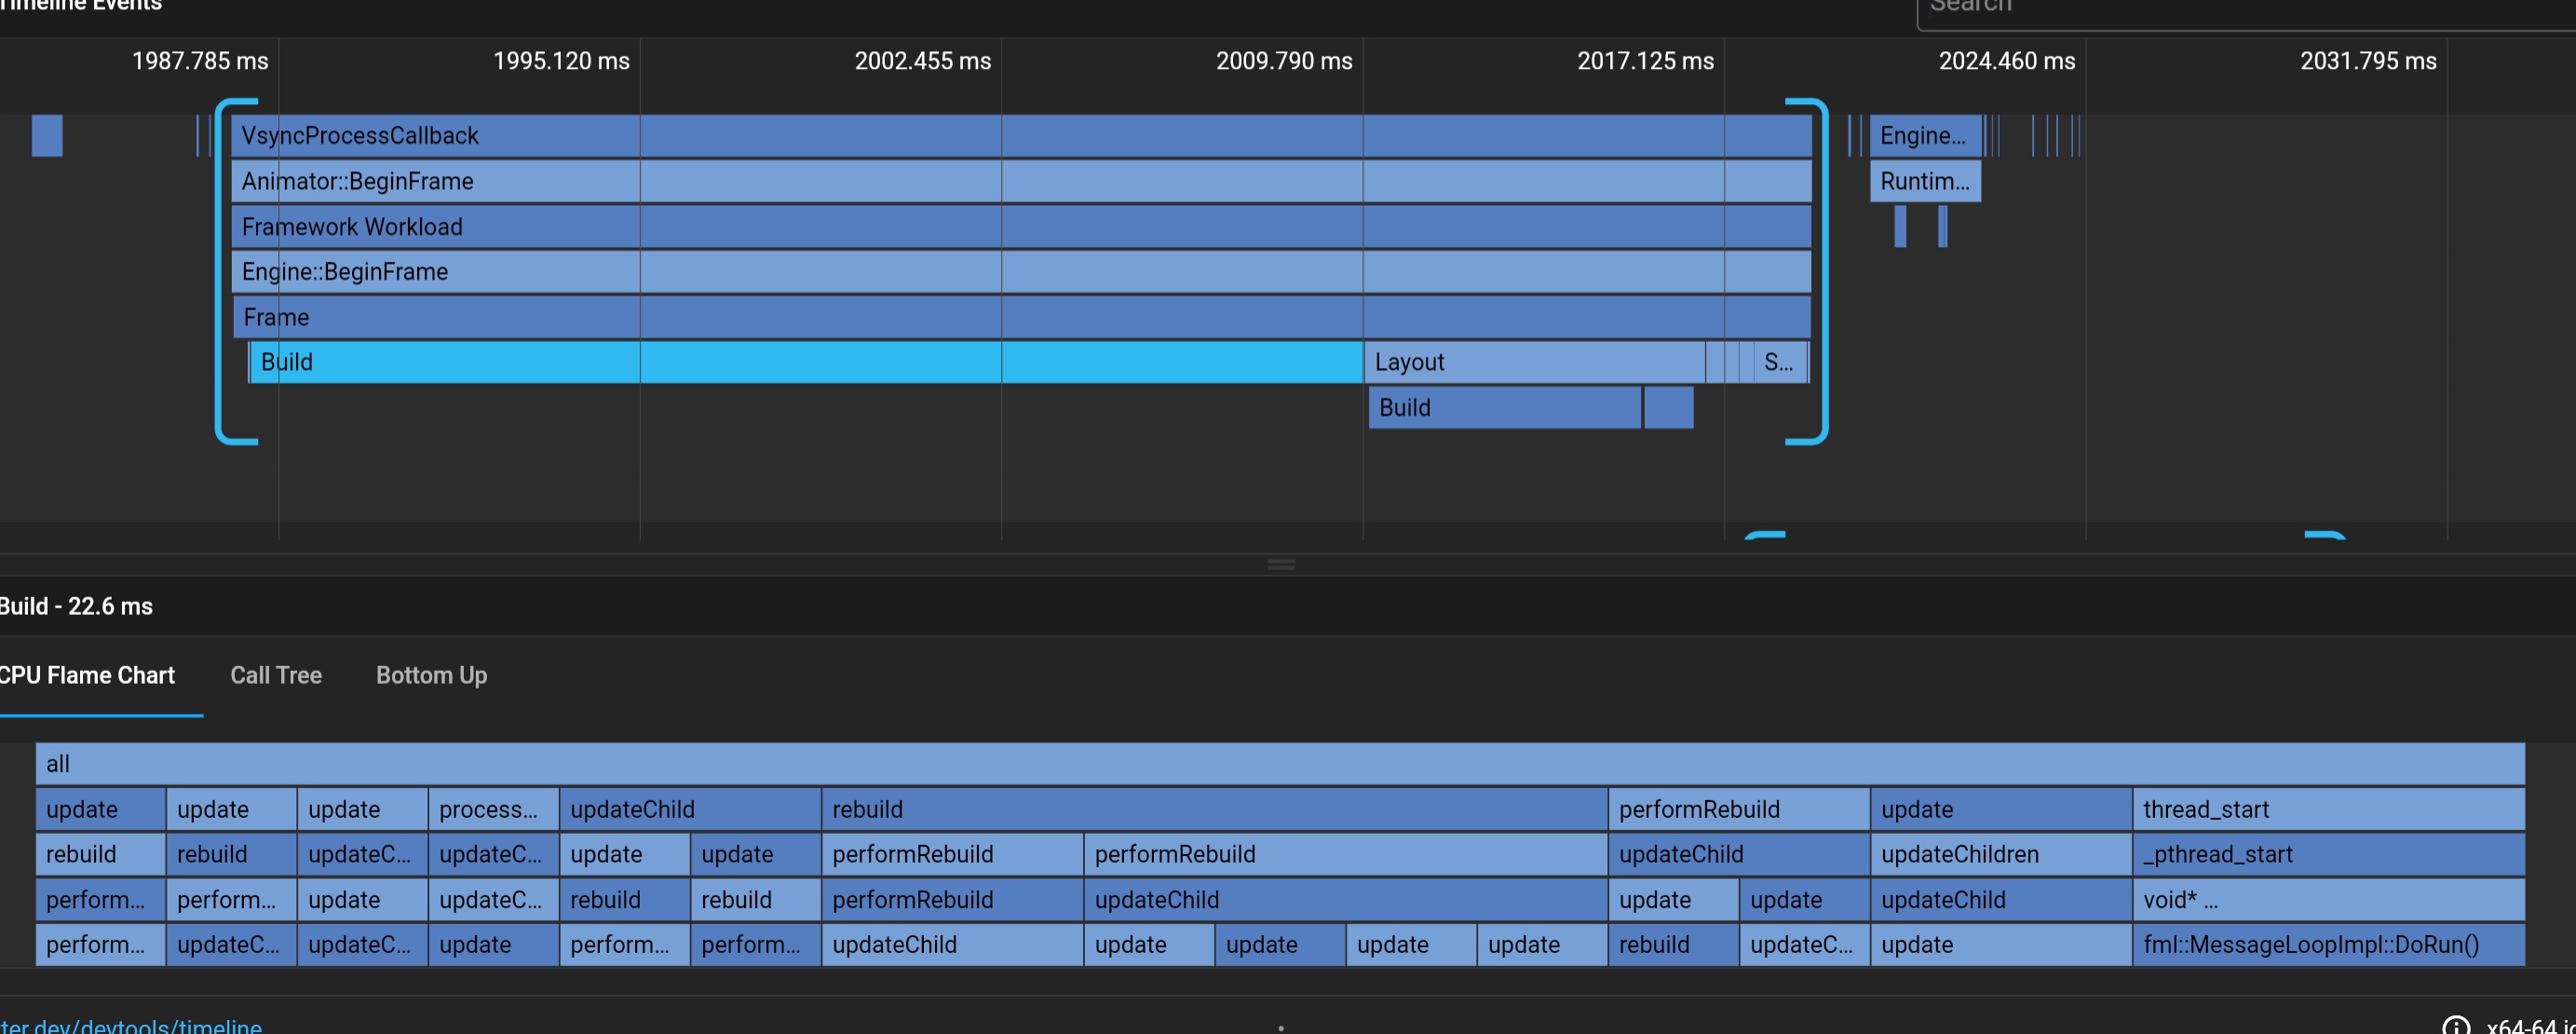
展开Build CallTree,主要耗时发生在
updateChild,子树的构建占用了大量时间

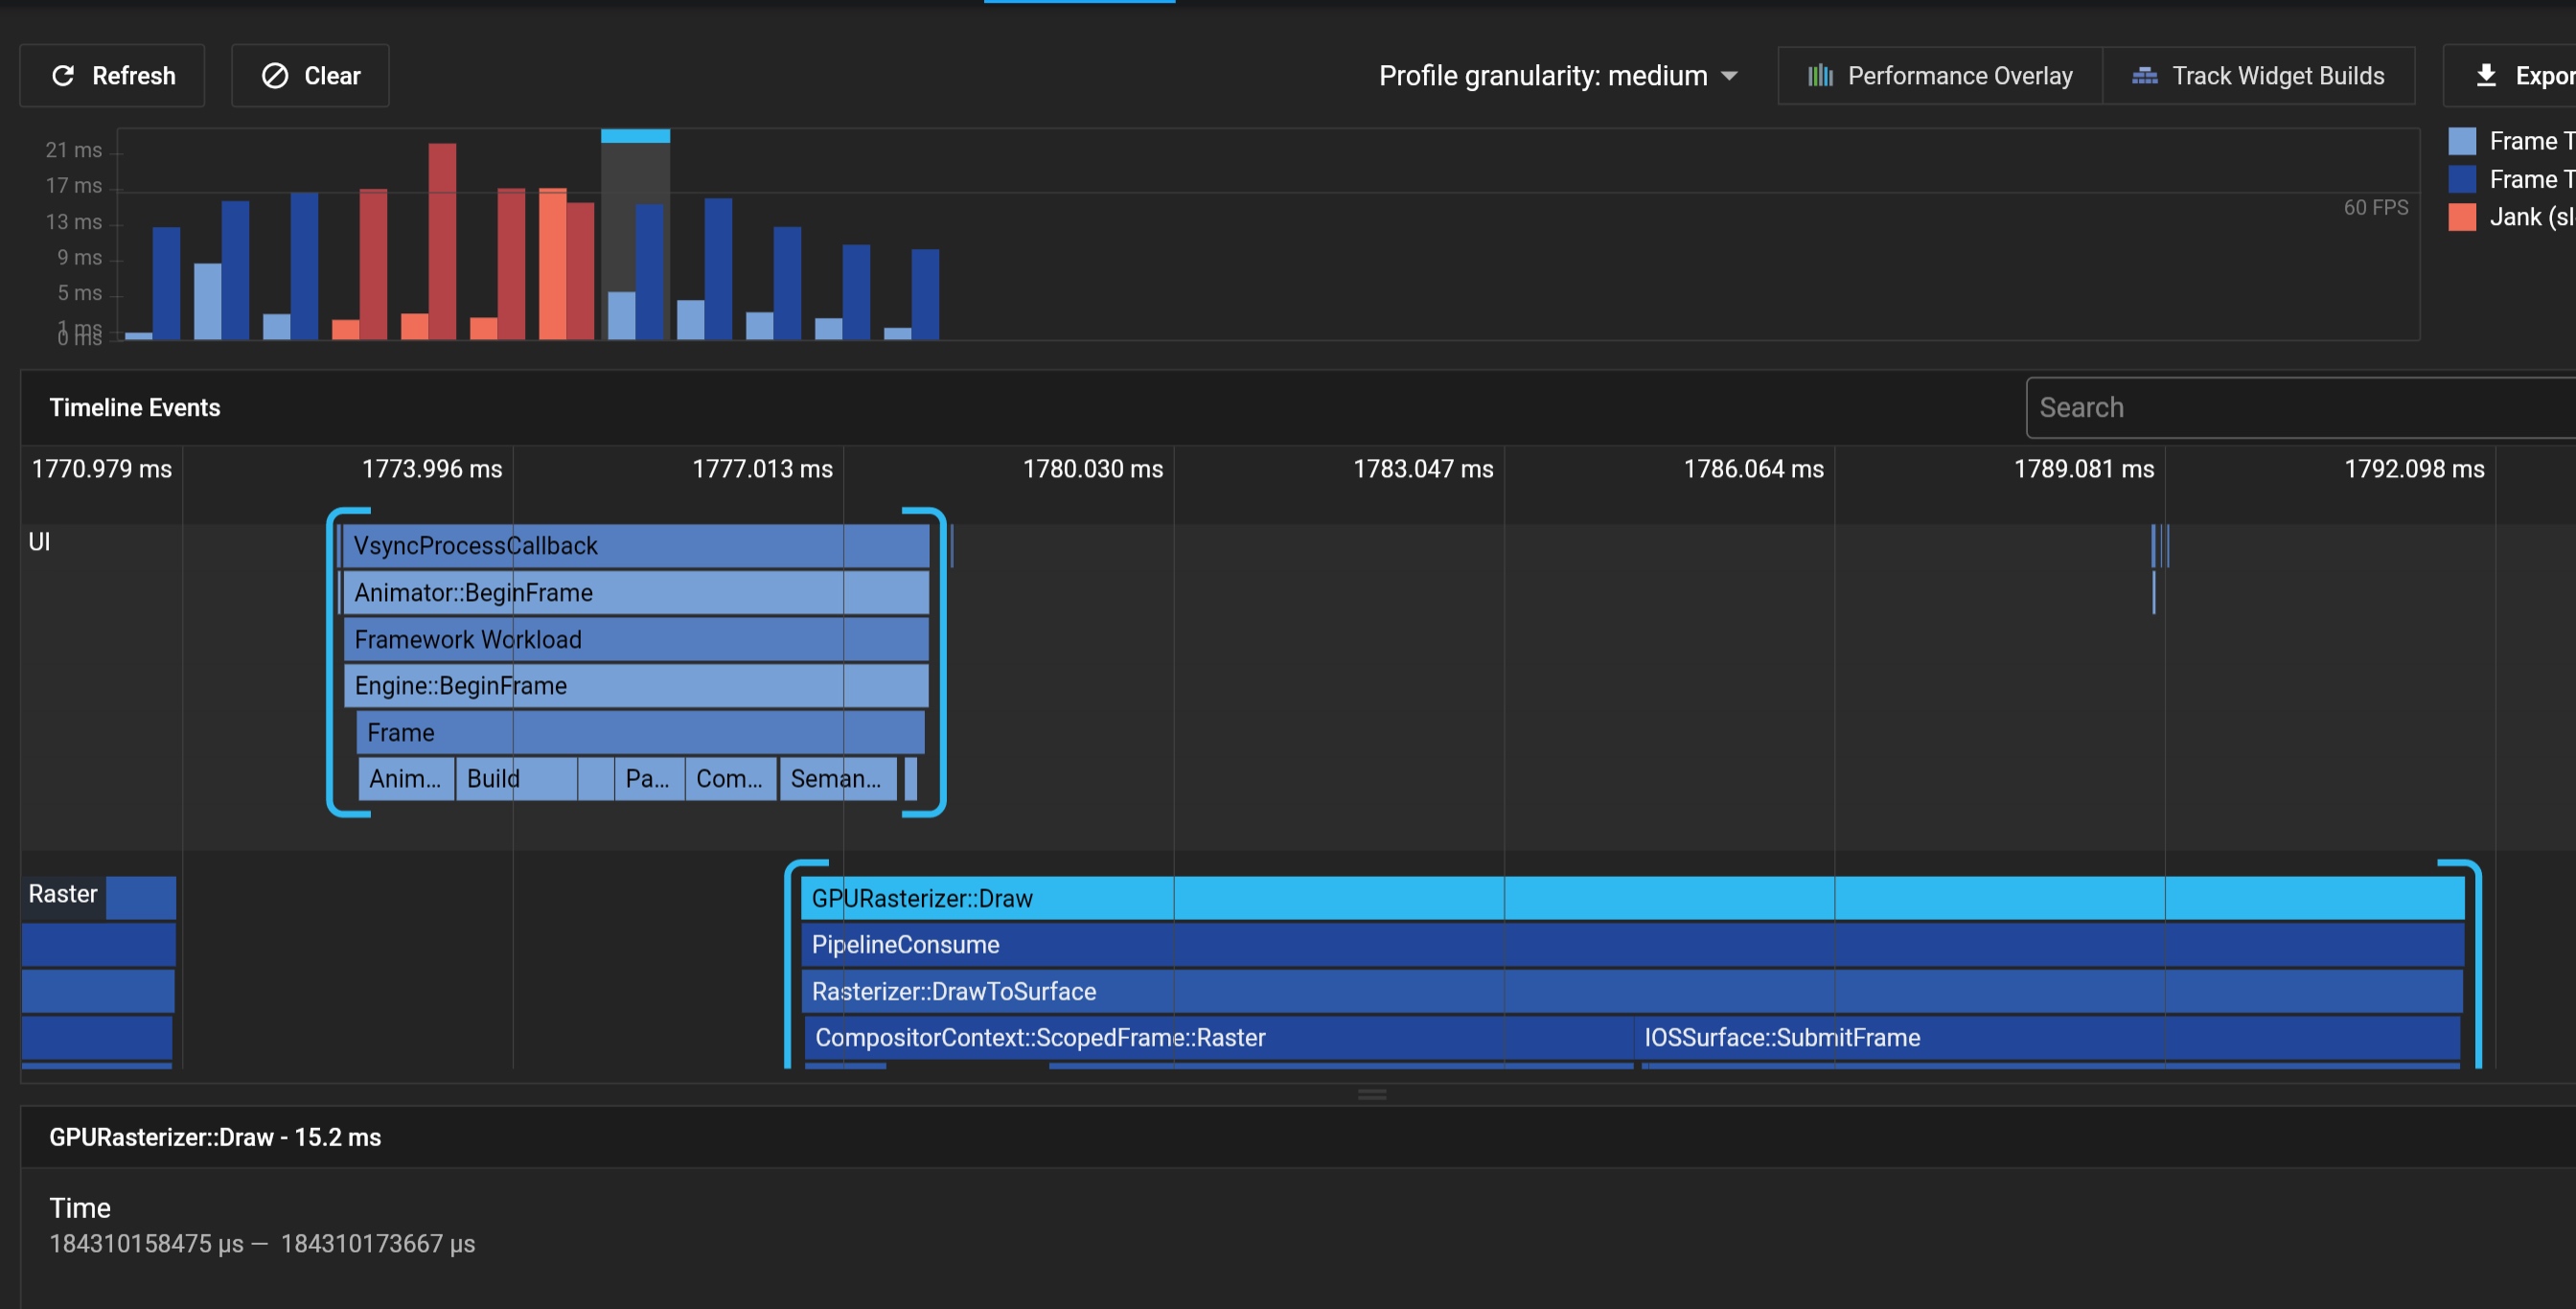
除了UI Thread外,还包括了Raster Thread(GPU线程)的火焰图,图形可以放大和缩小,同样可以看到每个过程的
参考链接
bilibi: https://www.bilibili.com/video/av63626119
observatory: https://github.com/flutter/engine/tree/master/shell/testing/observatory

