

R语言:KEGG富集、可视化教程,附代码
上篇笔记分享了使用R语言进行GO分析的机械化操作,本篇内容将会分享如何用R语言作通路分析。
紧接上篇笔记内容,作KEGG富集分析用的文件是id.txt文件,即基因ID文件。
1.安装以下所需要的包
install.packages("colorspace")                ##安装所需要的包
install.packages("stringi")
source("Bioconductor - Help")
biocLite("DOSE")
biocLite("clusterProfiler")
biocLite("pathview")

2.加载所需包
library("colorspace")    ##加载所需要的包
library("stringi")
library("DOSE")
library("clusterProfiler")
library("org.Hs.eg.db")
library("enrichplot")
library("ggplot2")
3.设置工作路径并加载“clusterProfiler”包
setwd("C:\\Users\\31791\\Desktop\\KEGG")
library("clusterProfiler")
4.导入id.txt文件,运行以下代码
rt=read.table("id.txt",sep="\t",header=T,check.names=F)
rt=rt[is.na(rt[,"entrezID"])==F,]
geneFC=rt$logFC
gene=rt$entrezID
names(geneFC)=gene
5.运行以下代码进行KEGG富集分析,得到KEGG.txt文件
kk <- enrichKEGG(gene = gene, organism = "hsa", pvalueCutoff =0.05, qvalueCutoff =0.05)
write.table(kk, file="KEGG.txt",sep="\t",quote=F,row.names = F)
6.进行可视化绘制气泡图和柱状图
#柱状图
tiff(file="barplot.tiff",width = 20, height = 20, units ="cm",compression="lzw",bg="white",res=600)
barplot(kk, drop = TRUE, showCategory = 20)
dev.off()
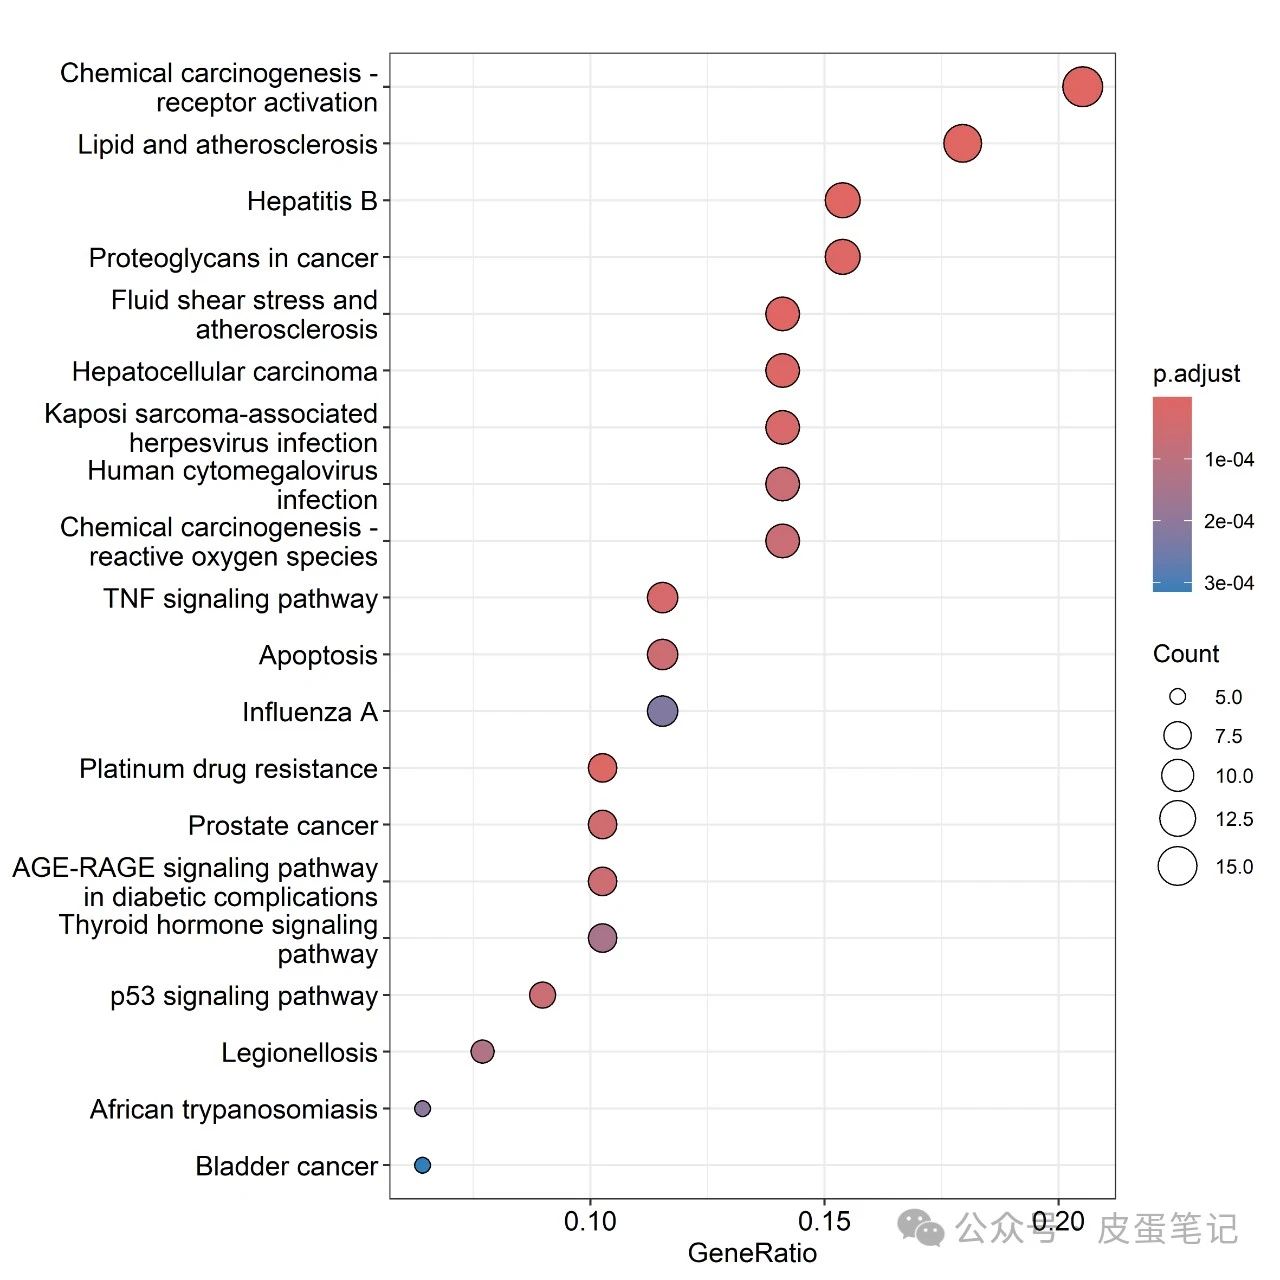
#点图
tiff(file="dotplot.tiff",width = 20, height = 20, units ="cm",compression="lzw",bg="white",res=600)
dotplot(kk, showCategory = 20)
dev.off()7.通路图 (利用pathview查阅代谢通路图并导出)
library("pathview")
keggxls=read.table("KEGG.txt",sep="\t",header=T)
for(i in keggxls$ID){
  pv.out <- pathview(gene.data = geneFC, pathway.id = i, species = "hsa", out.suffix = "pathview")
}
8.结果如下


本公众号不定时更新,敬请关注与期待。整理不易用你们发正刊(CNS)的金手指为本篇内容点赞支持,本文文件可关注私信回复"KEGG"获取。
文章转载自公众号:皮蛋笔记,欢迎关注,随时获取第一手文章内容。


【推荐】国内首个AI IDE,深度理解中文开发场景,立即下载体验Trae
【推荐】编程新体验,更懂你的AI,立即体验豆包MarsCode编程助手
【推荐】抖音旗下AI助手豆包,你的智能百科全书,全免费不限次数
【推荐】轻量又高性能的 SSH 工具 IShell:AI 加持,快人一步
· winform 绘制太阳,地球,月球 运作规律
· AI与.NET技术实操系列(五):向量存储与相似性搜索在 .NET 中的实现
· 超详细:普通电脑也行Windows部署deepseek R1训练数据并当服务器共享给他人
· 上周热点回顾(3.3-3.9)
· AI 智能体引爆开源社区「GitHub 热点速览」