
openlayers使用
最近用openlayers地图写了点东西,把代码拿出来备份一份,里面方法还没有整合封装,都有注释,可以稍作参考,有一部分代码是同事写的,我也没做处理,暂时先这样了(可能不理想,我只是简单记录一下,仅供参考)。效果图如下:
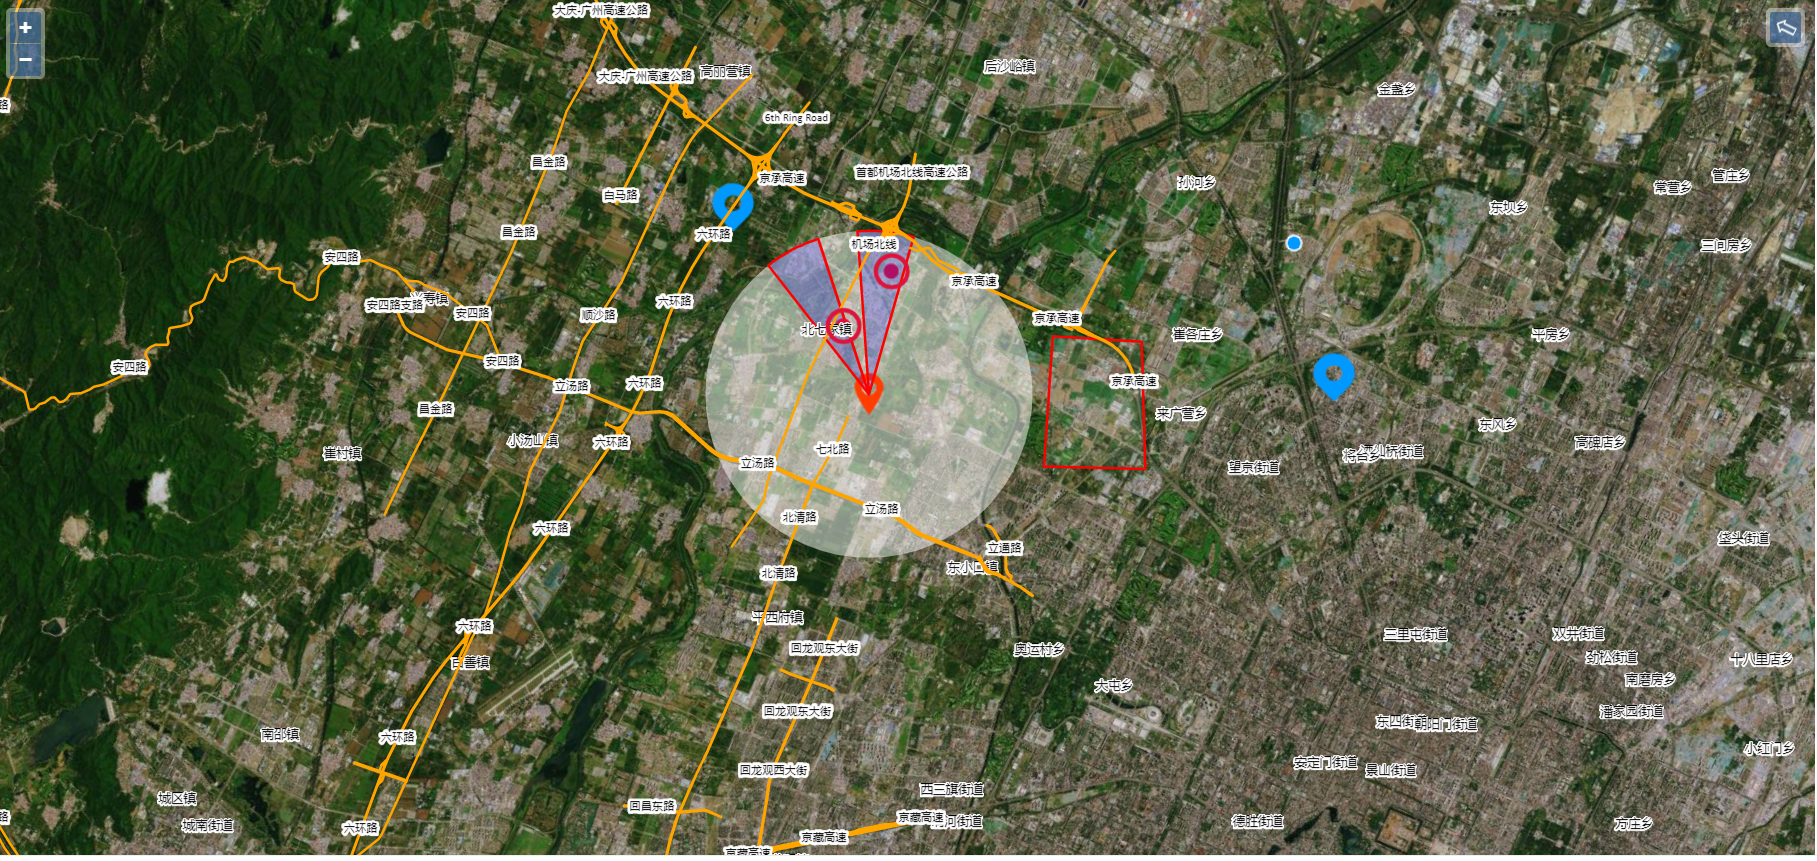
(1)红色图标当前设备显示(图标显示功能)
(2)蓝色图标其它设备显示(图标显示功能)
(3)红色图标的透明圆圈,为当前设备侦测范围(画院功能)
(4)地图旋转功能,文字还是正方向显示,就像手机上使用地图人转动方向一样,右上角会有个回正的箭头,当地图旋转状态的时候点击自动回正(同事写的,我没备注还)
(5)红色动态光圈,发现目标后自动显示报警(图标功能,动态光圈扩散功能)
(6)右侧正方形(多边形绘画功能,记录绘画点坐标,自动回显多边形功能)
代码如下
@{ Layout = null; } <!DOCTYPE html> <html xmlns="http://www.w3.org/1999/xhtml"> <head> <meta http-equiv="Content-Type" content="text/html; charset=utf-8" /> <title></title> <link href="~/css/ol.css" rel="stylesheet" /> <script src="~/js/ol.js"></script> <script src="~/lib/jquery/dist/jquery.js"></script> <script type="text/javascript"> //center coordinates 51.25671387,25.37103756 var centerLon = "116.4"; //WGS LL84 116.4 var centerLat = "39.9";// 39.9 var angle = 0; var singLon = ""//单个设备经度 var singLat = ""//单个设备纬度 var singDir = ""//单个设备方位角 window.onload = function () { //绘制多边形 var source = new ol.source.Vector({ wrapX: false }); var vector = new ol.layer.Vector({ source: source, }); var tileLayer = new ol.layer.Tile({ source: new ol.source.XYZ({ //crossOrigin: 'anonymous', url: 'http://t{0-7}.tianditu.gov.cn/DataServer?T=img_w&x={x}&y={y}&l={z}&tk=51de0c577bdb04c396974492663ecb3b' }), }) var baseLayer = new ol.layer.Vector({ renderMode: 'image', style: new ol.style.Style({ fill: new ol.style.Fill({ color: 'rgba(220,20,60)' }), stroke: new ol.style.Stroke({ color: 'rgba(220,20,60)', width: 1 }) }) }) console.log("经纬度是------" + centerLon + "----" + centerLat) //初始化地图对象 var map = new ol.Map({ target: 'map', layers: [tileLayer, vector, baseLayer ], view: new ol.View({ //center: [12959347, 5129096], //center: [13738584, 5127096], //center:ol.proj.fromLonLat([104.912777, 34.730746]), projection: "EPSG:4326", //使用这个坐标系 //center: [centerLon, centerLat], center: [centerLon, centerLat], //center: [51.18255615, 25.28942879], //地图中心坐标 //rotation: Math.PI / 6, 12959347,5129096 128698.1333333333, 91772.96470588235 zoom: 13, maxZoom: 18, minZoom: 5 }) }); //单位换算 var metersPerUnit = map.getView().getProjection().getMetersPerUnit(); var circleRadius = 5000 / metersPerUnit; //绘画多边形 var draw; // global so we can remove it later function addInteraction() { draw = new ol.interaction.Draw({ source: source, type: 'Polygon', }); //获取绘画多边形的坐标点 draw.on('drawend', function (evt) { var feature = evt.feature; var geometry = feature.getGeometry(); var coordinate = geometry.getCoordinates(); localStorage.setItem("lonLat", coordinate); }) map.addInteraction(draw); } addInteraction(); //根据坐标点绘画多边形(回显之前绘画的多边形) //localStorage.removeItem('lonLat') var coordinatesOld = [] console.log(localStorage.getItem('lonLat')) coordinatesOld = localStorage.getItem('lonLat').split(",") //var coordinatesOld = [] //coordinatesOld.push(localStorage.getItem('lonLat')); console.log(coordinatesOld) console.log(typeof (coordinatesOld)) let chunk = function (array, size) { let [start, end, result] = [null, null, []]; for (let i = 0; i < Math.ceil(array.length / size); i++) { start = i * size; end = start + size; result.push(array.slice(start, end)); } return result; }; var coordinates = chunk(coordinatesOld, 2) console.log(coordinates); if (coordinates == null) { console.log("之前没画过多边形,本地存储为空"); } else { console.log("本地有存储数据"); console.log(coordinates); //coordinates = [[116.5169448852539, 40.093059541890405], [116.48700713692233, 40.0359306272585], //[116.50705719413236, 40.09717941493728], [116.5169448852539, 40.093059541890405]] //声明一个新的数组 var coordinatesPolygon = new Array(); //循环遍历将经纬度转到"EPSG:4326"投影坐标系下 for (var i = 0; i < coordinates.length; i++) { var pointTransform = ol.proj.fromLonLat([coordinates[i][0], coordinates[i][1]], "EPSG:4326"); coordinatesPolygon.push(pointTransform); } var sourceVV = new ol.source.Vector(); var vector = new ol.layer.Vector({ source: sourceVV, style: new ol.style.Style({ fill: new ol.style.Fill({ color: 'rgba(255, 255, 255, 0.1)' }), stroke: new ol.style.Stroke({ color: 'red', width: 2 }), image: new ol.style.Circle({ radius: 10, fill: new ol.style.Fill({ color: '#ffcc33' }) }) }) }); map.addLayer(vector); //多边形此处注意一定要是[坐标数组] var plygonVV = new ol.geom.Polygon([coordinatesPolygon]) //多边形要素类 var featureVV = new ol.Feature({ geometry: plygonVV, }); sourceVV.addFeature(featureVV); //map.addInteraction(source); } //相应的圆的样式 function MyStyle() { //返回一个样式 return new ol.style.Style({ fill: new ol.style.Fill({ color: 'rgba(255, 255, 255, 0.5)', }), //stroke: new ol.style.Stroke({ //color: 'red', //width: 1 //}) }); }; //创建单个设备显示图标方法 function createMark(lon, lat, dir) { var rome = new ol.Feature({ geometry: new ol.geom.Point([lon, lat]), }); rome.setStyle( new ol.style.Style({ image: new ol.style.Icon({ color: '#FFFFFF', crossOrigin: 'anonymous', // For Internet Explorer 11 imgSize: [40, 40], src: '/imgs/2.png', }), }) ); var vectorSource = new ol.source.Vector({ features: [rome], }); var vectorLayer = new ol.layer.Vector({ source: vectorSource, }); /**圆 */ var centerradius = new ol.geom.Circle([lon, lat], circleRadius); var circlefeature = new ol.Feature({ geometry: centerradius, name: 'sdsdsd' }); circlefeature.setStyle(MyStyle(circlefeature)); var vectorSourceCircle = new ol.source.Vector({ features: [circlefeature], }); //初始化矢量图层 vectorLayerCircle = new ol.layer.Vector({ //数据源 source: vectorSourceCircle }); map.addLayer(vectorLayerCircle); return vectorLayer } //创建多个设备显示图标方法 function createMark2(lon, lat) { var rome = new ol.Feature({ geometry: new ol.geom.Point([lon, lat]), }); rome.setStyle( new ol.style.Style({ image: new ol.style.Icon({ color: '#FFFFFF', crossOrigin: 'anonymous', // For Internet Explorer 11 imgSize: [40, 40], src: '/imgs/1.png', }), }) ); var vectorSource = new ol.source.Vector({ features: [rome], }); var vectorLayer = new ol.layer.Vector({ source: vectorSource, }); return vectorLayer } /** 侦测范围圆圈end */ //获取单个设备接口(地图旋转) function EquipmentSingle(extent, resolution, projection) { var url = '/api/Equipment/received'; var xhr = new XMLHttpRequest(); xhr.open('GET', url, true); var onError = function () { vectorSource.removeLoadedExtent(extent); } xhr.onerror = onError; xhr.onload = function () { if (xhr.status == 200) { console.log(xhr.responseText); if (xhr.responseText != null) { var dataSingle = JSON.parse(xhr.responseText); console.log(dataSingle.direction) singLon = dataSingle.longitude singLat = dataSingle.latitude singDir = dataSingle.direction //this.setCentdataSingle.longitudeerInternal(fromUserCoordinate([116.435, 36.1], this.getProjection())); //重新定义中心点,并显示单个设备图标 var d = [singLon, singLat] map.getView().setCenter(d); var mark = createMark(singLon, singLat, singDir); map.addLayer(mark); //点击单个设备图标,显示设备详细信息 //mark.on("click", function () { //console.log("点击单个设备了"); //}); //根据单个设备方位角,实现地图自动旋转 var view = map.getView(); //angle = angle - 1; angle = 0 - singDir; console.log(angle); var r = Math.PI / 180 * angle console.log(r); view.setRotation(r) } } else { onError(); } } xhr.send(); } EquipmentSingle() //获取多个设备接口 function EquipmentMany(extent, resolution, projection) { var url = '/api/Equipment/receivedList'; var xhr = new XMLHttpRequest(); xhr.open('GET', url, true); var onError = function () { vectorSource.removeLoadedExtent(extent); } xhr.onerror = onError; xhr.onload = function () { if (xhr.status == 200) { var moreDate = JSON.parse(xhr.responseText) //moreDate.push(xhr.responseText); console.log("多个设备数据内容是---" + moreDate); if (moreDate != null) { for (i = 0; i < moreDate.length; i++) { console.log(moreDate[i].longitude) console.log(moreDate[i].latitude) var mark = createMark2(moreDate[i].longitude, moreDate[i].latitude); map.addLayer(mark); } } } else { onError(); } } xhr.send(); } EquipmentMany() /** *目标显示处理 */ //创建监测目标显示图标方法 function destination(lng,lat, heading, distance) { //计算扇形的眯点坐标 heading = (heading + 360) % 360; var rad = Math.PI / 180, radInv = 180 / Math.PI, R = 6378137, // approximation of Earth's radius lon1 = lng * rad, lat1 = lat * rad, rheading = heading * rad, sinLat1 = Math.sin(lat1), cosLat1 = Math.cos(lat1), cosDistR = Math.cos(distance / R), sinDistR = Math.sin(distance / R), lat2 = Math.asin( sinLat1 * cosDistR + cosLat1 * sinDistR * Math.cos(rheading) ), lon2 = lon1 + Math.atan2( Math.sin(rheading) * sinDistR * cosLat1, cosDistR - sinLat1 * Math.sin(lat2) ); lon2 = lon2 * radInv; lon2 = lon2 > 180 ? lon2 - 360 : lon2 < -180 ? lon2 + 360 : lon2; lat2 = lat2 * radInv return [lon2,lat2] } //目标显示及光圈接口 function FindTarget() { var url = '/api/Target/received'; var xhr = new XMLHttpRequest(); xhr.open('GET', url, true); var onError = function () { vectorSource.removeLoadedExtent(extent); } xhr.onerror = onError; xhr.onload = function () { if (xhr.status == 200) { console.log("22发现目标接口内容是---" + xhr.responseText); var targetDate = JSON.parse(xhr.responseText) console.log("11发现目标接口内容是---" + targetDate); if (targetDate != null) { var points = [] for (i = 0; i < targetDate.length; i++) { console.log(targetDate[i].longitude) //var mark = createMark3(targetDate[i].longitude, targetDate[i].latitude); //map.addLayer(mark); //定义一个矢量图层,用于打点 var pointAnimationLayer = new ol.layer.Vector({ source: new ol.source.Vector(), style: new ol.style.Style({ image: new ol.style.Circle({ fill: new ol.style.Fill({ color: 'rgba(220,20,60)' }), radius: 6 }) }) }) var yuanLon = targetDate[i].longitude; var yuanLat = targetDate[i].latitude map.addLayer(pointAnimationLayer); var newLo = destination(targetDate[i].longitude, targetDate[i].latitude, targetDate[i].direction, targetDate[i].distance) //latlog(targetDate[i].latitude, targetDate[i].longitude, targetDate[i].distance, targetDate[i].direction) //getLonAndLat(targetDate[i].longitude, targetDate[i].latitude, targetDate[i].direction, targetDate[i].distance) console.log("111目标的经纬度是-----" + newLo) //随机写的点坐标 //var points = [targetDate[i].longitude, targetDate[i].latitude] //points.push([117.29879804725245, 41.06100257718706]); //points.push([117.80401421903063, 41.510545747212845]); points.push(newLo); console.log(points); //将点添加到图层 points.forEach(element => { var ft = new ol.Feature({ geometry: new ol.geom.Point(element) }); pointAnimationLayer.getSource().addFeature(ft); }); //map渲染事件,回调动画 map.on('postcompose', animation); //样式中的半径变量,通过不断刷新点样式的半径来实现点动态扩散 var radius = 1; //动画 function animation(event) { if (radius >= 20) { radius = 0 } var opacity = (20 - radius) * (1 / 20);//不透明度 var pointStyle = new ol.style.Style({ image: new ol.style.Circle({ radius: radius, stroke: new ol.style.Stroke({ color: 'rgba(220,20,60)', width: 4 - radius / 10 }) }) }) var features = pointAnimationLayer.getSource().getFeatures(); var vectorContext = event.vectorContext; vectorContext.setStyle(pointStyle); features.forEach(element => { var geom = element.getGeometry(); vectorContext.drawGeometry(geom); }); radius = radius + 0.3; //触发map的postcompose事件 map.render(); } /** * 创建扇形 * param [x,y] center 扇形中心点 * param number randius 扇形半径 与中心点对应的坐标系单位 * param number sAngle 扇形起始边与X轴正方向夹角° * param number angle 圆心角°(逆时针方向为正) * returns {ol.geom.Polygon} * constructor */ ol.geom.Sector = function (center, randius, sAngle, angle) { sAngle = (360 - sAngle + 90) % 360; var points = []; points.push(center); var ep = null; for (var i = 0; i <= angle; ++i) { var x = center[0] + randius * Math.cos(degreeToRadian(sAngle + i)); var y = center[1] + randius * Math.sin(degreeToRadian(sAngle + i)); points.push([x, y]); } points.push(center); return new ol.geom.Polygon([points]); }; var degreeToRadian = function (degree) { return Math.PI * degree / 180; }; var lt = { lng: centerLon, lat: centerLat } var sector = new ol.geom.Sector( [targetDate[i].longitude, targetDate[i].latitude],//圆心 circleRadius,//半径 targetDate[i].direction+10,//弧度 20 //方向角 ) var sectorFeature = new ol.Feature({ geometry: sector, }); var sectorStyle = new ol.style.Style({ stroke: new ol.style.Stroke({ color: 'red', lineDash: [0], width: 2 }), fill: new ol.style.Fill({ color: 'rgba(0, 0, 255, 0.2)' }) }); //iconStyle.getImage().setScale(0.3); sectorFeature.setStyle(sectorStyle); var vectorSourceSector = new ol.source.Vector({ features: [sectorFeature] }); var vectorLayerSector = new ol.layer.Vector({ source: vectorSourceSector }); map.addLayer(vectorLayerSector); } } } else { onError(); } } xhr.send(); } FindTarget() //添加比例尺 //function AddScaleLint() { //var scaleLineControl = new ol.control.ScaleLine({ //Units: 'metric',//单位有5种:degrees imperial us nautical metric //}); //map.addControl(scaleLineControl); //} //AddScaleLint(); //map.setCenter(new ol.LonLat(lon, lat).transform( // new ol.Projection("EPSG:4326"), // map.getProjectionObject()), 4); var style = new ol.style.Style({ fill: new ol.style.Fill({ color: 'rgba(255, 255, 255, 0.6)', }), stroke: new ol.style.Stroke({ color: '#319FD3', width: 1, }), text: new ol.style.Text({ font: '10px Calibri,sans-serif', fill: new ol.style.Fill({ color: '#000', }), stroke: new ol.style.Stroke({ color: '#fff', width: 2, }), }), }); var style2 = new ol.style.Style({ fill: new ol.style.Fill({ color: 'rgba(255, 255, 255, 0.6)', }), stroke: new ol.style.Stroke({ color: "orange", width: 2, }), text: new ol.style.Text({ padding: [10, 10, 10, 10], font: '9px Calibri,sans-serif', fill: new ol.style.Fill({ color: '#000', }), stroke: new ol.style.Stroke({ color: '#fff', width: map.getView().getZoom() > 10 ? 4 : 1, }), }), }); /** *计算轨迹长度 */ //function getLineLength(line) { //var coordinates = line.getCoordinates(); //var length = 0; //var sourceProj = map.getView().getProjection(); //for (var i = 0, ii = coordinates.length - 1; i < ii; ++i) { //var c1 = ol.proj.transform(coordinates[i], sourceProj, 'EPSG:4326'); //var c2 = ol.proj.transform(coordinates[i + 1], sourceProj, 'EPSG:4326'); //length += new ol.sphere(6378137).haversineDistance(c1, c2); //length += ol.sphere.getDistance(c1, c2, 6378137); //} //return (Math.round(length * 100) / 100); //} function styleFunction(feature, resolution) { //var style = new ol.style.Style({ // //fill: new ol.style.Fill({ // // color: 'rgba(241,242,236,0.8)', // //}), // stroke: new ol.style.Stroke({ // color: 'red', // width: 2 // }), // text: new ol.style.Text({ // font: '12px sans-serif', // offsetX: 0, // offsetY: -7, // //scale: map.getView().getZoom() / 10, // placement: 'point', // //backgroundStroke: new ol.style.Stroke({ // // color: 'rgba(255,51,0,1)', // // width: 1 // //}), // ////标签的背景填充 // //backgroundFill: new ol.style.Fill({ // // color: 'rgba(255,51,0,1)' // //}), // fill: new ol.style.Fill({ // color: 'rgba(255,255,255,1)', // }) // }) //}); //console.log(feature.get('Name')) //console.log(resolution); //if (feature.get('Name')) { //0.000171661376953125--0.000021457672119140625 // style.getText().setText(resolution < 0.000171661376953125 ? feature.get('Name') : ''); //} style.getText().setText(feature.get('Name')); //styles.push(style); return style } function styleFunction2(feature, resolution) { var zoom = map.getView().getZoom(); console.log("zoom:" + zoom); //style2.setStroke(new ol.style.Stroke({ // color: "orange", // width: zoom > 10 ? 5 : 2, //})) style2.getText().setText(feature.get('Name')); return style2 } var vectorLayerPlaceName; var vectorLayerLine; var vectorSource; var vectorSourceLine; function LoadMapData(extent, resolution, projection) { var proj = projection.getCode(); console.log("proj:" + proj); console.log("extent:" + extent.join(',')) var zoom = map.getView().getZoom(); //获取当前地图的缩放级别 var url = '/api/data?bbox=' + extent.join(',') + "&l=" + zoom; //var url = 'https://ahocevar.com/geoserver/wfs?service=WFS&' + // 'version=1.1.0&request=GetFeature&typename=osm:water_areas&' + // 'outputFormat=application/json&srsname=' + proj + '&' + // 'bbox=' + extent.join(',') + ',' + proj; var xhr = new XMLHttpRequest(); xhr.open('GET', url, true); var onError = function () { vectorSource.removeLoadedExtent(extent); } xhr.onerror = onError; xhr.onload = function () { if (xhr.status == 200) { //console.log(xhr.responseText); if (xhr.responseText != null && xhr.responseText.length > 2) { vectorSource.addFeatures( vectorSource.getFormat().readFeatures(xhr.responseText)); } } else { onError(); } } xhr.send(); } function LoadMapDataLine(extent, resolution, projection) { var proj = projection.getCode(); console.log("proj:" + proj); console.log("extent:" + extent.join(',')) var zoom = map.getView().getZoom(); //获取当前地图的缩放级别 var url = '/api/data/line?bbox=' + extent.join(',') + "&l=" + zoom; //var url = 'https://ahocevar.com/geoserver/wfs?service=WFS&' + // 'version=1.1.0&request=GetFeature&typename=osm:water_areas&' + // 'outputFormat=application/json&srsname=' + proj + '&' + // 'bbox=' + extent.join(',') + ',' + proj; var xhr = new XMLHttpRequest(); xhr.open('GET', url, true); var onError = function () { vectorSourceLine.removeLoadedExtent(extent); } xhr.onerror = onError; xhr.onload = function () { if (xhr.status == 200) { //console.log(xhr.responseText); if (xhr.responseText != null && xhr.responseText.length > 2) { vectorSourceLine.addFeatures( vectorSourceLine.getFormat().readFeatures(xhr.responseText)); } } else { onError(); } } xhr.send(); } map.on("moveend", function (e) { var zoom = map.getView().getZoom(); //获取当前地图的缩放级别 var layer = map.getLayers() //console.log("zoom" + zoom); if (vectorLayerPlaceName != null || vectorLayerPlaceName == "undefined") { map.removeLayer(vectorLayerPlaceName); } vectorSource = new ol.source.Vector({ //url: 'https://openlayers.org/en/latest/examples/data/geojson/countries.geojson', //url:'data/geojson/testdata.geojson', //url:'data/geojson/12.geojson', //url:'data/geojson/countries.geojson', //url: '/data/geojson/point9.geojson', //url:'data/geojson/city.geojson', format: new ol.format.GeoJSON(), loader: function (extent, resolution, projection) { LoadMapData(extent, resolution, projection); }, strategy: ol.loadingstrategy.bbox }); vectorLayerPlaceName = new ol.layer.Vector({ source: vectorSource, style: styleFunction, projection: 'EPSG:4326',//定义坐标投影 //declutter: true, }); map.addLayer(vectorLayerPlaceName); //重新加载地图图层 if (vectorLayerLine != null || vectorLayerLine == "undefined") { map.removeLayer(vectorLayerLine); } vectorSourceLine = new ol.source.Vector({ format: new ol.format.GeoJSON(), loader: function (extent, resolution, projection) { LoadMapDataLine(extent, resolution, projection); }, strategy: ol.loadingstrategy.bbox }); vectorLayerLine = new ol.layer.Vector({ source: vectorSourceLine, style: styleFunction2, projection: 'EPSG:4326',//定义坐标投影 declutter: true, }); map.addLayer(vectorLayerLine); //重新加载地图图层 }); //矢量数据图层 var vectorLayer; //数据存放地址 var dataUrl; //视图中心点 var center; //地图缩放等级 var zoom; //地图投影 var projection = ol.proj.get('EPSG:3857'); //默认加载geojson格式数据 //loadVectData("geojson", "../data/geojson/countries.geojson"); //加载矢量数据函数 //dataType 数据类型 //dataUrl 数据URL //function loadVectData(dataType, dataUrl) { //如果当前存在矢量图层则移除 //if (vectorLayer != null || vectorLayer == "undefined") { //map.removeLayer(vectorLayer); //} //根据数据类型创建不同的矢量数据源 //switch (dataType) { //创建geojson矢量数据源 //case "geojson": //var vectorSource = new ol.source.Vector({ //url: dataUrl, //format: new ol.format.GeoJSON() //}); //break; //创建kml矢量数据源 //case "kml": //var vectorSource = new ol.source.Vector({ //url: dataUrl, //format: new ol.format.KML() //}); //break; //创建gpx矢量数据源 //case "gpx": //var vectorSource = new ol.source.Vector({ //url: dataUrl, //format: new ol.format.GPX() //}); //break; //} //初始化矢量数据图层 //vectorLayer = new ol.layer.Vector({ //source: vectorSource, //}); //加载矢量数据到map中 //map.addLayer(vectorLayer); //} }; </script> </head> <body> <div id="map"></div> </body> </html>

 浙公网安备 33010602011771号