Web框架整合-FLask
Flask
本指南介绍了如何在 Flask 中使用 pyecharts。
Flask 模板渲染
Step 0: 新建一个 Flask 项目
01 02 03 | $ mkdir pyecharts-flask-demo$ cd pyecharts-flask-demo$ mkdir templates |
Step 1: 拷贝 pyecharts 模板
将 pyecharts 模板,位于 pyecharts.render.templates 拷贝至刚新建的 templates 文件夹
01 02 03 04 05 06 07 08 09 | chenjiandongx@DESKTOP-E83NUHA:/mnt/d/Python/pyecharts-flask-demo/templates$ tree.├── jupyter_lab.html├── jupyter_notebook.html├── macro├── nteract.html├── simple_chart.html├── simple_page.html└── table.html |
Step 2: 渲染图表
请将下面的代码保存为 server.py 文件并移至项目的根目录下。
目录结构如下
01 02 03 04 | chenjiandongx@DESKTOP-E83NUHA:/mnt/d/Python/pyecharts-flask-demo$ tree -L 1.├── server.py└── templates |
示例代码
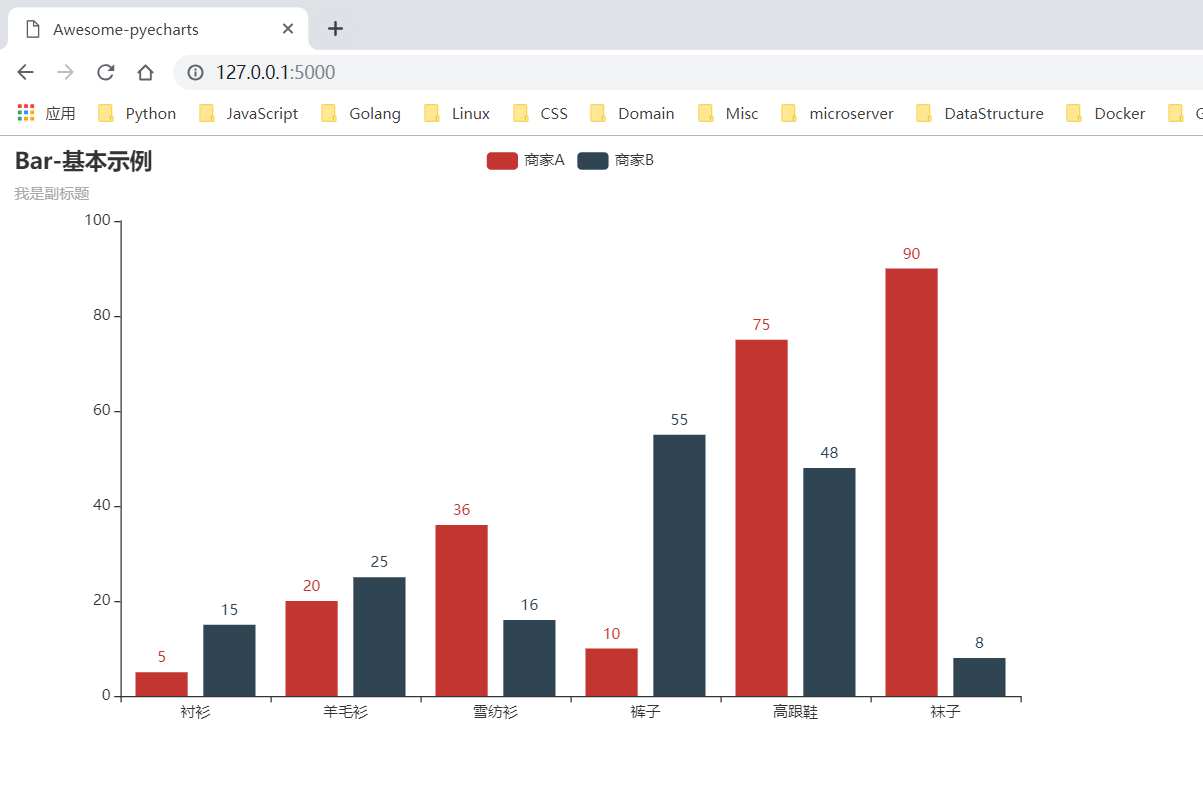
01 02 03 04 05 06 07 08 09 10 11 12 13 14 15 16 17 18 19 20 21 22 23 24 25 26 27 28 29 30 31 32 33 | from flask import Flaskfrom jinja2 import Markup, Environment, FileSystemLoaderfrom pyecharts.globals import CurrentConfig# 关于 CurrentConfig,可参考 [基本使用-全局变量]CurrentConfig.GLOBAL_ENV = Environment(loader=FileSystemLoader("./templates"))from pyecharts import options as optsfrom pyecharts.charts import Barapp = Flask(__name__, static_folder="templates")def bar_base() -> Bar: c = ( Bar() .add_xaxis(["衬衫", "羊毛衫", "雪纺衫", "裤子", "高跟鞋", "袜子"]) .add_yaxis("商家A", [5, 20, 36, 10, 75, 90]) .add_yaxis("商家B", [15, 25, 16, 55, 48, 8]) .set_global_opts(title_opts=opts.TitleOpts(title="Bar-基本示例", subtitle="我是副标题")) ) return c@app.route("/")def index(): c = bar_base() return Markup(c.render_embed())if __name__ == "__main__": app.run() |
Step 3: 运行项目
01 | $ python server.py |
使用浏览器打开 http://127.0.0.1:5000 即可访问服务
Flask 前后端分离
前后端分离可以使用动态更新数据,增量更新数据等功能。
Step 0,Step 1 参见上面模板渲染章节内容
Step 3: 新建一个 HTML 文件
新建 HTML 文件保存位于项目根目录的 templates 文件夹,这里以如下 index.html 为例. 主要用到了 jquery 和 pyecharts 管理的 echarts.min.js 依赖
index.html
01 02 03 04 05 06 07 08 09 10 11 12 13 14 15 16 17 18 19 20 21 22 23 24 25 26 27 | <!DOCTYPE html><html><head> <meta charset="UTF-8"> <title>Awesome-pyecharts</title> <script src="https://cdn.bootcss.com/jquery/3.0.0/jquery.min.js"></script> <script type="text/javascript" src="https://assets.pyecharts.org/assets/echarts.min.js"></script></head><body> <div id="bar" style="width:1000px; height:600px;"></div> <script> $( function () { var chart = echarts.init(document.getElementById('bar'), 'white', {renderer: 'canvas'}); $.ajax({ type: "GET", url: "http://127.0.0.1:5000/barChart", dataType: 'json', success: function (result) { chart.setOption(result); } }); } ) </script></body></html> |
Step 4: 编写 flask 和 pyecharts 代码渲染图表
请将下面的代码保存为 app.py 文件并移至项目的根目录下。
目录结构如下
01 02 03 04 | sunhailindeMacBook-Pro:pyecharts_flask sunhailin$ tree -L 1.├── app.py└── templates |
注: 目前由于 json 数据类型的问题,无法将 pyecharts 中的 JSCode 类型的数据转换成 json 数据格式返回到前端页面中使用。因此在使用前后端分离的情况下尽量避免使用 JSCode 进行画图。
app.py
01 02 03 04 05 06 07 08 09 10 11 12 13 14 15 16 17 18 19 20 21 22 23 24 25 26 27 28 29 30 31 32 33 34 35 | from random import randrangefrom flask import Flask, render_templatefrom pyecharts import options as optsfrom pyecharts.charts import Barapp = Flask(__name__, static_folder="templates")def bar_base() -> Bar: c = ( Bar() .add_xaxis(["衬衫", "羊毛衫", "雪纺衫", "裤子", "高跟鞋", "袜子"]) .add_yaxis("商家A", [randrange(0, 100) for _ in range(6)]) .add_yaxis("商家B", [randrange(0, 100) for _ in range(6)]) .set_global_opts(title_opts=opts.TitleOpts(title="Bar-基本示例", subtitle="我是副标题")) ) return c@app.route("/")def index(): return render_template("index.html")@app.route("/barChart")def get_bar_chart(): c = bar_base() return c.dump_options_with_quotes()if __name__ == "__main__": app.run() |
Step 5: 运行项目
01 | $ python app.py |
使用浏览器打开 http://127.0.0.1:5000 即可访问服务
定时全量更新图表
前端主动向后端进行数据刷新
定时刷新的核心在于 HTML 的 setInterval 方法。
index.html
01 02 03 04 05 06 07 08 09 10 11 12 13 14 15 16 17 18 19 20 21 22 23 24 25 26 27 28 29 30 31 32 33 34 | <!DOCTYPE html><html><head> <meta charset="UTF-8"> <title>Awesome-pyecharts</title> <script src="https://cdn.bootcss.com/jquery/3.0.0/jquery.min.js"></script> <script type="text/javascript" src="https://assets.pyecharts.org/assets/echarts.min.js"></script></head><body> <div id="bar" style="width:1000px; height:600px;"></div> <script> var chart = echarts.init(document.getElementById('bar'), 'white', {renderer: 'canvas'}); $( function () { fetchData(chart); setInterval(fetchData, 2000); } ); function fetchData() { $.ajax({ type: "GET", url: "http://127.0.0.1:5000/barChart", dataType: 'json', success: function (result) { chart.setOption(result); } }); } </script></body></html> |
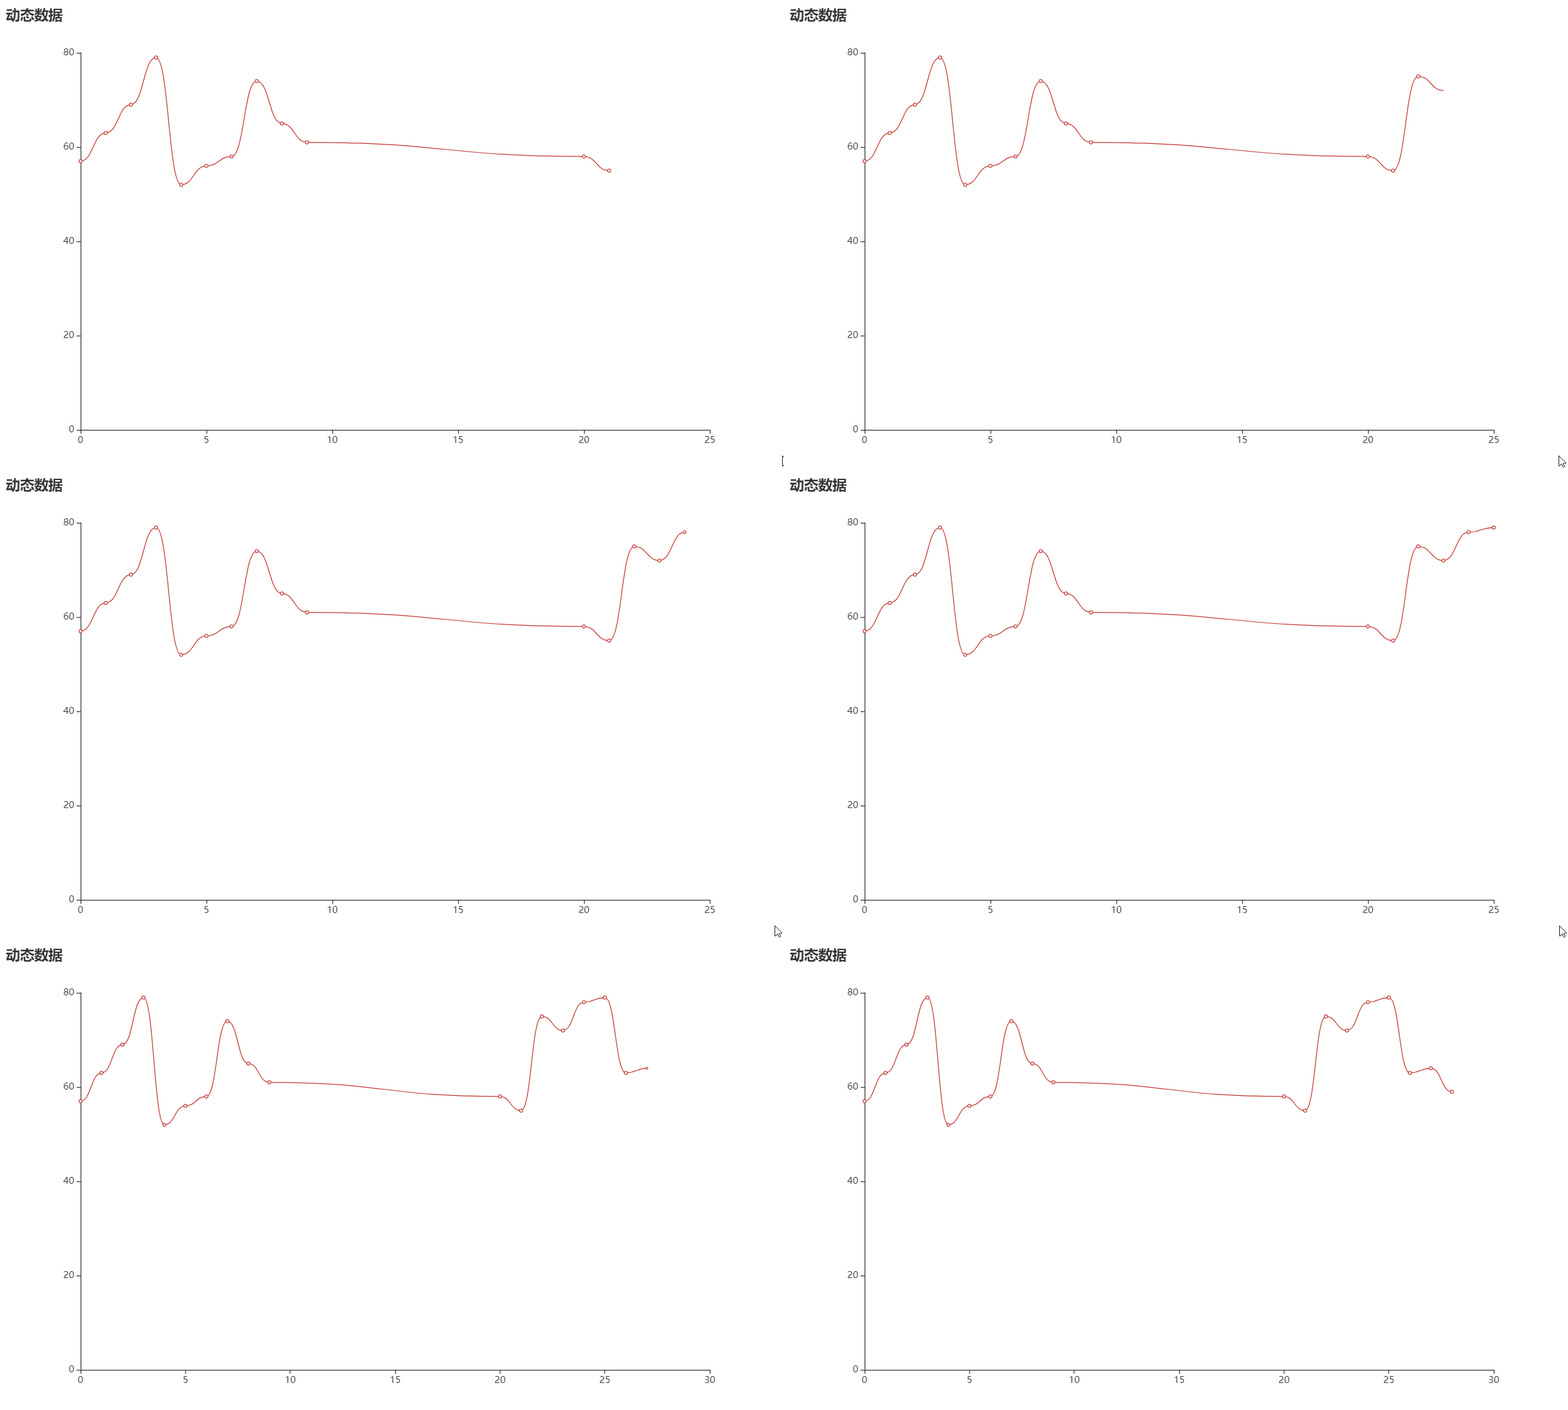
定时增量更新图表
index.html
01 02 03 04 05 06 07 08 09 10 11 12 13 14 15 16 17 18 19 20 21 22 23 24 25 26 27 28 29 30 31 32 33 34 35 36 37 38 39 40 41 42 43 44 45 46 47 48 49 50 | <!DOCTYPE html><html><head> <meta charset="UTF-8"> <title>Awesome-pyecharts</title> <script src="https://cdn.bootcss.com/jquery/3.0.0/jquery.min.js"></script> <script type="text/javascript" src="https://assets.pyecharts.org/assets/echarts.min.js"></script></head><body> <div id="bar" style="width:1000px; height:600px;"></div> <script> var chart = echarts.init(document.getElementById('bar'), 'white', {renderer: 'canvas'}); var old_data = []; $( function () { fetchData(chart); setInterval(getDynamicData, 2000); } ); function fetchData() { $.ajax({ type: "GET", url: "http://127.0.0.1:5000/lineChart", dataType: "json", success: function (result) { chart.setOption(result); old_data = chart.getOption().series[0].data; } }); } function getDynamicData() { $.ajax({ type: "GET", url: "http://127.0.0.1:5000/lineDynamicData", dataType: "json", success: function (result) { old_data.push([result.name, result.value]); chart.setOption({ series: [{data: old_data}] }); } }); } </script></body></html> |
增量更新后端代码也需要相应的改变
01 02 03 04 05 06 07 08 09 10 11 12 13 14 15 16 17 18 19 20 21 22 23 24 25 26 27 28 29 30 31 32 33 34 35 36 37 38 39 40 41 42 43 44 45 46 47 48 49 50 51 52 53 54 | from random import randrangefrom flask.json import jsonifyfrom flask import Flask, render_templatefrom pyecharts import options as optsfrom pyecharts.charts import Lineapp = Flask(__name__, static_folder="templates")def line_base() -> Line: line = ( Line() .add_xaxis(["{}".format(i) for i in range(10)]) .add_yaxis( series_name="", y_axis=[randrange(50, 80) for _ in range(10)], is_smooth=True, label_opts=opts.LabelOpts(is_show=False), ) .set_global_opts( title_opts=opts.TitleOpts(title="动态数据"), xaxis_opts=opts.AxisOpts(type_="value"), yaxis_opts=opts.AxisOpts(type_="value"), ) ) return line@app.route("/")def index(): return render_template("index.html")@app.route("/lineChart")def get_line_chart(): c = line_base() return c.dump_options_with_quotes()idx = 9@app.route("/lineDynamicData")def update_line_data(): global idx idx = idx + 1 return jsonify({"name": idx, "value": randrange(50, 80)})if __name__ == "__main__": app.run() |
天道酬勤 循序渐进 技压群雄


【推荐】国内首个AI IDE,深度理解中文开发场景,立即下载体验Trae
【推荐】编程新体验,更懂你的AI,立即体验豆包MarsCode编程助手
【推荐】抖音旗下AI助手豆包,你的智能百科全书,全免费不限次数
【推荐】轻量又高性能的 SSH 工具 IShell:AI 加持,快人一步
· TypeScript + Deepseek 打造卜卦网站:技术与玄学的结合
· 阿里巴巴 QwQ-32B真的超越了 DeepSeek R-1吗?
· 【译】Visual Studio 中新的强大生产力特性
· 10年+ .NET Coder 心语 ── 封装的思维:从隐藏、稳定开始理解其本质意义
· 【设计模式】告别冗长if-else语句:使用策略模式优化代码结构