pycharts-3D图表
3D图表
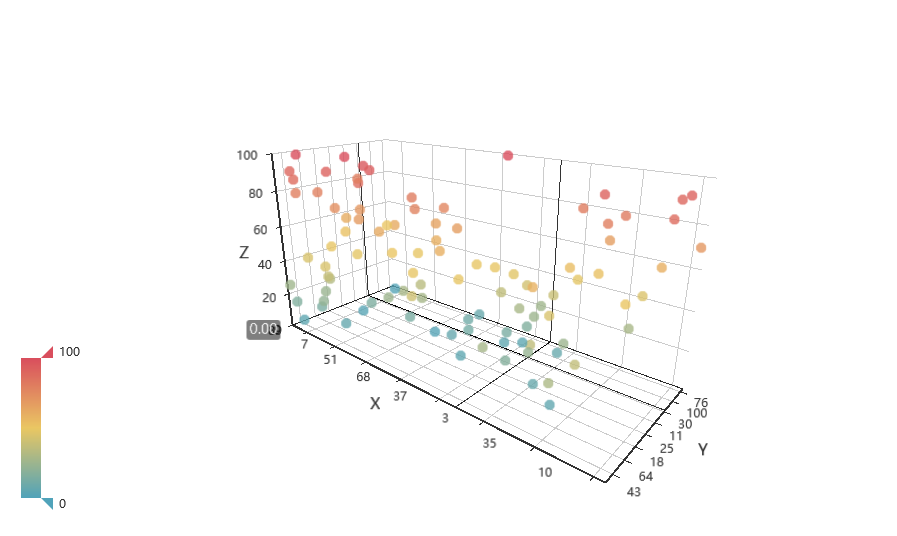
3D散点图
data = [(random.randint(0, 100), random.randint(0, 100), random.randint(0, 100)) for _ in range(100)]

scatter3D = (Scatter3D()
             .add("", data)
             )

scatter3D.render_notebook()
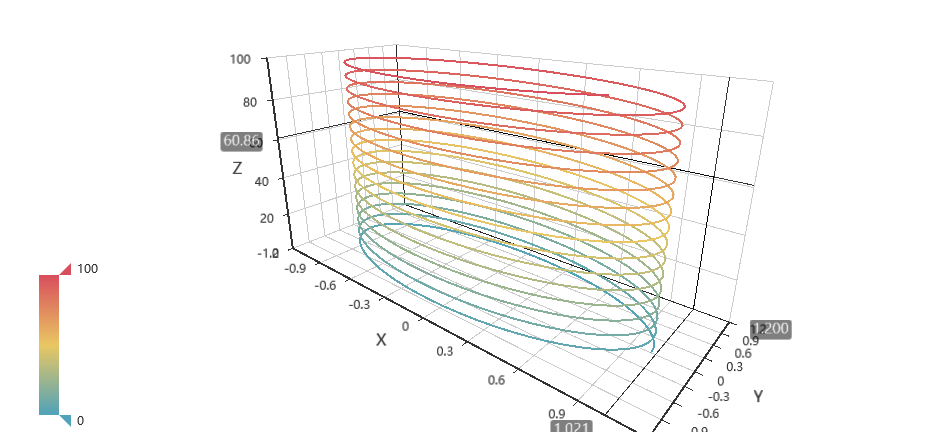
3D折线图
data = []
for t in range(0, 1000):
    x = math.cos(t/10)
    y = math.sin(t/10)
    z = t/10
    data.append([x, y, z])

line3D = (Line3D()
          .add("", data,
               xaxis3d_opts=opts.Axis3DOpts(type_="value"),
               yaxis3d_opts=opts.Axis3DOpts(type_="value"))
          )

line3D.render_notebook()
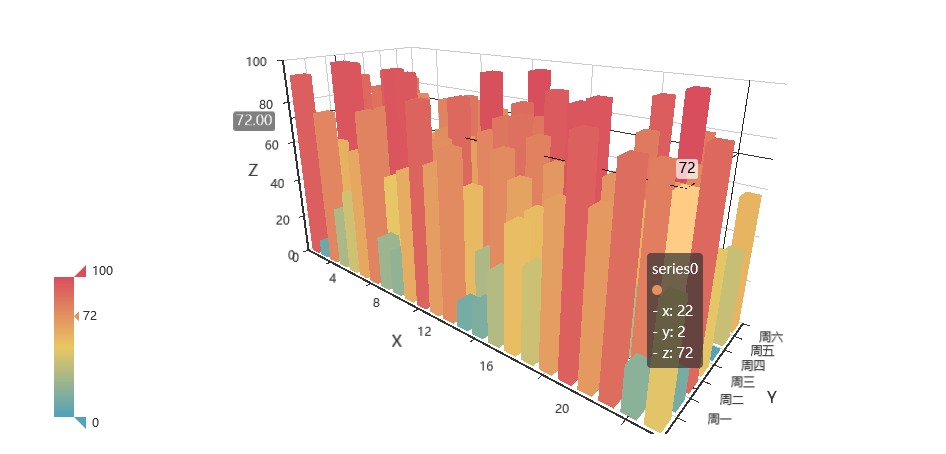
3D直方图
data = [[i, j, random.randint(0, 100)] for i in range(24) for j in range(7)]
hour_list = [str(i) for i in range(24)]
week_list = ['周日', '周一', '周二', '周三', '周四', '周五', '周六']


bar3D = (
    Bar3D()
    .add(
        "",
        data,
        xaxis3d_opts=opts.Axis3DOpts(hour_list, type_="category"),
        yaxis3d_opts=opts.Axis3DOpts(week_list, type_="category"),
        zaxis3d_opts=opts.Axis3DOpts(type_="value"),
    )
)

bar3D.render_notebook()
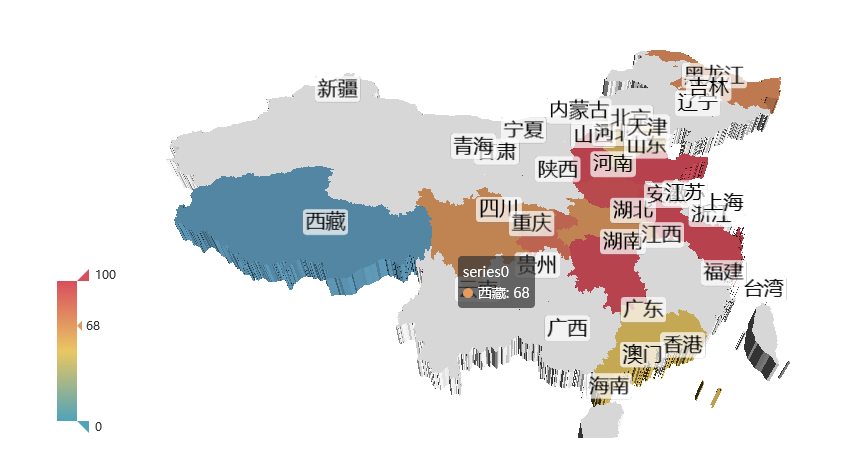
3D地图
# 虚假数据
province = [
    '广东',
    '湖北',
    '湖南',
    '四川',
    '重庆',
    '黑龙江',
    '浙江',
    '山西',
    '河北',
    '安徽',
    '河南',
    '山东',
    '西藏']
data = [(i, random.randint(50, 150)) for i in province]

map3d = (
    Map3D()
    .add("", data_pair=data, maptype='china')
)
map3d.render_notebook()
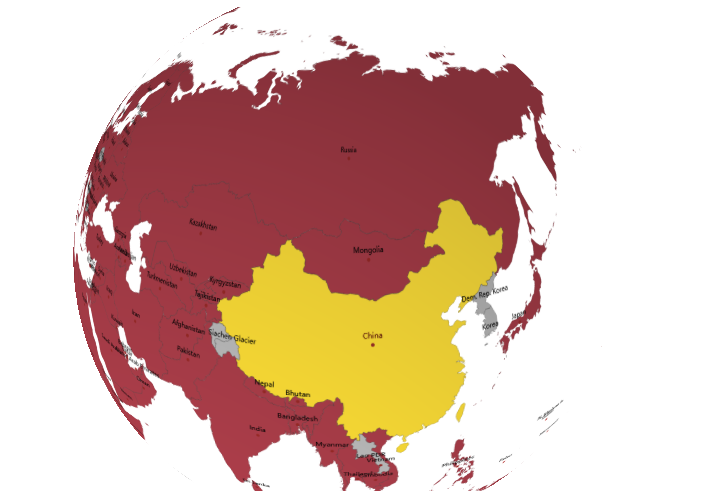
3D地球
from pyecharts.faker import POPULATION


mapglobe = (
    MapGlobe()
    .add_schema()
    .add(
        series_name="",
        maptype="world",
        data_pair=POPULATION[1:]
    )
)

mapglobe.render_notebook()
天道酬勤 循序渐进 技压群雄


