matplotlib的使用——annotate标注的使用
标注常用函数及其作用
1、plt.annotate()
plt.annotate(
	s,
	xy,
	*args,
	**kwargs)
其中常用的参数有:
1、s:代表标注的内容
2、xy:需要被标注的坐标,通过xycoords设置偏移方式
3、xytext:标注的文字的坐标,通过textcoords设置偏移方式
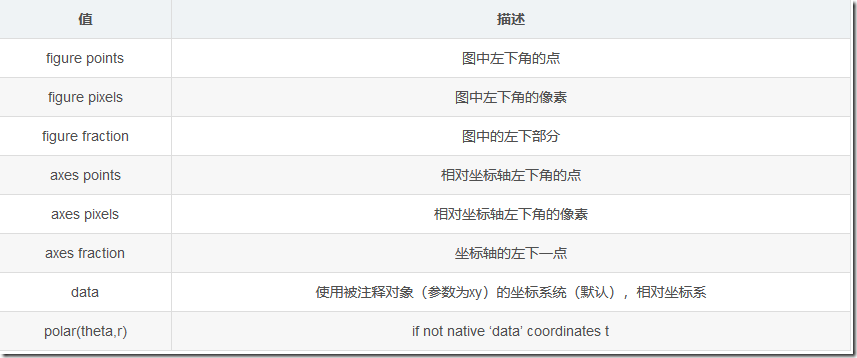
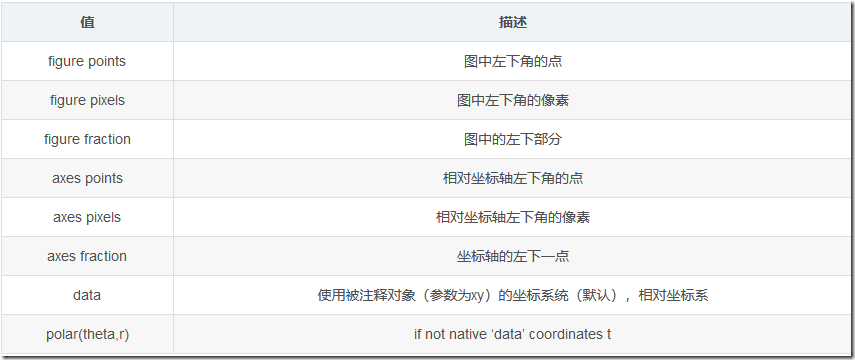
4、xycoords:用于设置xy的偏移方式

5、textcoords:用于设置xytext的偏移方式
6、color:设置字体颜色
{‘b’, ‘g’, ‘r’, ‘c’, ‘m’, ‘y’, ‘k’, ‘w’}
‘black’,'red’等 [0,1]之间的浮点型数据
RGB或者RGBA, 如: (0.1, 0.2, 0.5)、(0.1, 0.2, 0.5, 0.3)等7
7、arrowprops:箭头参数,参数类型为字典dict

width:箭头的宽度,以点为单位
headwidth:箭头底部的宽度,以点为单位
headlength:箭头的长度,以点为单位
shrink:从两端“收缩”的分数
facecolor:箭头颜色
arrowstyle:箭头的样式
connectionstyle:用于设置连接方式,可以设置弧度等
可以用字符串代表一个箭头的样式,用于arrowstyle。

接下来我将举例说明,如何利用annotate函数实现一个点的标注。
plt.annotate('2x+1=y',
	xy=(x0,y0),
	xycoords='data',
	xytext = (+30,-30),
	textcoords = 'offset points',
    fontsize = 16,
    arrowprops=dict(arrowstyle = '->',
    		connectionstyle = 'arc3,rad=0.2')
    )
其中:
(x0,y0)代表被标注的坐标;
xycoords = ‘data’代表使用被注释对象(参数为xy)的坐标系统;
xytext =(+30,-30)代表相对xy右偏移30单位,下偏移30单位;
textcoords = 'offset points’代表以点为单位;
fontsize = 16代表字体大小;
arrowprops=dict(arrowstyle = ‘->’,connectionstyle = ‘arc3,rad=0.2’)代表使用样式为’->'的箭头,并具有一定的连接弧度。

2、plt.text()
plt.text(
	x,
	y,
	s,
	fontdict=None,
	withdash=<deprecated parameter>,
	**kwargs)
1、x,y:代表标记所处的坐标值
2、s:代表标记的文字
3、fontsize:代表字体大小
4、verticalalignment:垂直对齐方式 ,可以选择(‘center’ , ‘top’ , ‘bottom’ , ‘baseline’ )
5、horizontalalignment:水平对齐方式 ,可以选择( ‘center’ , ‘right’ , ‘left’ )
6、xycoords:选择指定的坐标轴系统,与annotate函数类似
7、arrowprops:增加箭头,与annotate函数类似
width:箭头的宽度,以点为单位
headwidth:箭头底部的宽度,以点为单位
headlength:箭头的长度,以点为单位
shrink:从两端“收缩”的分数
facecolor:箭头颜色
arrowstyle:箭头的样式
connectionstyle:用于设置连接方式,可以设置弧度等
可以用字符串代表一个箭头的样式,用于arrowstyle。在这里插入图片描述

8、bbox:增加边框样式
boxstyle:方框外形;
facecolor:背景颜色;
edgecolor:边框线条颜色;
edgewidth:边框线条大小。
接下来我将举例说明,如何使用text函数
plt.text(0.5,-1,'This is a text',fontdict = {'size':12,'color':'green'})
其中:
- 0.5,-1代表被text所处的坐标;
- 'This is a text’代表标注的内容;
- fontdict = {‘size’:12,‘color’:‘green’}代表设置字号为12,颜色为绿色
应用示例
import matplotlib.pyplot as plt
import numpy as np

x = np.linspace(-1,1,50)
y1 = 2*x + 1

plt.xlim((-1,1))
plt.ylim((-2,5))
plt.xlabel('I am x label')
plt.ylabel('I am y label')
newTicks = np.linspace(-1,1,11)
plt.xticks(newTicks)
# y轴字体差别,设置成斜体
plt.yticks([-2,-1.0,0,1.5,3],
           [r'$really\ bad$',r'$little\ bad$',r'$normal$',r'$little\ good$',r'$pretty\ good$'])
plt.plot(x,y1)
# 获得当前的axis
ax = plt.gca()
# 设置图像的上边、右边axis为无色
ax.spines['right'].set_color('none')
ax.spines['top'].set_color('none')

# 设置x轴坐标在下部
ax.xaxis.set_ticks_position('bottom')
# 设置x轴位于图像y=0处
ax.spines['bottom'].set_position(('data', 0))
# 设置x轴坐标在左部
ax.yaxis.set_ticks_position('left')
# 设置y轴位于图像x=0处
ax.spines['left'].set_position(('data',0))

x0 = 0.5
y0 = x0*2+1
plt.scatter(x0,y0,s = 50,color = 'green')
plt.plot([x0,x0],[y0,0],'--',color = 'black')
plt.annotate('2x+1=y',xy=(x0,y0),xycoords='data',xytext = (+30,-30),textcoords = 'offset points',
    fontsize = 16,arrowprops=dict(arrowstyle = '->',connectionstyle = 'arc3,rad=0.2'))
plt.text(0.5,-1,'This is a text',fontdict = {'size':12,'color':'green'})
plt.show()


